

Markets move in waves. Not by accident, not necessarily by logic, but in patterns shaped by the psychology of crowds. When confidence runs high, prices climb, but when fear takes over, they fall.
When confidence runs high, prices climb, but when fear takes over, they fall.
It is precisely that rhythm that traders have been trying to decode for decades.
For those looking to read market structure more effectively, understanding how to use Elliott Wave Theory for trading offers a proven framework.
It helps traders identify market cycles, anticipate turning points, and manage risk with greater confidence.
The idea is not about magical forecasting. It is about reading the structure of price movement and aligning trades with momentum.
In this blog, we will walk through the core wave structure, the rules that validate every setup, practical trading strategies, and how to manage risk when applying Elliott Waves in real markets.
Understanding The Elliott Wave Theory
Before applying any strategy, traders must understand the basic wave structure.
The Elliott Wave Theory was developed by Ralph Nelson Elliott in the 1930s, and it depends on the point that prices of the market oscillate within the cycles that are progressive because they are guided by the psychology of the collective investors.
These cycles are 5 wave impulse and a 3-wave correction.
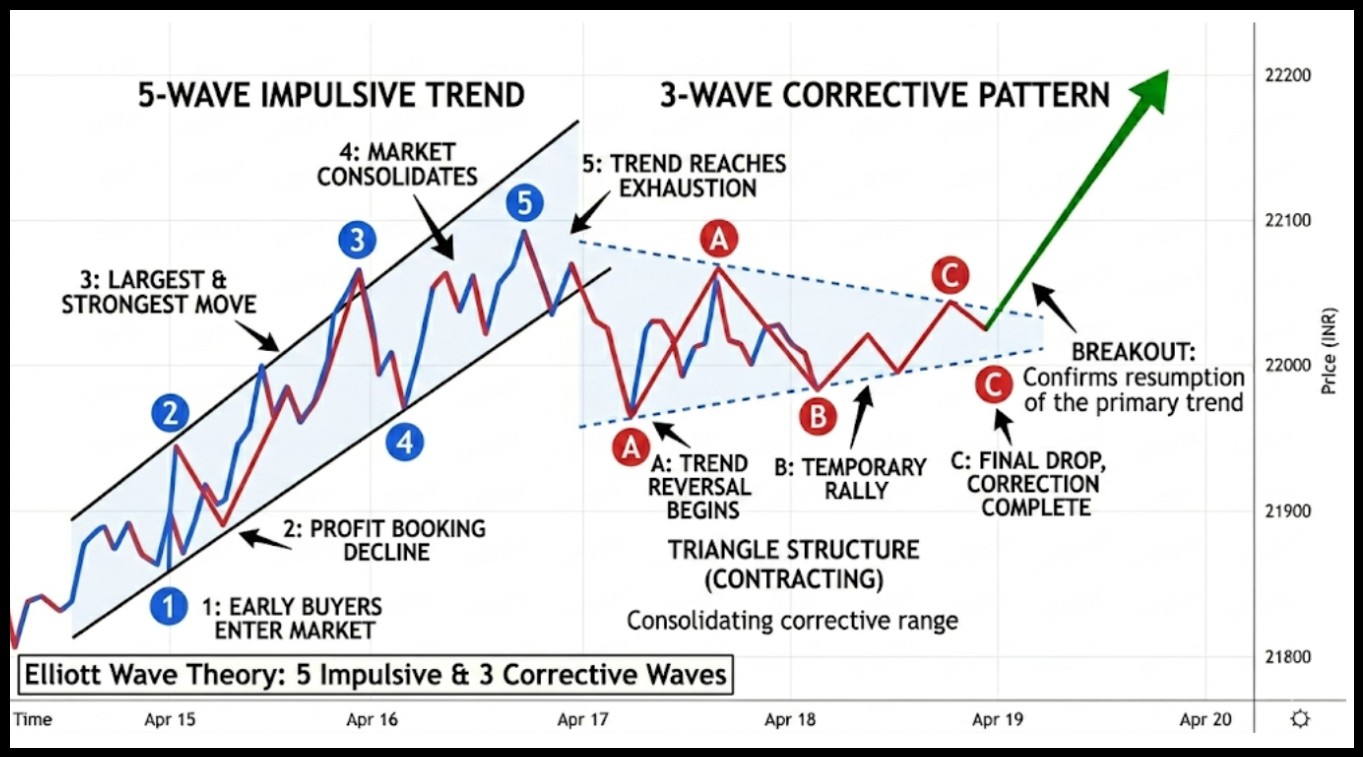
Let us understand the direction and description of each wave through the table given below:
| Wave Type | Direction | Description |
| Wave 1 | Uptrend | Early buyers enter the market |
| Wave 2 | Pullback | Profit booking causes a decline |
| Wave 3 | Strong trend | Largest and strongest move |
| Wave 4 | Correction | Market consolidates |
| Wave 5 | Final push | Trend reaches exhaustion |
| Wave A | Downtrend | Trend reversal begins |
| Wave B | Temporary rally | Traders think the trend continues |
| Wave C | Final drop | Correction completes |
The 5 waves move with the trend, and the 3 corrective waves move against it.
Before placing a trade using Elliott Wave, traders rely on three strict rules that confirm whether a wave count is valid.
These rules act as a quick filter. If any rule breaks, the wave count is wrong, and the trade idea should be rejected immediately.
They help traders avoid forced interpretations and keep analysis disciplined.
The Three Non-Negotiable Rules:
- Wave 2 cannot Go Beyond The Start Of Wave 1: If the price breaks the origin of Wave 1, the impulsive structure is invalid.
- Wave 3 Is Never The Shortest Wave: Among Waves 1, 3, and 5, Wave 3 must not be the smallest.
- Wave 4 Cannot Enter Wave 1 Territory: Wave 4 must stay above the price range of Wave 1 in an uptrend.
How To Use Elliott Wave Theory?
Theory becomes valuable only when applied to real charts.
If you are a beginner wondering how to do Elliott Wave analysis on a live market, the process involves combining structural counts with technical tools.
Traders commonly use the counts of waves alongside technical indicators like the Fibonacci retracements, support levels, and momentum indicators that become accessible on the trading platforms like TradingView or MetaTrader.
Step-by-Step process traders follow:
| Step | What Traders Do | Why It Matters |
| Identify Trend | Analyze higher timeframe charts (daily or 4H) to determine the dominant market direction. | Trading with the main trend increases probability and avoids counter-trend trades. |
| Count Wave Structure | Identify a developing 5-wave impulse structure using Elliott Wave rules. | Correct wave labeling helps anticipate the next impulsive move. |
| Look For Wave 2 Entry | Wait for Wave 2 to retrace about 61% to 70% of Wave 1 using Fibonacci retracement tools. Watch for bullish reversal candles or momentum shift. | Wave 2 often offers the best risk-to-reward entry because the trend is just starting while the stop loss remains small. |
| Look For Wave 4 Entry | After Wave 3 completes, watch for a 38.2% Fibonacci retracement of Wave 3 with sideways consolidation or declining volume. | Wave 4 entries allow traders to position early before the final Wave 5 move. |
| Confirm With Indicators | Use indicators such as RSI divergence, MACD momentum shifts, or volume expansion to confirm the correction is ending. | Indicator confirmation reduces the risk of entering before the correction completes. |
| Plan Entry | Enter when price shows reversal candles, break of correction trendline, or momentum shift near the Fibonacci zone. | This signals that the correction may be finished and the next impulsive wave could start. |
| Manage Risk | Place stop loss below the Wave 1 origin for Wave 2 trades or below the Wave 3 low for Wave 4 trades. | Clear invalidation points protect capital if the wave count turns out to be wrong. |
The key idea is simple. Traders prefer to ride Wave 3, which is the most powerful one in the sequence.
Wave 3 tends to move a greater distance and gains the highest volume.
Elliott Wave Theory Trading Strategies Used By Traders
Advanced traders can hardly depend on counts of waves. They are a combination of structure, Fibonacci, and momentum confirmation.
Strategy 1: Trading Wave 3 Momentum
The third wave is normally the biggest and quickest movement. Precise Elliott wave calculations are essential here to project where this momentum might peak.
Typical characteristics:
- Strong volume expansion
- Price breaks previous highs
- Momentum indicators surge
Example scenario:
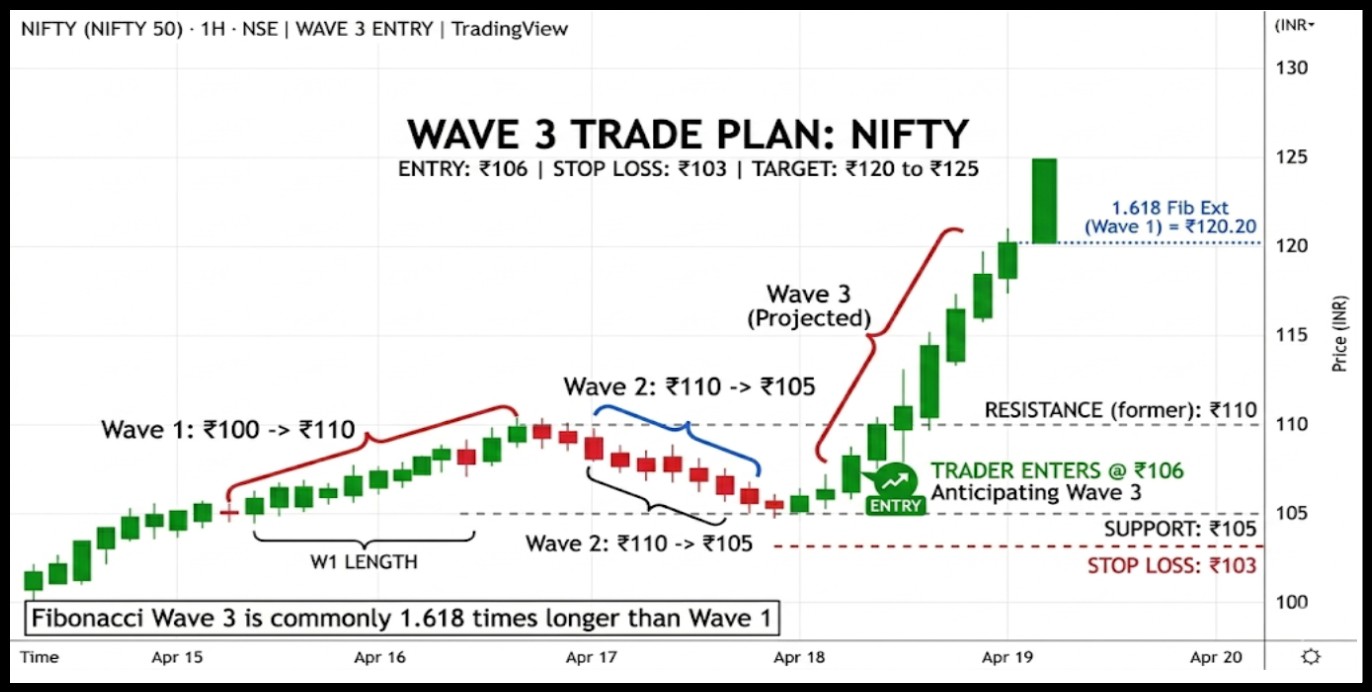
A stock rises from ₹100 to ₹110 (Wave 1), marking a 10-point impulse move.
Price then retraces to ₹103 (Wave 2), which is approximately a 70% retracement of Wave which is within the expected 61% to 78.6% Fibonacci zone.
A trader anticipates Wave 3 and enters near ₹104 after spotting a bullish reversal candle at the retracement zone.
Potential outcome:
| Entry | Stop Loss | Target |
| ₹104 | ₹99 | ₹120 to ₹125 |
Stop loss is placed just below the Wave 1 origin at ₹100, keeping the invalidation point clean. Since Wave 3 is commonly 1.618 times the length of Wave 1, the target of ₹120 to ₹125 aligns with that Fibonacci extension.
Exit Strategy:
- Book partial profits as price approaches the 1.618 Fibonacci extension of Wave 1, since Wave 3 often slows down near this zone.
- Move the stop loss below the most recent swing low or trailing support to protect gains if momentum weakens.
Strategy 2: Trading Wave 5 Exhaustion
Wave 5 is often the final move before a correction begins.
Clues traders watch:
- RSI divergence
- Slowing momentum
- Weak price breakout
Example:
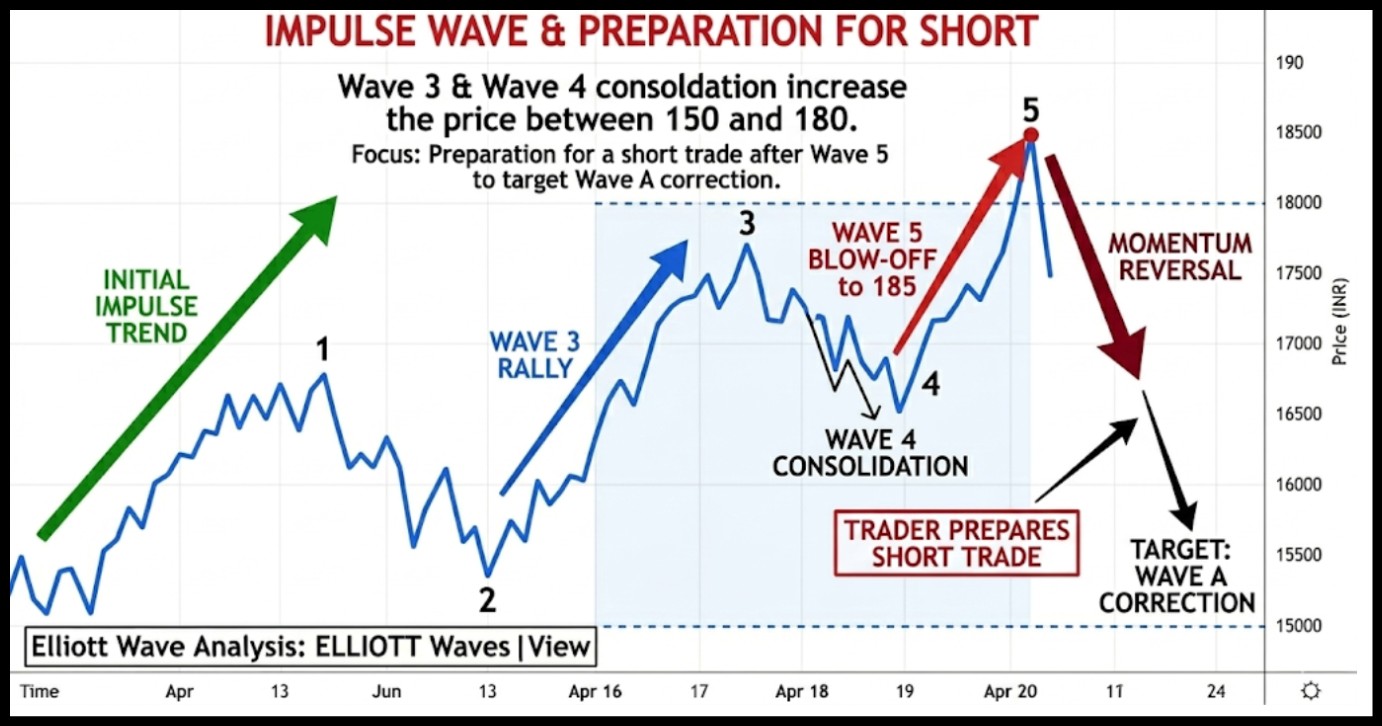
Wave 3 and Wave 4 consolidation increase the price between 150 and 180.
Wave 5 carried to 185, and then the momentum went against it.
A trader may prepare for a short trade targeting Wave A correction.
Exit Strategy:
- Take profit near the expected Wave A correction level, often around the previous Wave 4 zone, where price commonly retraces after Wave 5 exhaustion.
- Place a stop loss slightly above the Wave 5 high to protect capital in case the trend extends, and the market forms a larger impulse instead of reversing.
Strategy 3: Trading Wave C Correction

One commonly traded setup in Elliott Wave analysis is capturing Wave C of a correction. This strategy focuses on entering the market after Wave B finishes, when the correction is about to complete.
Since Wave C often mirrors or exceeds the length of Wave A, it can offer a clear and tradable move. In markets like Nifty and Bank Nifty, traders frequently use this approach during short-term pullbacks within larger trends.
How Traders Typically Approach This Setup:
- Wait for a clear 3-wave corrective structure forming Wave A and Wave B.
- Identify Wave B as a false recovery where price retraces much of Wave A.
- Enter near the start of Wave C, expecting momentum to return.
- Place a stop loss slightly above the Wave B high (or below in bullish corrections).
- Target 100 percent or more of Wave A’s length as the Wave C objective.
Elliott Wave Strategies
Many traders assume wave analysis only works on long-term charts. That assumption is incorrect.
The same wave structure that appears on weekly charts also develops on 5-minute, 15-minute, and hourly charts, making Elliott Wave a genuinely useful tool for intraday traders.
The logic does not change, only the timeframe does. If you are wondering which time frame is best for Elliott wave, the answer depends on your trading style.
For intraday Elliott Wave trading, the 15-minute chart works well for identifying the primary wave structure, while the 5-minute chart helps refine entries and exits.
The 1-hour chart serves as the higher timeframe reference to confirm the dominant intraday trend before placing any trade.
Intraday Wave Structure Example
Let us understand this theory through a chart example:
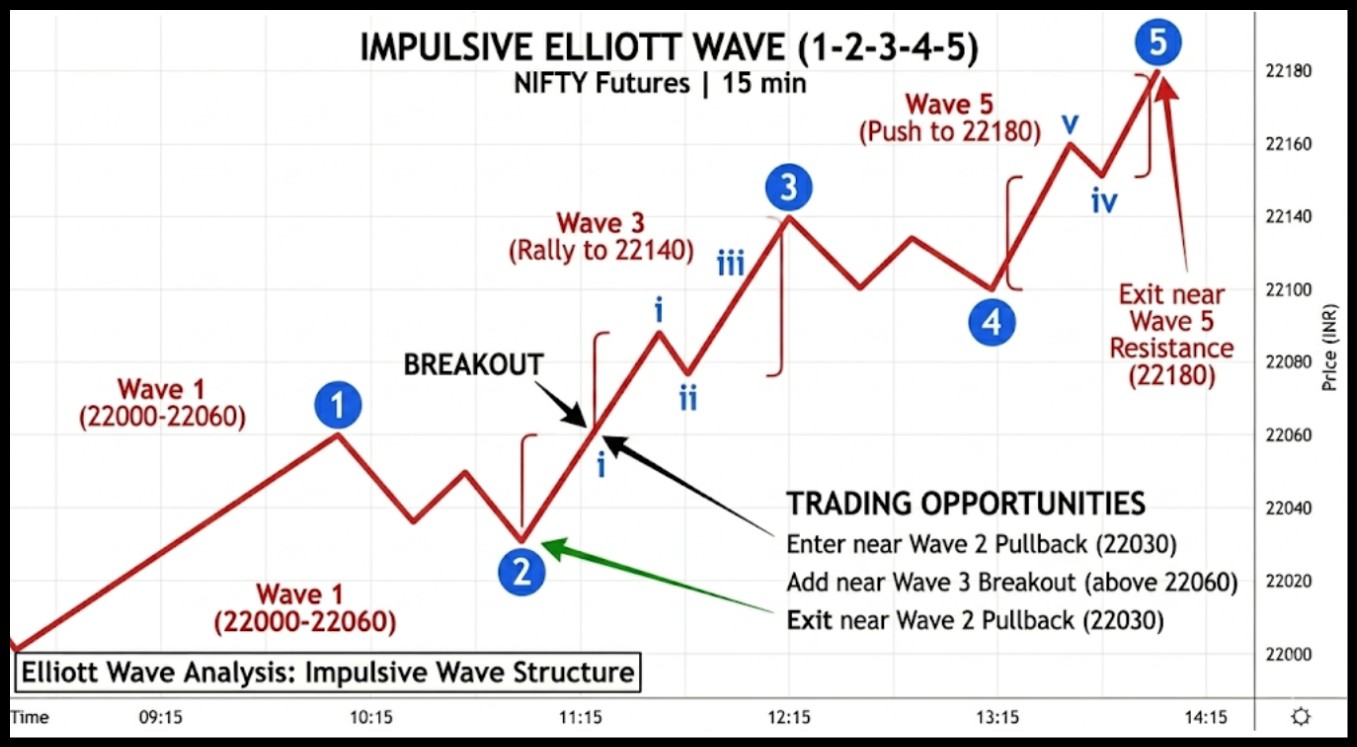
Suppose a trader analyzes a 15-minute chart of Nifty futures. Here’s what he notices:
| Wave | Price Movement | Trader Action |
| Wave 1 | 22000 to 22060 | Observe, do not enter yet |
| Wave 2 | Pullback to 22025 | Watch for reversal signals near 61% retracement |
| Wave 3 | Rally to 22140 | Enter on breakout confirmation, ride the move |
| Wave 4 | Sideways near 22110 | Wait for consolidation to complete |
| Wave 5 | Final push to 22180 | Take partial profits, tighten stop loss |
An intraday trader following this structure would:
- Enter near the end of Wave 2 after a reversal candle appears at the Fibonacci zone
- Add to the position during the Wave 3 breakout, confirmed by a volume spike
- Take partial profits as Wave 3 approaches the 1.618 Fibonacci extension
- Re-enter or hold the remaining position after Wave 4 consolidation ends
- Exit fully near Wave 5 resistance or when RSI divergence appears
This is a practical approach for how to use Elliott Wave Theory for intraday trading.
However, shorter timeframes create more noise. Traders often confirm signals using volume spikes or VWAP.
Common Mistakes Traders Make With Elliott Waves
Wave analysis looks simple on paper, but becomes tricky on live charts.
Here are mistakes traders often make:
- Forcing wave counts when the structure is unclear
- Ignoring higher timeframe trends
- Trading Wave 5 aggressively instead of safer Wave 3 setups
- Skipping risk management
A common rule among experienced traders is this: If the wave count looks confusing, step back to a higher timeframe.
Clarity improves dramatically.
Risk Management in Trading Elliott Waves
Wave analysis finds the opportunity, but risk management is what keeps traders in the game long enough to benefit from it.
A few practical guidelines to follow:
- Place a stop loss below Wave 2 when trading Wave 3
- Place a stop loss below Wave 3 low when trading Wave 4
- Never risk more than 1 to 2 percent of capital per trade
- Always combine support and resistance levels with wave counts for stronger confirmation
Example risk setup:
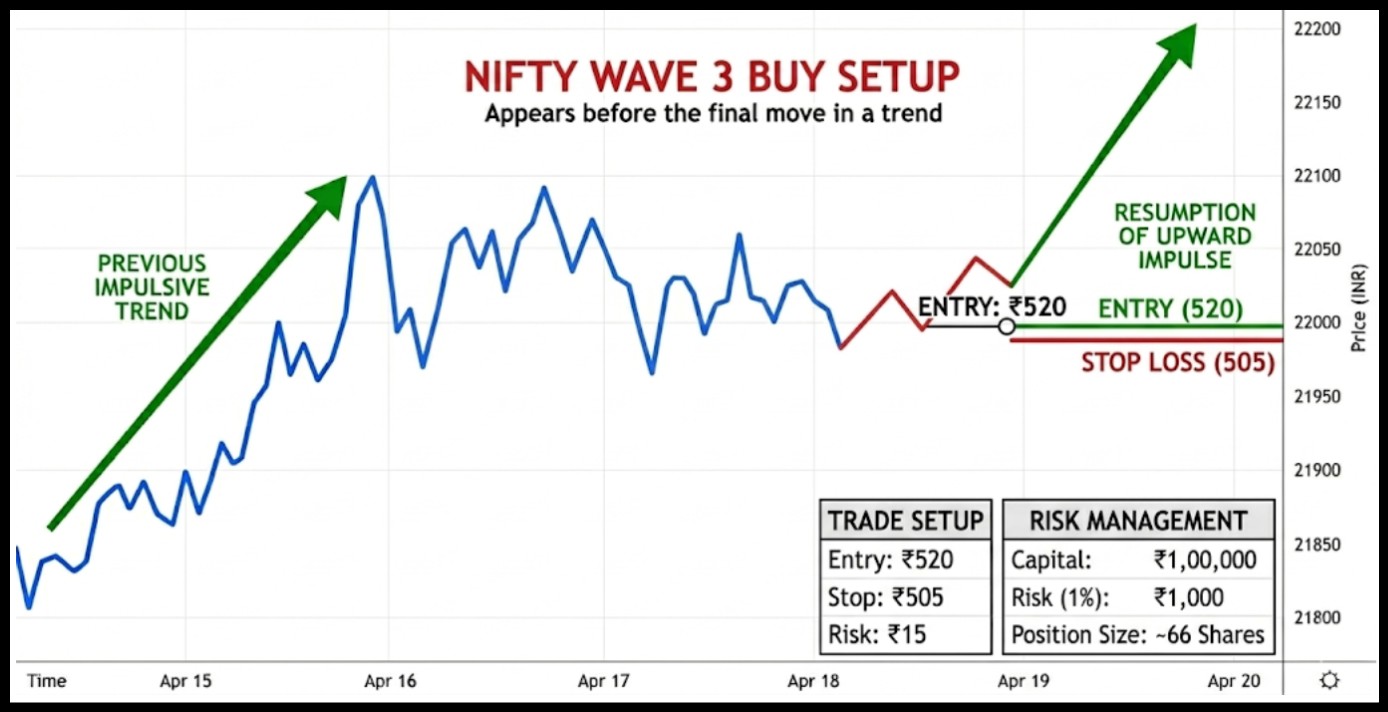
| Trade Type | Entry | Stop | Risk |
| Wave 3 Buy | ₹520 | ₹505 | ₹15 |
| Capital | ₹1,00,000 | Risk 1 percent | ₹1,000 max |
If the price falls below the Wave 2 origin, the wave count is invalidated. Exit immediately rather than hoping for recovery. That discipline is what keeps losses small and capital intact for the next setup.
Final Thoughts
Markets will always move in cycles. The tools change, algorithms get faster, and data flows more freely than ever, but the one thing that has never changed is human psychology.
Fear still causes panic selling. Greed still drives prices beyond reason. Hesitation still creates the pullbacks that traders wait for.
Elliott Wave Theory does not promise perfect predictions, but what it does offer is a structured way to read the market.
It helps to understand where price might be coming from, where it could be heading, and where the risk simply is not worth taking.
For traders who take the time to learn it properly and combine it with sound risk management, it becomes less of a rigid rulebook and more of a reliable lens through which the market starts to make sense.
That clarity, over time, is what separates consistent traders from the rest.
If you’re ready to move beyond just understanding and start applying these concepts with confidence, explore our stock market classes, where strategies are taught step by step through real trading sessions and practical market examples.
FAQs
Q1: What do Traders do to verify an Elliott Wave Count before getting into a Trade?
Ans: Numerous traders analyze counts of waves based on such tools as Fibonacci retracement levels, RSI divergence, and volume spikes.
When these indications are friendly to the anticipated wave formation, there is a high chance of the trade.
Q2: Why Wave 3 Theoretically Is The Most Profitable Trade In Elliott Theory?
Ans: Wave 3 tends to record the highest momentum as the general market starts noticing the trend.
Large volumes and institutional traders frequently find their way into this, which forces the prices away.
Q3: What happens when the Wave Structure Breaks or is invalid?
Ans: When the price exceeds the anticipated wave rule, then the count of the waves is said to be invalid. The traders normally leave the trade as soon as possible and review the chart on a bigger time scale.
Before investing capital, invest your time in learning Stock Market.
Fill in the basic details below and a callback will be arranged for more information:


