

Price doesn’t always move in a straight line; it surges, stalls, breathes, and then moves again. That pause, that sideways grind after a strong rally or selloff, often forms a flat corrective pattern.
And if you trade actively, you’ve probably seen it more times than you realize.
A flat corrective pattern is part of the flat corrective Elliott wave structure. It usually appears as a three-wave correction labeled A, B, C.
Unlike sharp zigzags, flats move sideways.
They test your patience, shake out weak hands, and then they set up the next impulsive move.
After a strong impulse move, the market cools off. Instead of reversing deeply, it drifts sideways in a controlled structure. That structure is the flat.
Let us explain it in detail now.
What is the Flat Corrective Elliot Wave Structure?
A flat corrective Elliott wave is essentially the market’s way of resetting momentum without reversing the bigger trend. It acts as a pause in the market rather than a full reversal.
In professional trading circles, this structure is commonly referred to as a flat correction in Elliott wave.
According to Elliott Wave theory, this pattern follows the ABC Correction Rules of Elliott wave, where the market completes a three-wave corrective sequence before the next impulsive move begins.
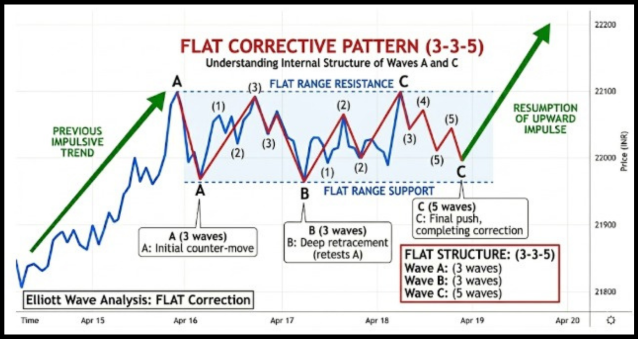
The flat corrective pattern in Elliott wave typically follows a 3-3-5 structure:
- Wave A moves in three waves.
- Wave B retraces Wave A in three waves.
- Wave C unfolds in five waves.
Wave B usually retraces close to the start of Wave A. That’s the key difference from a zigzag, where Wave B is shallow.
Here’s a simple table to keep it clear:
| Wave | Structure | Behavior |
| A | 3 waves | Initial counter move |
| B | 3 waves | Deep retracement |
| C | 5 waves | Final push, completing correction |
Wave A: The First Corrective Move
Wave A in a flat correction creates three waves, which is a prominent difference from zigzag corrections. Wave A is a powerful five-wave motion in a zigzag and is corrective and slower in a flat.
Wave A may be of various corrective types, such as a zigzag, a flat, or a combination, but not a triangle.
Triangles are only permitted in Wave B positions or as Wave 4 within an impulsive sequence, which is why Wave A structurally cannot take that form.
As a trading point, this informs us about something significant.
When you read Elliott wave charts, you see the market has begun to rectify, yet the trend remains strong.
Both buyers and sellers will remain active to avoid a sharp turnaround.
Wave B: The Most Deceptive Wave
Wave B is often the trickiest part of a flat correction. It is a three-wave wave that reverses Wave A and may go deeper into the past trend.
On most occasions, Wave B touches or slightly goes beyond the beginning of Wave A. When this occurs, the traders tend to think that the initial trend has reverted.
That is where the trap lies.
Market participants see prices returning to previous highs and jump back into the trend. Yet the correction is not finished. Wave B is simply creating the illusion that the market has already recovered.
Understanding this wave helps traders avoid entering too early.
Wave C: The Final Five-Wave Move
Wave C finishes the flat correction with a distinct five-wave impulsive structure. Wave C acts like a strong directional move, unlike Waves A and B, which are corrective.
This wave often travels with more momentum and volume as the market finishes its corrective phase.
Once Wave C completes its five-wave structure, the larger trend often resumes, frequently leading into a powerful wave 3 of Elliott wave cycle in the next degree.
Common targets for Wave C include:
- 100 percent of Wave A’s length.
- The end of Wave A.
- Occasionally, a slightly extended move beyond Wave A.
How It Appears In Real Trading?
Flat corrections appear frequently in index markets such as Nifty or Bank Nifty after a strong rally.
A typical sequence might look like this:
- The index rallies strongly for several sessions.
- Price then enters a sideways phase where Wave A and Wave B form.
- Volume drops and traders lose interest because the market feels slow and directionless.
Then Wave C unfolds with a quick five-wave move, completing the correction. Once that happens, the main trend often continues.
Types Of Flat Corrective Pattern
Not all flats behave the same.
There are four common variations traders watch closely.
1. Regular Flat Corrective Pattern
A regular flat corrective pattern forms when the market pauses after a strong move but does not change the overall trend.
Buyers and sellers start pushing the price back and forth for a while. Instead of a sharp drop or rally, the market moves in a controlled three-wave correction.
Here is how the waves typically behave:
- Wave B retraces almost the entire move of Wave A: After the first drop or pullback in Wave A, the price climbs back up and nearly reaches the starting point again. This shows that buyers are still active and trying to regain control.
- Wave C then moves slightly beyond the end of Wave A: The market makes one more move in the correction direction, going a bit lower or higher than Wave A before the correction finishes.
Because of this structure, the regular flat often looks balanced on the chart. Neither side dominates for long.
Bulls push the price up, bears push it down, and the market spends some time moving sideways before the main trend continues.
Example:
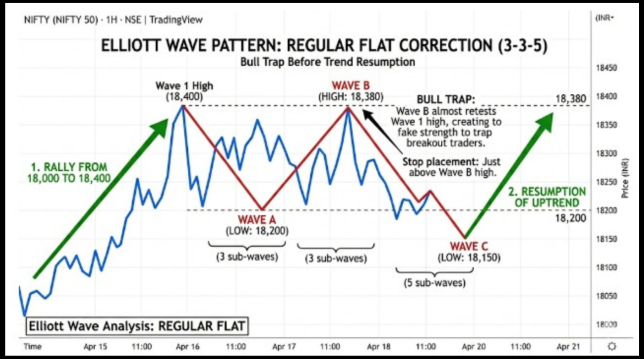
Nifty rallies from 18,000 to 18,400. Then Wave A drops to 18,200. Wave B climbs back to 18,380. Finally, Wave C falls to 18,150 before the uptrend resumes.
Notice how Wave B almost retested the high. That fake strength traps breakout traders. It happens all the time.
From a risk perspective, many traders place stops just above the Wave B high. If price breaks it convincingly, the flat idea is invalid.
2. Expanding Flat Corrective Pattern
An expanding flat corrective pattern is a more aggressive version of the flat correction. This pattern usually appears when the market is highly emotional.
Buyers and sellers are both trying to take control, so the price begins to stretch further on each move.
On the chart, it can look confusing because the market briefly breaks important levels before reversing again.
Here is how the waves typically behave:
- Wave B moves beyond the start of Wave A: After Wave A forms the first correction move, Wave B pushes the price past the point where Wave A began. This breakout often makes traders believe the original trend is continuing.
- Wave C then moves well beyond the end of Wave A: After the breakout in Wave B, the market reverses strongly. Wave C travels further than Wave A and completes the correction with a deeper move.
Because of these larger swings, this pattern often creates confusion in the market. Traders see a price break the previous high or low and assume a new trend has started.
Many enter trades at that moment.
The market, however, reverses soon in Wave C. What appeared to be a powerful breakout was in reality a portion of the correction.
This kind of pattern is commonly formed around market tops or bottoms, where emotions and uncertainty are very high.
Real scenario:
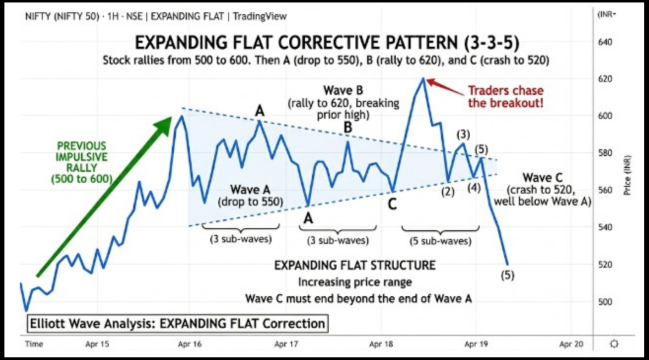
NIFTY rallies from 500 to 600. Wave A drops to 550. Wave B shoots up to 620, breaking the prior high. Traders chase the breakout. Then Wave C crashes to 520.
That sharp move wipes out late buyers. Expanding flats are brutal if you misread them.
3. Running Flat Corrective Pattern
A running flat corrective pattern is another type of correction in Elliott Wave theory, but it appears far less often than the regular flat.
Traders usually notice it during very strong market trends. The market pauses for a short time, yet the main trend is so powerful that the correction never fully develops.
In most corrections, price pulls back in a clear three-wave structure. However, in a running flat, the market behaves a little differently because the dominant trend remains strong throughout the correction.
Here is how the waves usually form:
- Wave B crosses the initial point of Wave A: Once the initial pullback of Wave A occurs, the price swiftly recovers and rises ever higher than the point of the correction. This informs traders that buyers remain aggressive and the trend is turning out to be strong.
- Wave C fails to move past the end of Wave A: The market then drops again, forming Wave C, but the decline is weak. Instead of making a deeper low, the price turns upward before it can break the previous low.
This structure often signals strong momentum in the main trend. The correction becomes shallow because traders keep buying the dips.
4. Irregular Flat Corrective Pattern
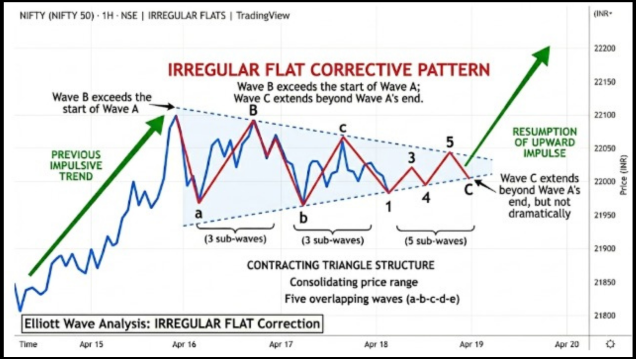
The irregular flat corrective pattern is often confused with the expanding flat.
In this case:
- Wave B exceeds the start of Wave A.
- Wave C extends beyond the end of Wave A, but not dramatically.
It looks messy. It feels unpredictable. Many traders miscount the waves.
If you rely on tools like TradingView for wave counting, you’ll notice how subjective labeling can get. Two traders may mark different counts on the same chart.
That’s normal. Elliott Wave is part structure, part judgment.
Fibonacci Measurements In The Flat Corrective Pattern
Fibonacci measurements help traders validate a flat correction on real charts.
These levels define whether the structure truly qualifies as a flat and also help estimate where Wave C might end.
Wave B Fibonacci Rules By Flat Type:
- Regular Flat: Wave B retraces 78% to 100% of Wave A. This deep retracement is the minimum requirement that separates a flat from a zigzag.
- Expanding Flat: Wave B usually retraces 105% to 138% of Wave A, meaning it exceeds the start of Wave A.
- Running Flat: Wave B moves beyond 100% of Wave A, but Wave C fails to break the end of Wave A.
Wave C Fibonacci Targets:
- Regular Flat: Wave C often reaches 100% to 105% of Wave A.
- Expanding Flat: Wave C typically extends 100% to 138% of Wave A.
- General Range: Wave C may stretch toward the 100% to 165% Fibonacci extension of Wave A.
When Is A Flat Corrective Pattern Invalid?
Spotting a flat correction is useful, but knowing when the pattern fails is even more important for traders.
If certain structural rules are broken, the wave count must be abandoned, and the market re-evaluated.
You can keep an Elliott wave cheat sheet nearby to quickly verify the key invalidation signals.
Key invalidation signals include:
- Wave A forms 5 sub-waves instead of 3. This means the pattern is likely a zigzag, not a flat.
- Wave B develops 5 waves. This may signal the start of a new impulse in a higher-degree trend.
- The correction retraces more than 100 percent of the prior impulse, suggesting a possible trend reversal.
- In expanding flats, if Wave C exceeds 161.8 percent of Wave A, the structure may shift into a complex correction such as WXY.
Always confirm your wave count before entering a trade. Even a single structural mismatch can shift the entire pattern interpretation and lead to costly mistakes.
How Traders Actually Use The Flat Corrective Pattern?
Here’s the practical part.
Most experienced traders use the flat corrective pattern for:
- Identifying trend continuation zones.
- Setting entry points after correction.
- Managing risk during consolidation.
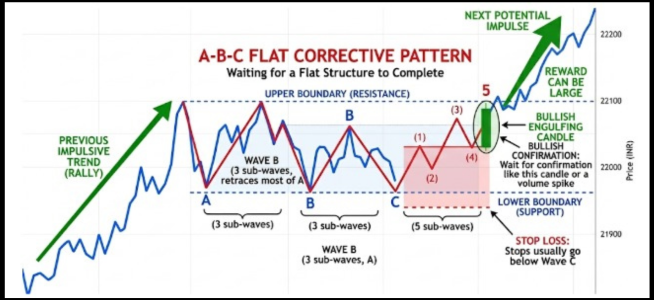
Look at the chart above, Bank Nifty rallies strongly. Instead of chasing, you wait for a flat structure to complete.
Once Wave C finishes near support, you look for bullish confirmation like a strong engulfing candle or volume spike.
Stops usually go below Wave C in bullish setups. Risk stays tight. The reward can be large if the next impulse unfolds.
Flat patterns are not magic. They fail. News events, global cues, and sudden volatility can invalidate the count. That’s why risk control matters more than perfect labeling.
Honestly, the pattern works best when combined with support and resistance, Fibonacci retracements, and volume behavior. Alone, it’s a theory. With confluence, it becomes practical.
Common Mistakes With Flat Patterns
Flat corrections often look simple on the surface, which is why many traders misread them.
The sideways movement can easily create false signals, especially for traders expecting a quick trend continuation.
Traders often:
- Confuse flats with simple ranges.
- Enter before Wave C completes.
- Ignore overall trend direction.
A flat in a strong uptrend is usually bullish. A flat in a downtrend often leads lower. Context changes everything.
If you treat every sideways market as a flat corrective Elliott wave, you’ll overtrade. Discipline beats excitement.
Conclusion
The flat corrective pattern is one of those things that looks simple on the surface but takes real screen time to truly understand.
Most traders walk right past it because the market feels slow and directionless during a flat correction.
But when you learn to recognize this structure, you stop fighting the sideways grind and start using it to your advantage.
You enter with clarity, manage your risk with confidence, and position yourself right before the next big move unfolds.
That is not luck; that is what happens when structure meets discipline.
Master the flat corrective pattern like a pro and turn sideways markets into winning opportunities. Join our stock market classes today and trade with confidence.
FAQs
Q1: Why Does Wave B Retrace So Much In A FlatCorrective Pattern?
Ans: Wave B retraces deeply because the market still has strong participation from the previous trend.
Buyers or sellers temporarily regain control, pushing the price close to the starting point before the final corrective wave forms.
Q2: Can A Flat Corrective Pattern Form In Sideways Markets?
Ans: Yes, flats often appear when the market is moving sideways with no clear dominance from buyers or sellers.
This balanced pressure creates the typical back-and-forth movement seen in flat corrections.
Q3: Why Do Traders Watch Wave C Closely In A Flat Pattern?
Ans: Wave C often provides clues about the strength of the next move.
If it finishes near key support or resistance levels, traders expect the main trend to resume soon after the correction ends.
Before investing capital, invest your time in learning Stock Market.
Fill in the basic details below and a callback will be arranged for more information:


