

You open a chart, the setup looks perfect, and you enter the trade. Two minutes later, it reverses. Sound familiar?
Most intraday traders don’t lose because they lack knowledge. They lose because they act on one signal without checking whether the bigger picture agrees.
One indicator alone is rarely enough.
That’s exactly where the MACD EMA Strategy changes the game. It combines two of the most trusted tools in technical analysis: MACD for momentum and EMA for trend direction.
It ensures that you are never trading blindly in one direction while the market is quietly heading the other way.
In this blog, we break down everything you need to know about the MACD EMA Strategy in a clear and simple way.
What Is The MACD EMA Strategy?
Markets don’t move randomly all the time. They trend, pause, and then move again.
The MACD EMA Strategy helps you catch those moves with better timing.
It combines two tools:
- MACD for momentum
- EMA for trend direction
Used together, they filter weak signals and highlight stronger trades. Traders rely on it because the confirmation comes quickly and the logic is hard to argue with.
Generally speaking, EMA tells us what the trend is. MACD informs you of the moment when the momentum is changing.
Core Components Of MACD:
- MACD Line: Difference between 12 EMA and 26 EMA
- Signal Line: 9 EMA of the MACD line
- Histogram: Difference between MACD line and signal line
When the fast EMA (12) moves above the slow EMA (26), momentum turns bullish. When it drops below, momentum weakens.
Standard MACD Settings:
|
Component |
Value | Meaning |
| Fast EMA | 12 |
Reacts quickly to price |
|
Slow EMA |
26 | Tracks broader movement |
| Signal Line | 9 |
Smooths MACD for signals |
This means when you use a MACD EMA strategy, you’re actually working with multiple EMAs at once.
The internal 12 and 26 EMAs drive momentum, while external EMAs like 20 or 200 define the trend, making the setup more structured and reliable.
How MACD And EMA Work Together?
Understanding this combination is key before placing trades. The MACD moving average strategy works because both indicators are based on moving averages.
In fact, a MACD signal is essentially a sophisticated EMA crossover smoothed by a signal line to reduce noise.
Role Of EMA In The Strategy:
EMA acts as a trend filter. It helps traders stay on the right side of the market by clearly defining the overall direction before taking entries.
Many traders wait for a 20 and 50 EMA crossover to establish a high-probability trend bias, ensuring the medium-term momentum is aligned before seeking a MACD trigger.
- Price above EMA → bullish bias
- Price below EMA → bearish bias
Most traders employ a 20 EMA or a 200 EMA based on the period of time.
The 20 EMA is favored by short-run traders who need the 20 EMA to give a fast signal, whereas swing traders move according to the long-term trend and, therefore, use the 200 EMA.
Some traders also use the 50 EMA trading strategy as a balanced approach to capture medium-term trends without excessive noise.
Role Of MACD In The Strategy:
MACD shows momentum through shifts in trend strength and direction:
- MACD line and signal line crossover
- Histogram expansion or contraction
How To Use MACD With EMA?
MACD EMA assists you in integrating the direction of the trend and the momentum to provide clear and more reliable trade signals.
- First, identify the trend using EMA
- Then wait for the MACD crossover in the same direction
- Enter only when both agree
This reduces random trades. It may sound simple, and it is that simplicity that makes it effective.
Over time, having a clear process stops you from making impulsive decisions when markets get unpredictable.
MACD Settings For Different Trading Styles
MACD isn’t a one-size-fits-all indicator. The settings you use should match your trading style and timeframe. Faster markets need faster settings, while slower trends need smoother signals.
Many traders overlook this, and that’s where performance drops.
For example, intraday traders in Nifty or Bank Nifty often avoid the default 12,26,9 on lower timeframes because it reacts too slowly.
Recommended MACD Settings:
|
Trading Style |
MACD Settings | Use Case |
| Scalping | 5,13,4 |
Quick entries on 1-minute charts |
|
Day Trading |
8,17,6 or 8,17,9 | Intraday momentum trades |
| Swing Trading | 12,26,9 |
Clean multi-day trends |
|
Positional Trading |
19,39,14 |
Long-term trend following |
The correct settings of the MACD can help you greatly to enter at the right time and minimize the appearance of false signals.
Your settings should serve your style, not force you to trade in a way that does not suit you.
Key Takeaways:
- Lower timeframe needs faster MACD settings
- A higher timeframe works well with default settings
- Adjust settings based on volatility and asset
Better settings mean fewer late entries and fewer premature exits, both of which quietly eat into your returns over time.
MACD EMA Crossover Strategy Basics
The basis of this approach is the MACD EMA crossover strategy. It emphasizes the timing of entries on the MACD and follows the direction of the EMA.
Basic Rules:
- Buy where MACD crosses upwards, and the price exceeds EMA.
- Sell at the point when MACD crosses down, and the price is less than the EMA.
Note: Buy signals must be followed when MACD is above zero (macro momentum is bullish) and sell signals when MACD is below zero (macro momentum is bearish).
Why This Works:
EMA avoids counter-trend trades. MACD gives entry timing. Together, they create a structured system.
Not every crossover deserves a trade. In flat, sideways conditions, they fail more often than not, and knowing when to sit out is just as valuable as knowing when to enter.
1. MACD 20 EMA Strategy: Short-Term Precision
For intraday traders, the MACD 20 EMA strategy is a popular choice. It reacts quickly and fits fast-moving markets.
Setup:
- Timeframe: 5-minute or 15-minute
- Indicator: 20 EMA + MACD
Entry Rules:
- Price above 20 EMA
- MACD bullish crossover
- Strong candle close
Example:
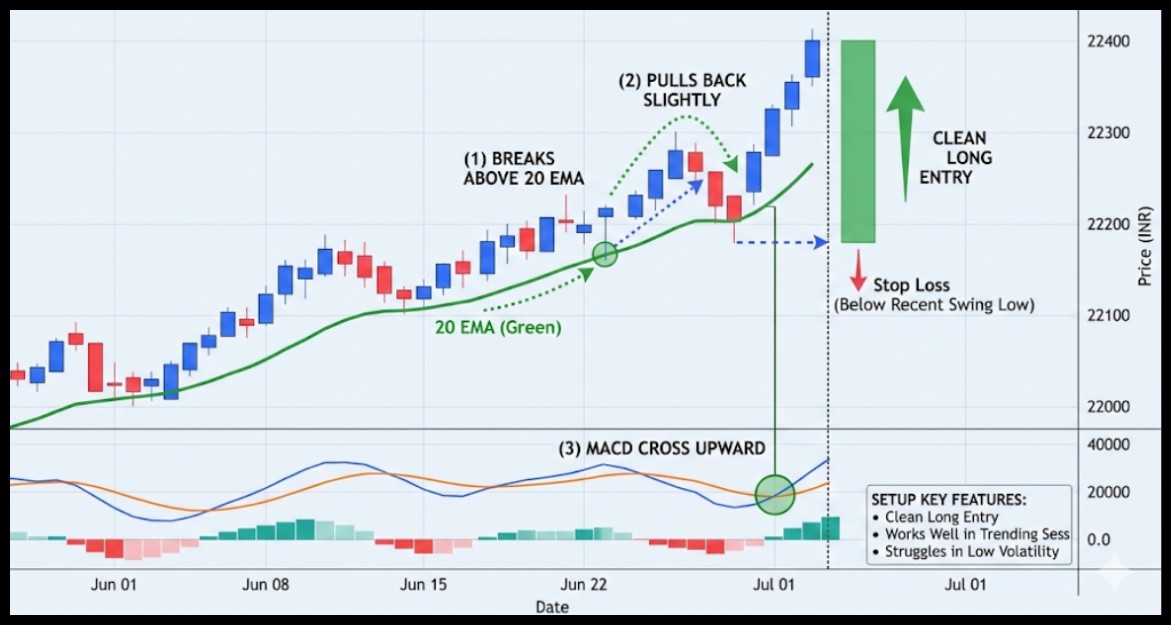
- Stock breaks above 20 EMA
- Pulls back slightly
- MACD crosses upward
That’s a clean and long entry. Stop goes below the recent swing low. This setup works well in trending sessions but struggles during low volatility periods.
2. MACD 200 EMA Strategy: Trading With The Big Trend
Now let’s slow things down. The MACD 200 EMA strategy focuses on the bigger picture. It helps traders avoid noise and stay aligned with the dominant market direction for more stable setups.
Why Use 200 EMA:
It acts as a long-term trend filter. It helps you stay aligned with the broader market direction and avoid low-quality counter-trend trades.
- Above 200 EMA → only buy
- Below 200 EMA → only sell
Entry Approach:
- Wait for the MACD crossover in the trend direction
- Enter on pullbacks or breakouts
Example:

- Index trading above 200 EMA
- MACD turns bullish after a pullback
- Entry taken near the support
With fewer but higher-quality setups, you naturally trade less. And trading less, when done intentionally, is one of the most underrated edges in intraday markets.
3. MACD Divergence With EMA: A High-Probability Signal
MACD crossovers are useful, but divergence often gives an earlier and sharper signal. When combined with EMA levels, it becomes a powerful reversal setup.
The idea is simple: price shows weakness, but MACD shows hidden strength. That mismatch is where opportunity builds.
How It Works:
- Bullish divergence: price makes a lower low, MACD makes a higher low
- Bearish divergence: price makes a higher high, MACD makes a lower high
- Histogram shrinking signals weakening momentum
- Combine divergence near key EMA levels for stronger setups
This combination helps you spot reversals before they become obvious on price charts. When used with EMA levels, divergence setups often lead to high-probability trades with clear risk control.
Practical Example:
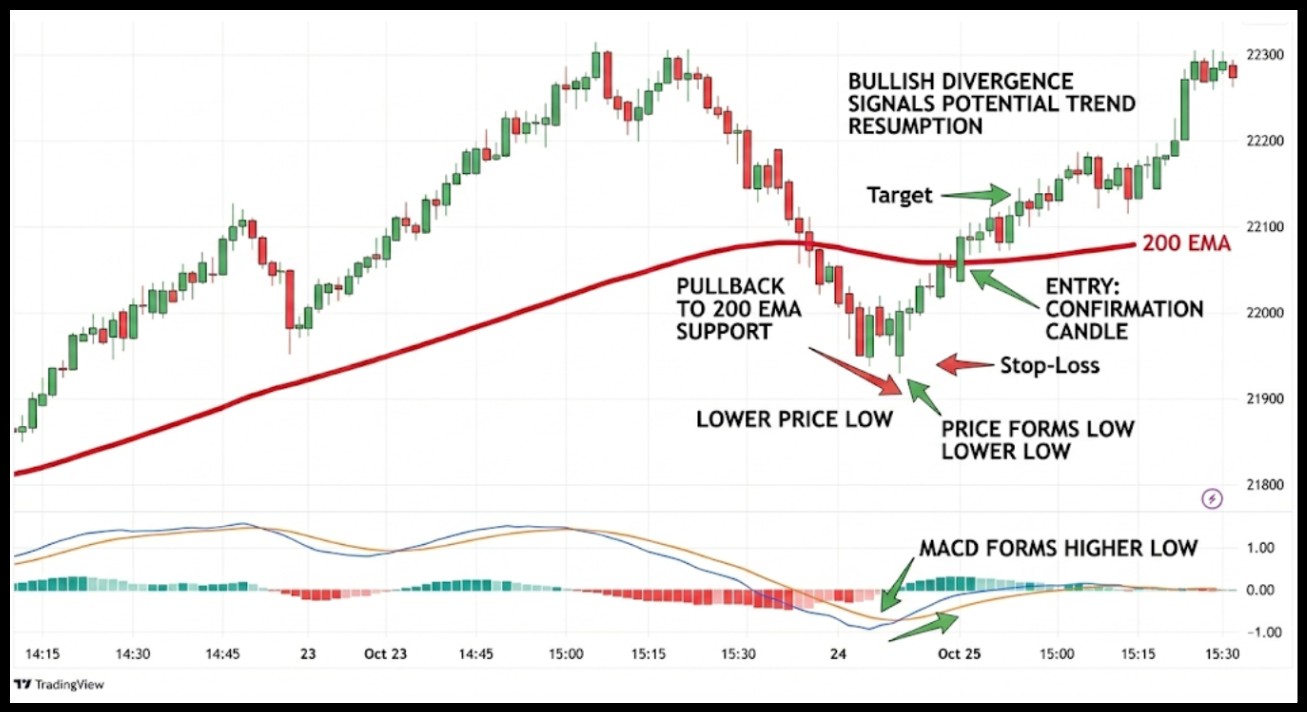
- Price pulls back to the 200 EMA in an uptrend
- Forms a lower low on the chart
- MACD forms a higher low
This signals bullish divergence. Entry is taken on confirmation candle, with stop below recent low and target at least 2 times the risk.
MACD EMA Strategy Rules: Entry, Exit, Risk
A strategy without rules leads to confusion. Clear macd ema strategy rules keep decisions consistent.
They also remove emotional decisions, which is where most trading mistakes begin.
Entry Checklist:
- Is the price respecting the EMA?
- Is MACD confirming momentum?
- Is volume supporting the move?
Exit Rules:
- Exit at the next resistance or support
- Use a trailing stop based on EMA
- Close if MACD reverses
A disciplined exit protects profits and prevents a winning trade from turning into a loss.
It also keeps emotions in check, helping you stick to your plan even when the market gets unpredictable.
Risk Management Table:
|
Rule |
Explanation |
| Risk per trade |
1 to 2 percent of total capital |
|
Stop loss |
Below the swing low or EMA level |
| Reward target |
Minimum 1:2, ideally 1:3 risk-reward ratio |
Risk control often feels boring. Yet it’s the difference between survival and burnout. Accounts don’t blow up from bad strategies.
They blow up from ignoring risk rules on the days that feel the most certain.
1. MACD EMA Strategy Chart: Reading It Right
A MACD EMA strategy chart may look busy at first. But once you break it down, patterns become clear. With a bit of screen time, you start spotting trend direction and momentum shifts almost instinctively.
What To Watch:
- Price position relative to EMA
- MACD crossover direction
- Histogram strength
Chart Example:
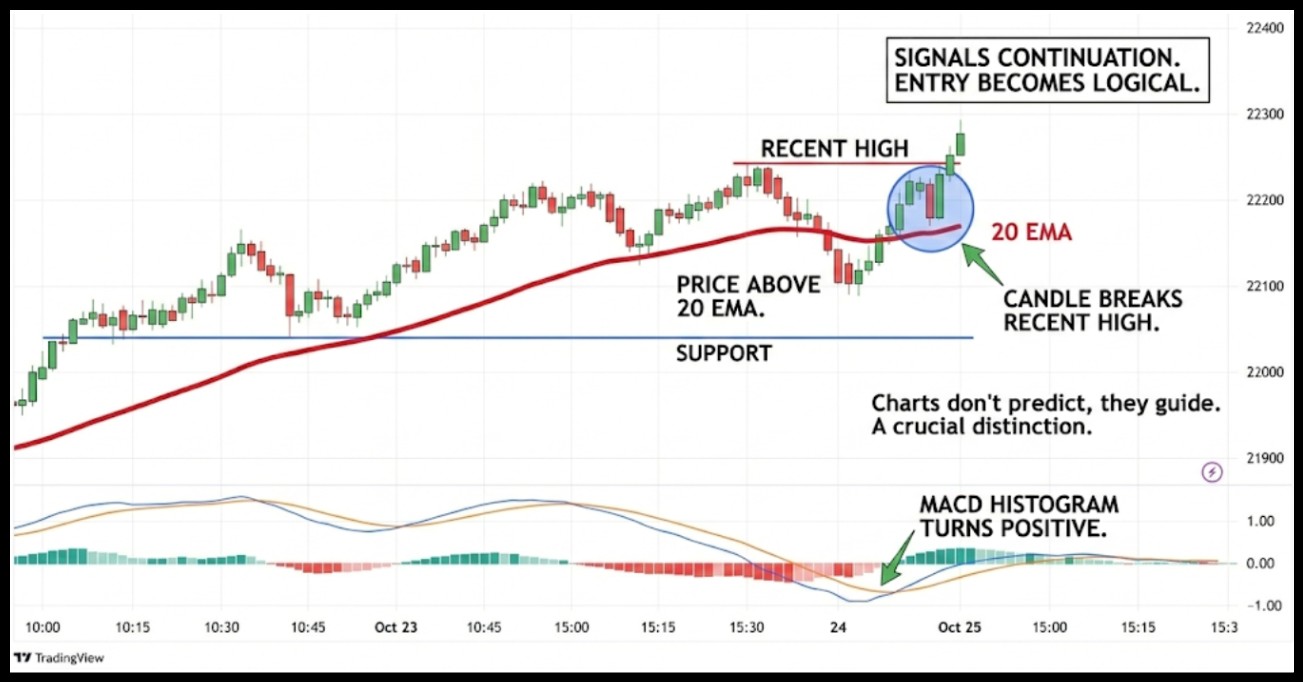
- Price above 20 EMA
- MACD histogram turns positive
- Candle breaks recent high
This signals continuation. Entry becomes logical, not emotional. A chart tells you what has happened and what might be forming. Acting on that with discipline is entirely up to you.
2. RSI MACD EMA Strategy: Adding Momentum Confirmation
Some traders combine RSI for extra validation. The RSI, MACD, and EMA strategy adds another layer of confirmation. It helps filter out weak signals and keeps you focused on trades where momentum and trend are both aligned.
How It Works:
- EMA defines a trend
- MACD gives an entry signal
- RSI confirms strength
Typical Rules:
- RSI above 50 for buy trades
- RSI below 50 for sell trades
Note: RSI also helps with exits. When RSI reaches 70 on a buy trade, consider taking partial profits; when RSI reaches 30 on a sell trade, consider covering the position.
RSI adds a useful layer, but if you stack too many filters, you will talk yourself out of every trade. Keep it lean.
3. ADX MACD EMA Strategy: Measuring Trend Strength
The ADX MACD EMA strategy focuses on trend strength, not just direction. It helps traders avoid weak or sideways markets where most false signals occur.
Why ADX Matters:
ADX shows whether a trend is strong or weak. It helps you avoid trading in sideways markets where most false signals occur.
- Above 25 → strong trend
- Below 20 → weak or sideways
Combined Setup:
- EMA shows direction
- MACD gives an entry
- ADX confirms strength
This combination helps avoid choppy markets, where most losses happen. Strong trends follow through. Weak ones stall and reverse. ADX helps you tell the difference before you commit capital.
Trade Example: MACD 20 EMA Strategy In Action
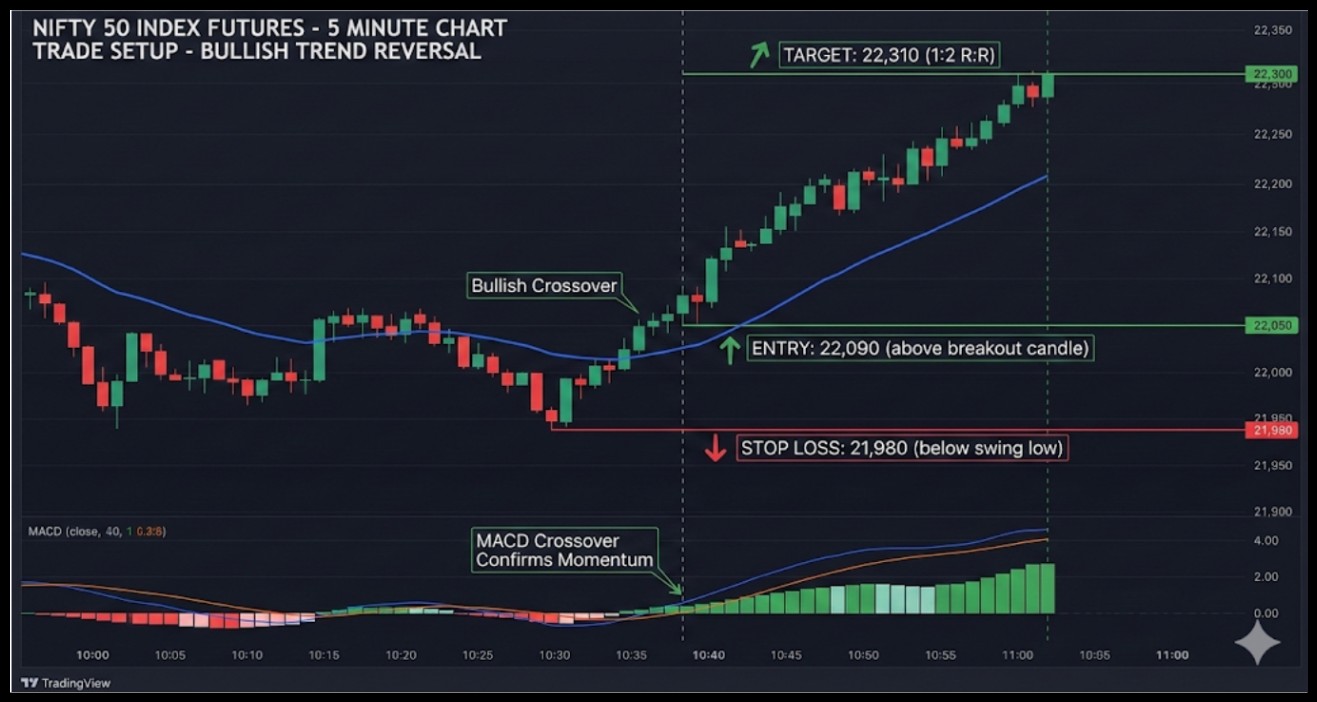
Theory helps, but clarity comes from numbers. Let’s walk through a real-style intraday setup using the MACD 20 EMA strategy on a 5-minute chart of Bank Nifty futures. This example shows exactly how traders plan entries, stops, and targets.
Trade Setup With Specific Levels
- Instrument: Bank Nifty Futures
- Timeframe: 5 minutes
- Price trading at: 48,200
- 20 EMA at: 48,150
Entry Conditions
- Price crosses above 20 EMA and holds
- MACD line crosses above the signal line (bullish crossover)
- Entry taken at: 48,230 (above breakout candle high)
Stop Loss And Target
- Stop loss: 48,120 (below previous swing low)
- Risk: 110 points
- Target: 48,450 (1:2 risk-reward)
Outcome And Insight
- Price moves steadily and hits the target within the next few candles
- MACD histogram expands, confirming momentum
This kind of structured trade removes guesswork. You know your risk, your reward, and your logic before entering the trade.
Common Mistakes Traders Make
Even a solid MACD EMA Strategy fails when misused. Small mistakes add up quickly. Most losses don’t come from the strategy itself, but from inconsistent execution and poor discipline.
Mistakes To Avoid:
- Taking trades in sideways markets
- Ignoring the higher timeframe trend
- Entering late after big moves
- Skipping stop loss
Here’s a subtle truth. The strategy is simple, but execution isn’t. Discipline often matters more than the setup itself.
Small mistakes in timing or risk can quietly turn a good setup into a losing trade.
Conclusion
The MACD EMA Strategy works because it does not ask you to predict the market. It simply asks you to follow it.
When EMA tells you the trend, and MACD confirms the momentum, you are not guessing anymore.
You have two independent tools agreeing on the same thing, and that agreement is where your edge lives.
But here is what most traders miss.
The strategy is only as good as the discipline behind it. Knowing the rules is one thing, but actually waiting for the right setup, respecting your stop loss, and not chasing late entries is what separates consistent traders from everyone else.
So start simple, pick one timeframe, set up your EMA and MACD, and spend a week just observing how they interact before placing a single trade.
That patience will do more for your results than any indicator ever could.
Want to go deeper into the MACD EMA Strategy with real chart examples and live market sessions? Join our stock market classes and learn how to apply it step by step in real-time conditions.
FAQs
Q1: How To Use MACD With EMA Effectively?
Ans: Use EMA to identify trend direction and MACD for entry timing. Take trades only when both indicators agree.
Q2: Which EMA is best for the MACD Strategy?
Ans: 20 EMA works well for short-term trades, while 200 EMA suits long-term trends. Choice depends on your timeframe.
Q3: Is the MACD EMA Strategy Good For Beginners?
Ans: Yes, it’s simple and rule-based. Beginners should focus on risk management and avoid trading in sideways markets.
Q4: Is MACD leading or lagging indicator?
Ans: It is a lagging indicator because it uses past price data. However, the histogram helps traders spot momentum shifts early, acting as a “leading” hint for trend changes.
Before investing capital, invest your time in learning Stock Market.
Fill in the basic details below and a callback will be arranged for more information:


