


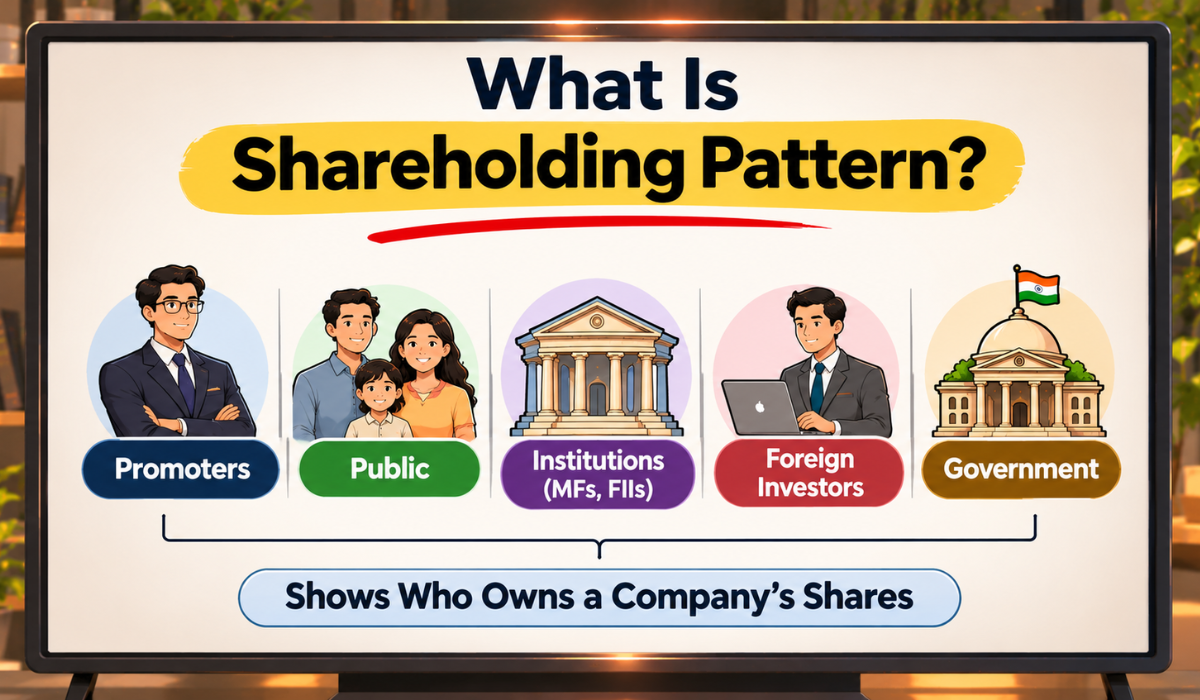
You open a company’s page and see a table of percentages. What is shareholding pattern, and why do experienced investors check it before anything else?
In fact, it shows who owns the company and how much each group holds.
Here, this page explains the meaning, the groups of owners and a simple example. By the end, you will be able to read the table without fear.
Shareholding Pattern Meaning in Simple Words
If the table of percentages looks confusing, start here. In fact, the idea behind it is very simple.
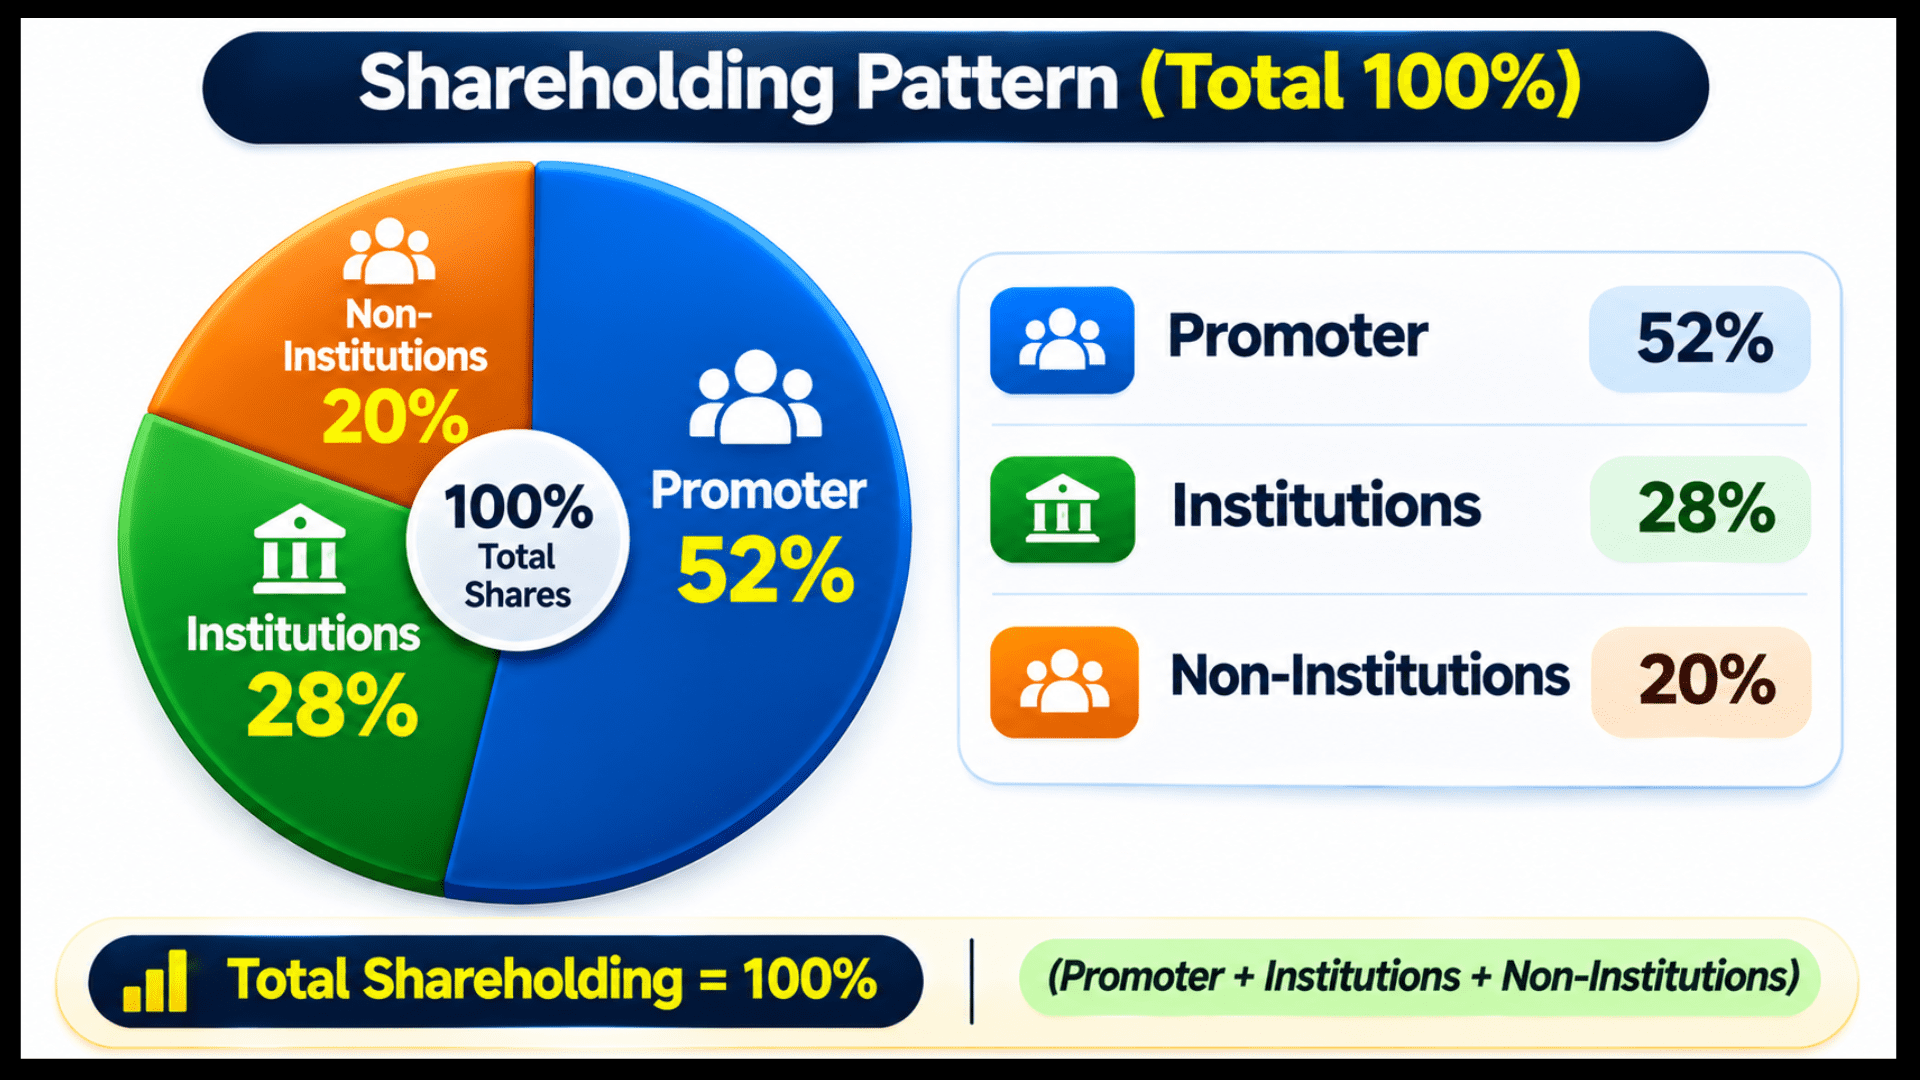
The shareholding pattern is a list that shows how a company’s shares are divided among its owners. Every share is held by someone, so the groups always add up to 100%.
For example, think of a family-run shop that took in outside partners. Here, the family keeps a large share, and the partners hold the rest. A shareholding pattern is that ownership chart for a listed company.
Companies share this information with the stock exchanges every quarter. However, the exact format and timelines can change, so verify them on the exchange website.
Shareholding Pattern Categories: Who Owns a Listed Company?
Opening a filing for the first time can feel heavy. In fact, each block below is explained in plain words, so you can read at your own pace.
Most patterns split owners into two big blocks: promoters and the public. The public block is then divided again.
The table below shows the standard structure. It is a general outline, and the labels can vary slightly in the official filing.
| Category | Who is included | Simple idea |
|---|---|---|
| Promoter and promoter group | Founders, their families and linked entities | Those who control the company |
| Public: institutions | Foreign portfolio investors, mutual funds, insurers, banks | Large professional investors |
| Public: non-institutions | Retail investors, HNIs, other bodies | Individuals and smaller entities |
These three rows are the whole map of ownership. Next, let us see what each block means.
Promoter Holding Meaning: Who Controls the Company?
Promoters sit at the top of every ownership table. So, this is the first row most investors read.
Promoter holding is the share of the company held by the founders and the group linked to them. In general, promoters decide the direction of the business.
Promoter stakes are usually judged over years, so it helps to know which time frame is best for long term trading.
A related term is the pledge. When promoters borrow money by keeping some of their shares as security, those shares are called pledged shares. We look at it again in the terms section.
FII, DII and Public Holding Explained
The phrase FII DII public holding covers everyone outside the promoter group. It is easier to understand once you split it into three parts.
First, foreign portfolio investors (FPI, earlier called FII) are overseas funds that buy Indian shares.
These funds track growth closely, so the impact of GDP on stock market helps explain their moves.
Similarly, domestic institutions (DII) include mutual funds, insurance companies and similar bodies in India.
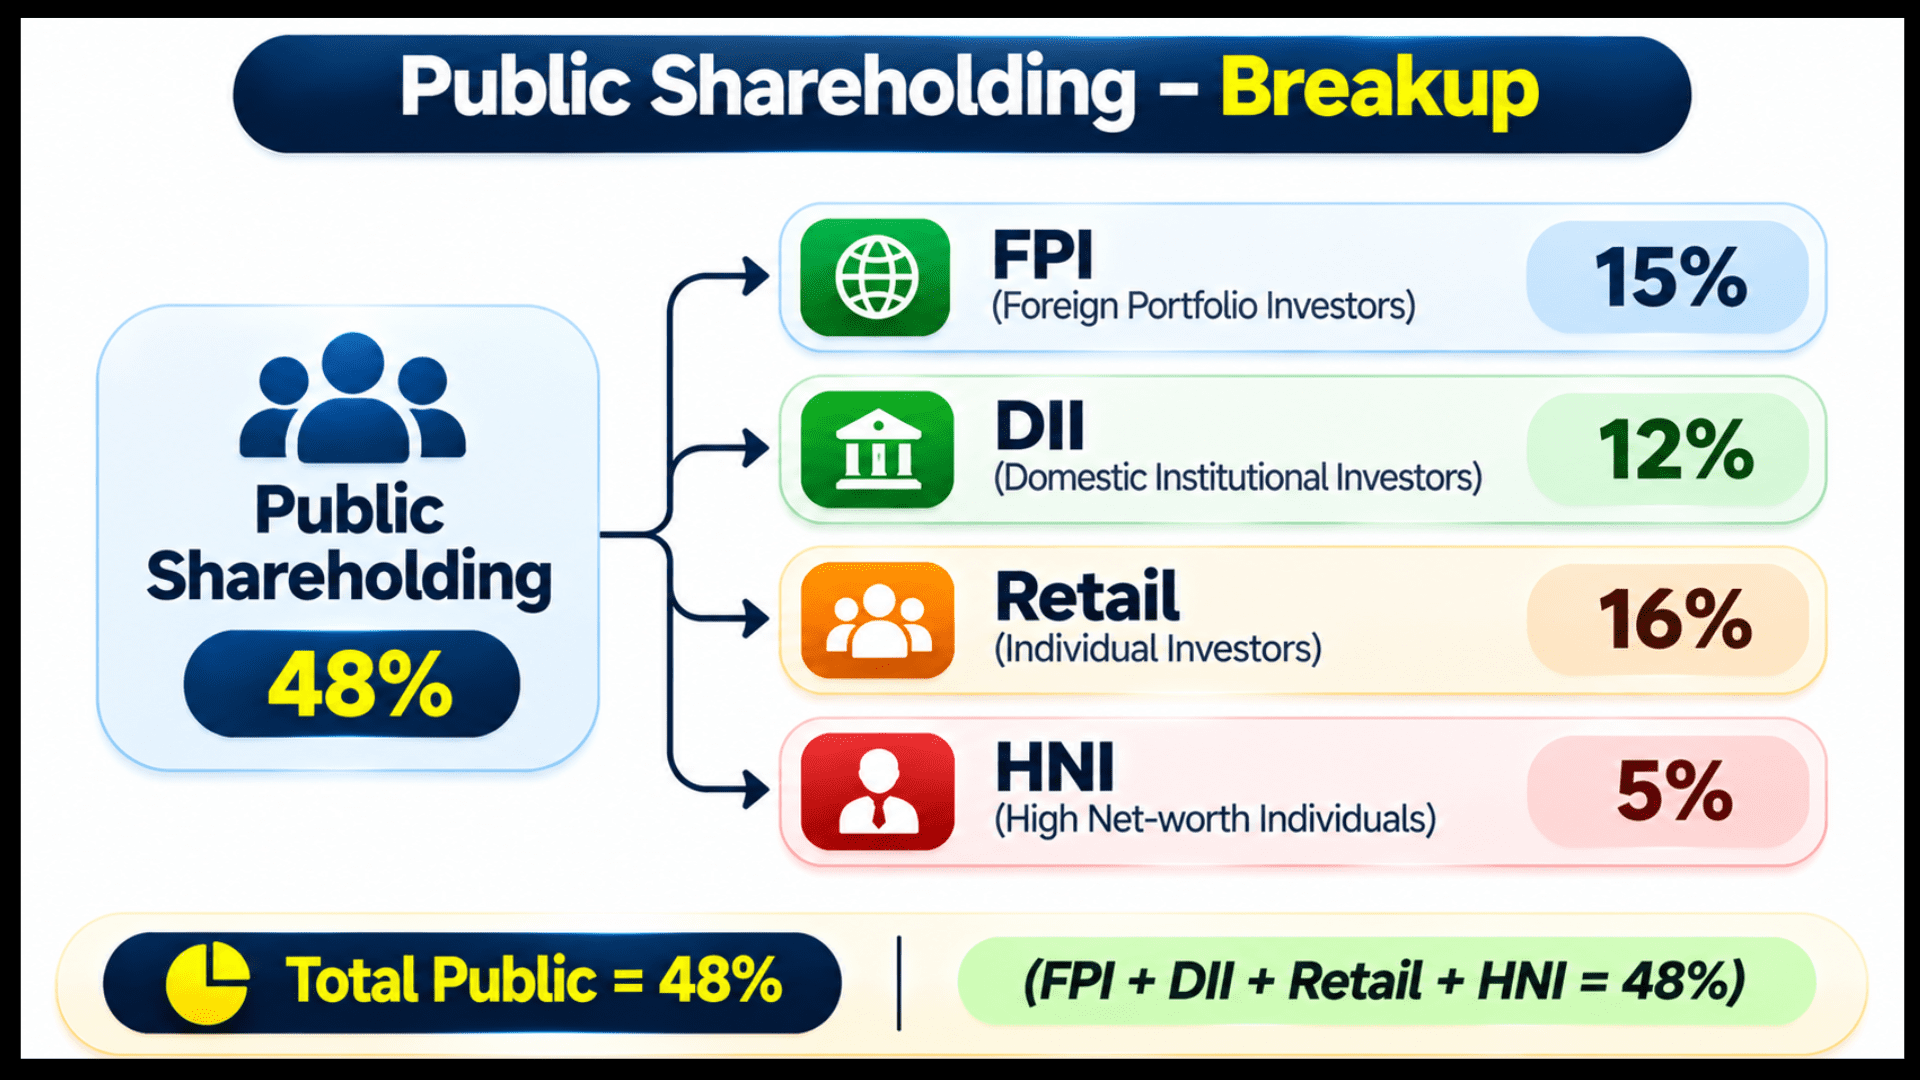
Finally, the third part is the non-institutional public. This includes retail investors like you, wealthy individuals (HNIs) and other bodies.
Also, institutions do deep research before they invest. That is why many people watch their holding as one clue among many. It is never a promise of how a share will move.
Shareholding Pattern Example With Numbers
A worked example makes the table easy to read. So, let us build one step by step.
Here is a hypothetical Company A. All numbers are for illustration only and are not real data. Assume it has 10 crore shares in total.
Next, the table below lists each group’s holding. Every row adds up to the total of 100%.
| Group | Holding (%) |
|---|---|
| Promoter and promoter group | 52.40 |
| Foreign portfolio investors (FPI) | 11.85 |
| Mutual funds | 8.20 |
| Insurance companies | 3.10 |
| Other domestic institutions | 1.05 |
| Retail investors | 14.60 |
| HNIs | 5.90 |
| Other non-institutions | 2.90 |
| Total | 100.00 |
Now we group the rows. Domestic institutions = 8.20 + 3.10 + 1.05 = 12.35%.
Next, all institutions = 11.85 + 12.35 = 24.20%. Non-institutions = 14.60 + 5.90 + 2.90 = 23.40%.
So the public holds 24.20 + 23.40 = 47.60%. Add the promoters’ 52.40% and you get 100%.
Indeed, that check is a good habit with any pattern. In shares, the promoters hold 52.40% of 10 crore = 5.24 crore shares.
Quarterly Shareholding Pattern: How Often Does It Change?
Listed companies disclose their shareholding every quarter. You can find it on the company’s investor-relations page and in stock exchange filings.
Because it is updated each quarter, you can compare today’s picture with the earlier ones. However, a single quarter tells you little. A few quarters together show a direction.
Meanwhile, results arrive on a similar schedule, so many readers study both together. Our page on how to check quarterly results of a company shows what to look for in the numbers.
How to read the changes quarter after quarter is a skill of its own. Therefore, we keep this page on the basics, and we will not go deep here.
Why Shareholding Pattern Matters: 5 Things It Tells You
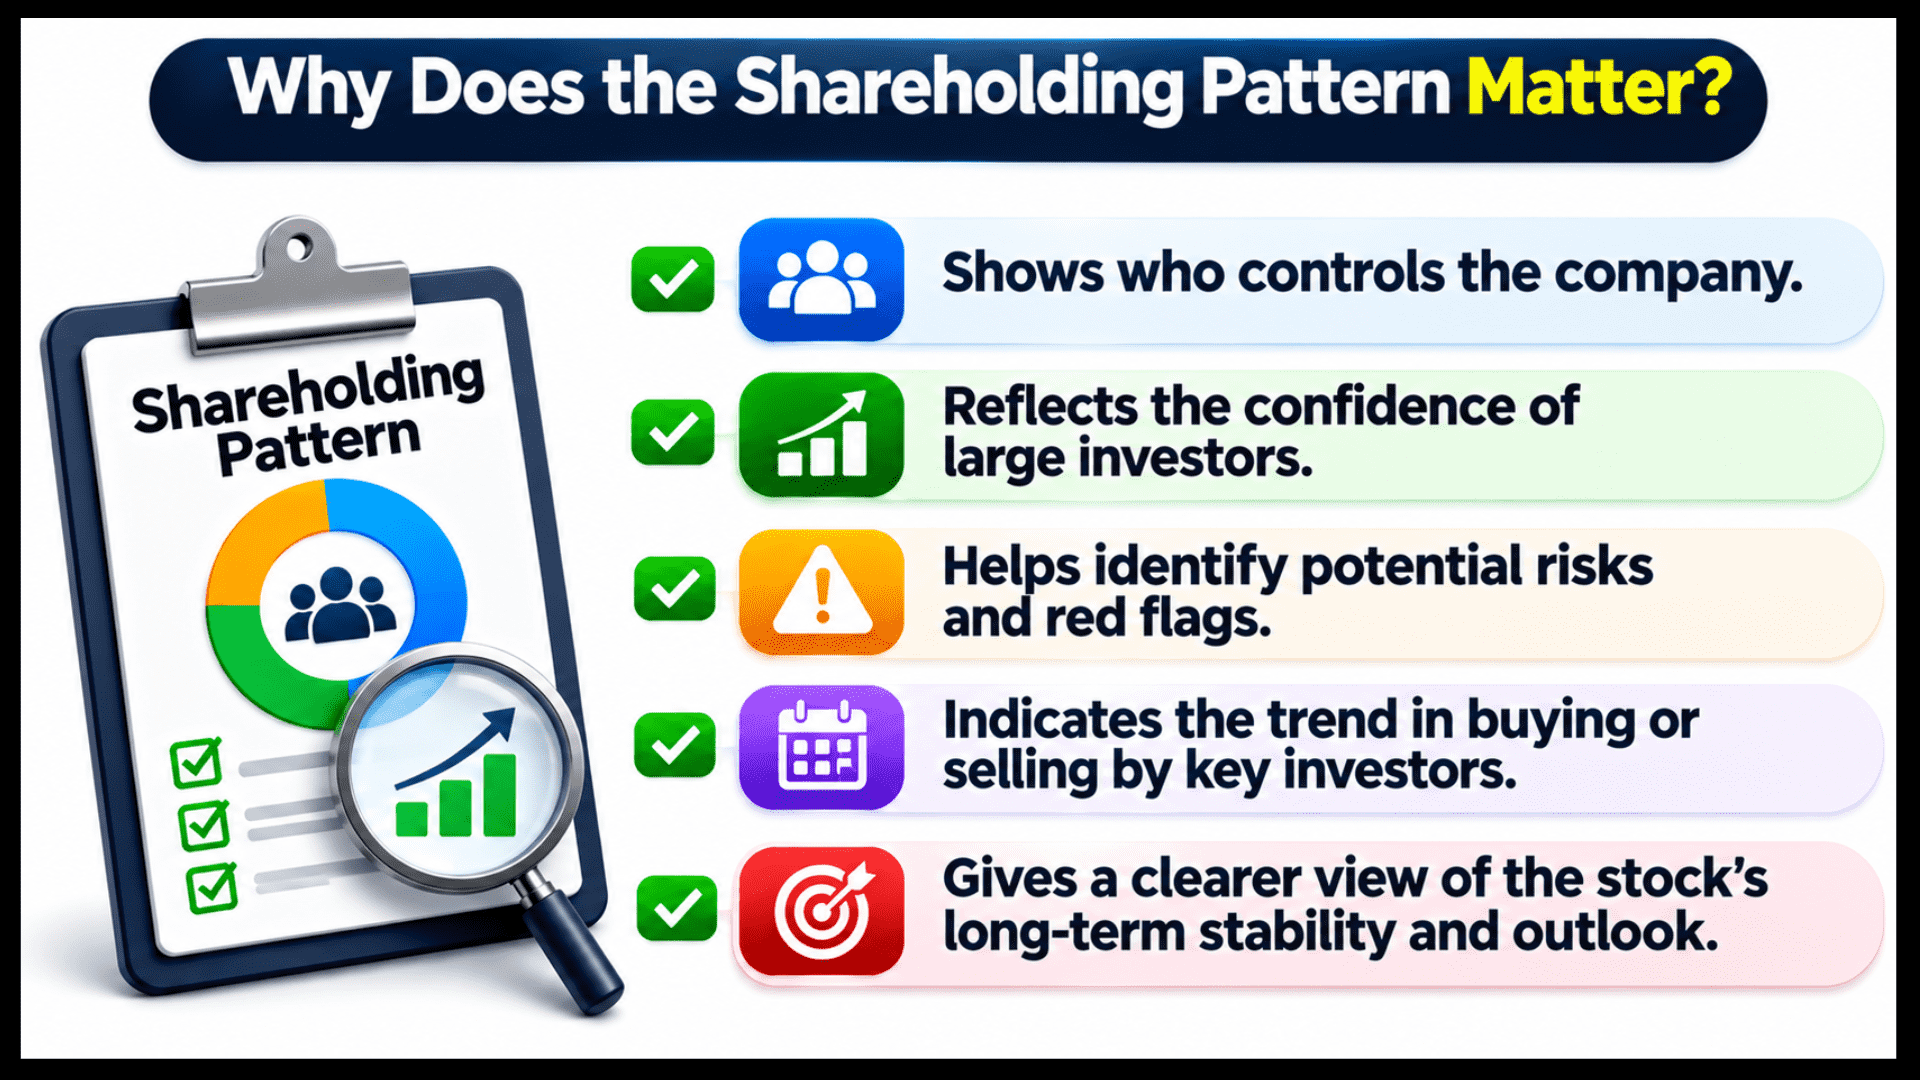
The pattern gives you context that price charts cannot. It tells you who stands behind the company.
- Control. A large promoter stake shows who takes the key decisions.
- Confidence. Promoters adding or reducing shares can hint at how they see the business.
- Institutional interest. Funds that study companies closely may hold a visible stake.
- Supply of shares. A small public holding can mean fewer shares trade freely.
- Risk signals. A high pledge can add stress in a falling market. Wars and global shocks can cause such falls, as the impact of war on stock market shows.
Still, each point is a clue, not a conclusion. The pattern is one input in fundamental analysis.
If you are building that skill from scratch, our page to learn fundamental analysis gives a clear starting path.
In short, think of it like checking the owners of a building before you rent a flat. It does not decide everything, but it tells you something worth knowing.
Shareholding Pattern Terms: Free Float, Pledged Shares and More
A few words appear again and again in the filing. The table below explains them in plain language.
| Term | Meaning |
|---|---|
| Free float | Shares available for the public to trade, outside the promoter group |
| Pledged shares | Promoter shares kept as security for a loan |
| Promoter group | Relatives and entities linked to the promoters |
| HNI | High net worth individual, a wealthy non-institutional investor |
| FPI | Foreign portfolio investor |
Now, let us take two of these in Company A. Free float here = 100 – 52.40 = 47.60%.
Suppose promoters have pledged 10% of their own shares. Then pledged shares = 10% of 52.40% = 5.24% of the total.
However, note that 10% of the promoters’ shares is not 10% of the company. Many beginners mix up the two figures, so read the note carefully.
In addition, free float matters when people judge how a share is priced. Next, to go from ownership to price, read our steps on how to find valuation of a stock.
Shareholding Pattern and Company Quality: What Else to Check?
Ownership data does not replace business analysis. In fact, a company can have a famous investor and still run into trouble.
Likewise, cash generation, debt and profit trends are equally important. For a closer look at cash, read our page on free cash flow meaning alongside the pattern.
Besides, some investors use ownership as a filter when they shortlist companies. A step-by-step approach to this is covered in our page on how to use stock screeners.
Limits of the Shareholding Pattern: What It Cannot Tell You
So, keep these points in mind before you rely on the table.
- It is a snapshot. It shows holdings on one date, not what happens in between.
- Labels can differ. Categories may be named differently across filings.
- Institutions can be wrong. A big fund holding a share is not a guarantee.
- Price effects are mixed. Changes in holding do not decide the price on their own.
- Data can be late. Always check the date and the source of the filing.
For books that teach you to put these clues together, see our list of fundamental analysis books.
Also, a mentor can review how you read such tables, which is a big part of how we teach.
Besides, price moves after each filing also depend on results. So, the impact of quarterly results on share price is worth reading too.
Reading about holdings is easy, but practice on real filings and a mentor’s answers are what build confidence.
Join our live classes from your mobile, ask your doubts and learn step by step.
Conclusion
So, the shareholding pattern is a table of who owns a company and how much each group holds. Promoters, FPIs, DIIs and the public always add up to 100%.
In short, read it every quarter and compare a few quarters together. As a result, you see the direction of ownership, not just one snapshot.
Finally, treat it as one clue among many. Check debt, cash flow and business quality too, because this is learning, not a buy or sell signal.
Disclaimer: This page is for education only. All numbers and companies here are hypothetical and shown for illustration only.
It is not personal advice, and no buy, sell or hold call is made. Please verify disclosure formats and timelines on official exchange websites, do your own research or speak to a registered adviser.
Frequently Asked Questions
Before investing capital, invest your time in learning Stock Market.
Fill in the basic details below and a callback will be arranged for more information: