

A trader may spot a perfect Elliott Wave structure. Five waves up, three waves down. Everything looks like a textbook. Then the trade fails. Why?
Often, the issue is not the pattern but the time frame. Knowing which time frame to read waves on makes all the difference between a winning and losing trade.
Thus, the primary question traders ask is: Which time frame is best for Elliott Wave?
The honest answer is slightly uncomfortable: There is no single perfect time frame.
Professional traders rarely rely on just one chart. They read waves across several charts, from daily to hourly, sometimes even weekly. That layered perspective often reveals the true structure.
Before discussing ideal charts, we need to understand how time behaves in Elliott Wave theory.
Understanding The Elliott Wave Time Frame Concept
The Elliott wave theory time frame works on a principle called fractals. Markets repeat similar wave patterns across different scales.
A five-wave trend on a daily chart may contain smaller five-wave trends inside it on the hourly chart.
To use Elliott wave effectively, you must treat each level as a piece of a larger puzzle.
Think of it like this:
| Time Frame | Wave Perspective |
| Weekly | Long market cycle |
| Daily | Major trend |
| 4 Hour | Swing waves |
| 1 Hour | Sub waves |
| 5 Minute | Micro structure |
Each level represents a piece of the larger puzzle.
A five-minute chart can show valid Elliott Wave microstructures, but without confirmation from a higher time frame, like the 1-hour or 4-hour chart, it may also produce fake impulse patterns.
Always validate five-minute wave counts against the broader structure before taking any trade. So the Elliott wave time frame determines what portion of the market cycle you are analyzing.
Why Does The Same Market Look Different On Every Chart?
Many traders notice something puzzling. The wave count on a daily chart looks completely different from the wave count on a 15-minute chart. That is not an error.
It is actually the core idea behind Elliott Wave theory.
Ralph Nelson Elliott explained that markets move in wave degrees, meaning every wave belongs to a larger wave structure. Smaller waves build larger ones, and larger waves break down into smaller ones.
This is why a complete five-wave structure on a 15-minute chart may represent only Wave 1 of a bigger move on the 1-hour or 4-hour chart.
Simplified Wave Degrees And Their Common Time Frames:
| Wave Degree | Typical Time Frame | How Traders Use It |
| Primary Degree | Weekly or Daily | Identifies the main market trend |
| Intermediate Degree | 4 Hour Chart | Tracks swing waves inside the trend |
| Minor Degree | 1 Hour or 15 Min | Helps find precise trade entries |
Understanding wave degrees solves one of the most common Elliott Wave problems: different charts showing different stories.
In reality, they are all describing the same structure, just at different levels of the market cycle.
Which Time Frame Is Best For Elliott Wave?
Instead of a single chart, experienced traders combine three time frames.
This multi-time frame approach helps traders understand the bigger trend, confirm wave structure, and identify precise trade entries with greater confidence, forming the foundation of effective Elliott Wave strategies for trading.
| Role | Common Chart | Purpose |
| Higher Time Frame | Weekly or Daily | Identify the major trend |
| Middle Time Frame | 4 Hour | Track wave development |
| Lower Time Frame | 1 Hour or 15 Min | Entry timing |
This layered approach solves a common Elliott Wave problem. Waves can look different depending on the zoom level.
For example:
- The daily chart shows a Wave 3 bullish trend.
- The 4-hour chart shows Wave 4 correction.
- 1-hour chart reveals Wave 5 breakout entry.
Suddenly, the structure becomes clear. Most professional wave analysts rely heavily on daily and 4-hour charts.
These time frames balance clarity with actionable signals. Short-term charts often distort wave structures.
Elliott Wave Time Analysis
Elliott Wave time analysis is not just about counting waves. It involves understanding how long waves develop.
Markets move in rhythm. Impulse waves often expand quickly. Corrective waves take longer.
Here is a simple workflow many traders follow:
Step 1. Identify The Market Cycle
Start your analysis with the weekly chart. This is the foundation of your entire wave analysis and should never be skipped.
The weekly chart removes short-term noise and reveals where the market truly stands.
Before moving forward, ask yourself:
- Is the market in a clear uptrend or downtrend?
- Has a five-wave impulse structure already been completed?
- Are we currently in a corrective phase?
Answering these questions first prevents wrong decisions on smaller charts later.
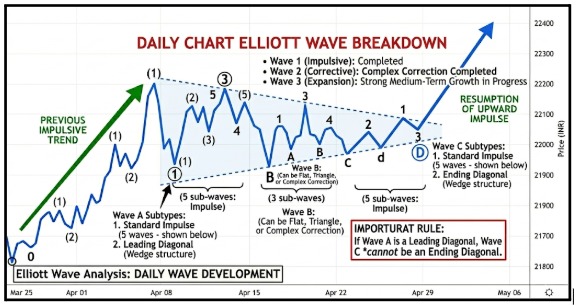
Step 2. Move To The Daily Chart
Once the bigger picture is clear, shift to the daily chart to see how the larger wave breaks down into sub-waves.
This helps you identify precise entry zones and validate whether the structure is unfolding as expected.
Look at the chart below:
This is where most swing traders spend their analysis time.
On the above given chart, look for:
- Whether Wave 1 has completed.
- How deep Wave 2 has retraced.
- Whether Wave 3 is beginning to expand.
The daily chart bridges the big picture weekly view with your actual trade planning.
Step 3. Use Intraday Charts For Entries
After analyzing the weekly and daily charts, move to the 4-hour or 1-hour chart for precise trade entries. This is where analysis turns into action.
At this stage, look for:
- Wave 2 pullbacks to key Fibonacci levels.
- Wave 4 consolidations before Wave 5 begins.
- Momentum is building at the end of the corrective phases.
Always ensure your intraday entry aligns with what the higher time frames are showing. This helps you trade with the dominant trend and avoid false signals from short-term noise.
What To Do When Timeframes Show Conflicting Wave Counts?
Conflicting wave counts across charts confuse many traders. The solution is simple but often overlooked.
The higher timeframe always has priority. Smaller timeframe waves must fit inside the structure of the larger trend, not contradict it.
Think of it like zooming into a map. The closer view shows details, but the broader route still guides the journey.
Example Scenario:
| Time Frame | Wave Observation | Interpretation |
| Daily Chart | Wave 3 bullish trend | Main market direction |
| 4 Hour Chart | ABC pullback | Sub wave correction inside Wave 3 |
| 1 Hour Chart | Small five wave rise | Beginning of Wave 3 continuation |
Key Rule Traders Follow:
- Start analysis on the higher timeframe.
- Treat lower timeframe waves as sub-waves.
- Do not compare charts as separate structures.
- If the counts conflict, follow the larger chart trend.
This approach removes much of the frustration in Elliott wave time analysis.
Once traders recognize wave degrees and hierarchy, what looked like contradictions often become a normal part of Elliott wave time cycles.
Elliott Wave Time Cycles And Market Behavior
Another aspect of Elliott wave time cycles involves the duration of waves. Markets tend to follow certain timing relationships.
Examples often seen in real markets:
| Wave Type | Typical Time Behavior |
| Wave 1 | Slow start |
| Wave 2 | Quick retracement |
| Wave 3 | Fast expansion |
| Wave 4 | Sideways correction |
| Wave 5 | Short final push |
Wave three usually travels fast and far. Corrections often consume more time than impulse waves.
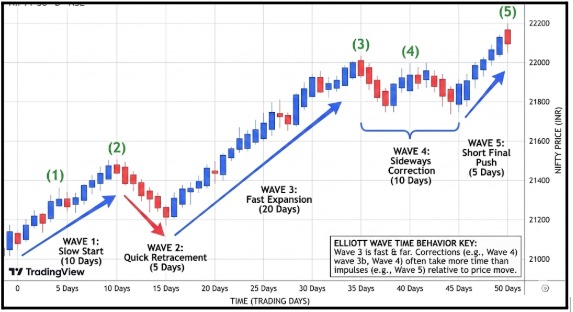
Consider the above chart example:
- The stock index rallies for 10 days, forming Wave 1.
- Wave 2 correction may last 5 days.
- Wave 3 then rallies for 20 days.
The time rhythm helps confirm the wave count.
When timing feels wrong, the wave count may also be wrong. Experienced traders pay close attention to that subtle signal.
Practical Trading Examples of Elliot Wave Time Frame
Theory becomes clearer when you see how Elliott Wave works on real charts.
The examples below show how traders apply wave counts across different time frames to plan entries, exits, and risk more effectively.
Example 1: Swing Trader Using Elliott Wave
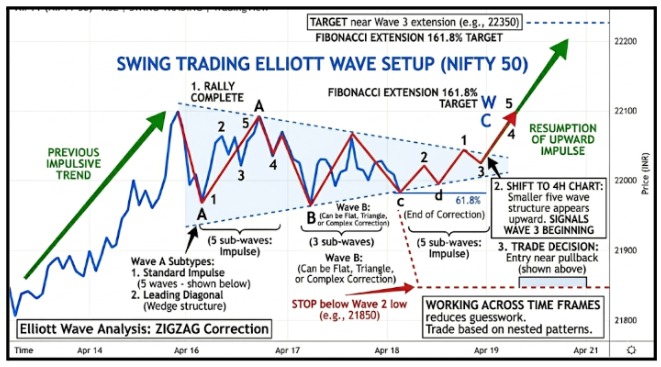
A swing trader studies the above daily chart. This helps identify the broader market trend before zooming in.
The trader makes the following observations:
- Wave 1 rally completed: This confirms the initial impulsive move in the trend direction.
- Wave 2 correction reached Fibonacci 61.8%: A typical retracement level, suggesting a healthy pullback.
Next step. The trader prepares to refine the entry using a lower time frame. The trader shifts to the 4-hour chart.
This allows better timing and clearer structure within the trend.
Now, a smaller five-wave structure appears upward. This indicates momentum is building in the direction of the trend.
That signals Wave 3 beginning. Wave 3 is usually the strongest and most profitable phase.
Trade decision:
- Entry near pullback
- Stop below Wave 2 low
- Target near Wave 3 extension
Time frames working together reduce guesswork. It creates a structured approach instead of random entries.
Example 2: Intraday Trader
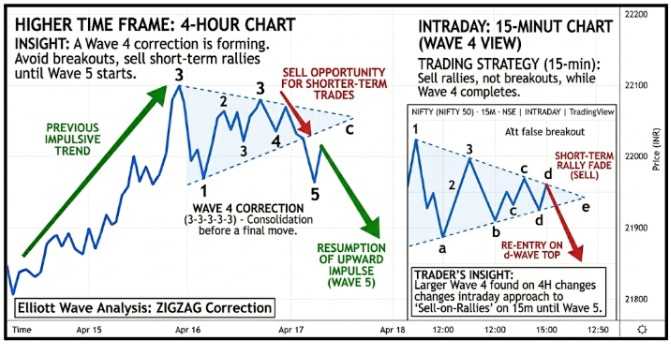
An intraday trader analyzes 15-minute charts. However, before trading, they review the 4-hour chart.
The larger chart shows a Wave 4 correction forming. This changes the strategy completely.
Instead of buying breakouts, the trader sells short-term rallies until Wave 5 begins. Without the higher time frame, that insight would be missed.
Which Timeframes Work Best For Nifty And Bank Nifty Elliott Wave Trading?
For Indian traders, Nifty 50 and Bank Nifty behave differently and require slightly different time frame approaches.
Nifty 50 forms cleaner wave structures due to its broader stock basket. Weekly and daily charts work best for identifying the main trend. The 4-hour chart helps track wave development within that trend.
Bank Nifty is far more volatile. RBI decisions, banking sector news, and global interest rate changes can distort wave structures quickly.
Here, the 15-minute chart becomes more useful for entries, but always confirm it against the daily or 4-hour chart first.
Expiry days also matter. In the last two days before weekly or monthly expiry, short-term wave counts often get distorted by options activity. It is better to rely on the daily chart during these periods.
During major events like the Union Budget or RBI policy announcements, avoid intraday wave counting entirely. Wait for the event to pass and read the daily or 4-hour chart instead.
Common time frame setups used by Indian traders:
- Nifty 50 position trades: Weekly and daily for trend direction, 4-hour for wave structure.
- Bank Nifty swing or intraday: Daily and 4-hour for wave context, 15-minute for entry timing.
- Budget or RBI policy weeks: Shift to daily and weekly charts until volatility settles.
Common Mistakes With Elliott Wave Time Frames
Even skilled traders struggle with wave analysis. The mistakes usually involve time frame selection.
Most Frequent Errors:
- Analyzing only one chart
- Counting waves on very small time frames
- Ignoring the higher time frame trend
- Forcing wave counts when the structure is unclear
- Misreading corrective waves
- Treating Different Timeframe Counts as Independent (When They Should Be Nested)
Short charts often create false wave structures. A five-minute chart may show several fake impulse patterns.
Higher charts usually reveal the truth. When wave counts feel confusing, the best solution is simple: Zoom out.
Choosing The Right Time Frame Based On Trading Style
The time frame you choose should match how long you hold trades, your risk tolerance, and how frequently you analyze charts. Different traders require different wave perspectives.
| Trader Type | Best Elliott Wave Time Frame |
| Position Trader | Weekly and Daily |
| Swing Trader | Daily and 4 Hour |
| Day Trader | 4 Hour and 15 Minute |
| Scalper | 1 Hour and 5 Minute |
Swing traders benefit the most from Elliott Wave theory. The wave structures become clear without excessive noise.
Day traders can still use it, but patience is required.
Not every market move forms a clean wave structure. Sometimes the best trade is simply waiting.
Conclusion
So, which time frame is best for Elliott Wave?
The answer is surprisingly simple.
No single time frame works alone.
Successful traders rely on multi-time frame Elliott Wave analysis. Weekly charts reveal the larger market cycle. Daily charts show wave progression. Intraday charts refine trade entries.
This layered perspective reduces mistakes and improves timing.
Markets move in patterns, but they also move in time. When price and time begin to agree, that is usually where the strongest trades appear.
And when the wave count still feels confusing? Step back, zoom out, and read the market again.
Often, the bigger chart tells the real story.
Want to master Elliott Wave timing in real markets?
Join our Elliott wave classes and learn to read wave structures across all time frames with confidence.
FAQs
Q1: Which Time Frame Is Most Reliable For Elliott Wave?
Ans: Daily and 4-hour charts are considered the most reliable. They show clear wave structures while filtering out short-term market noise.
Q2: Can Elliott Wave Be Used For Intraday Trading?
Ans: Yes. Many traders use 15-minute or 5-minute charts for entries, but they confirm the wave structure using higher time frames like 4-hour or daily charts.
Q3: Why Do Elliott Wave Counts Change Across Time Frames?
Ans: Markets follow fractal patterns. A single wave on a higher chart can contain multiple smaller waves on lower charts, which changes how the structure appears.
Q4: Which Time Frame Works Best For Beginners Learning Elliott Wave?
Ans: The daily chart is the best starting point for beginners. It shows clear wave structures without too much noise and gives enough time to analyze and plan trades without rushing.*
Q5: How Many Time Frames Should A Trader Monitor Simultaneously?
Ans: Three time frames are generally sufficient. One higher time frame for trend direction, one middle time frame for wave structure, and one lower time frame for trade entries.
Before investing capital, invest your time in learning Stock Market.
Fill in the basic details below and a callback will be arranged for more information:


