

Most traders do not lose because of bad strategies. They lose because they cannot tell when a trend is actually starting.
Learning how to trade EMA crossover gives you a clear answer to that problem every time you open a chart.
The idea is simple. Two or more exponential moving averages sit on your chart, and when one crosses the other, it signals that a trend may be beginning or reversing.
That one signal turns speculation into a concrete trading decision, and that’s why it becomes important to have the right knowledge about it.
Let us understand how to trade EMA crossover in a simple way.
What Is EMA Crossover?
Before jumping into the trading section, let us first understand what EMA crossover means so that you can understand the main concept easily.
Most traders have heard of the simple moving average, but the exponential moving average, or EMA, is a step ahead.
The reason is simple. It gives more weight to recent prices instead of treating every data point equally, which makes it far more responsive to what the market is doing right now rather than what it was doing weeks ago.
Now, when you place two EMAs on your chart, one faster and one slower, something interesting happens. At certain points, they cross each other, and that crossover is not just lines overlapping.
It is the market telling you that momentum may be shifting.
Here is how to read it:
- Bullish crossover: The fast EMA crosses above the slow EMA, which is a possible buy signal
- Bearish crossover: The fast EMA crosses below the slow EMA, which is a possible sell signal
Think of it this way.
When a 9 EMA crosses above a 21 EMA on a stock chart, it is suggesting that short-term momentum is picking up and a potential upward move may be building.
That single crossover is the foundation on which the entire moving average crossover strategy is built.
Simple in concept but very powerful when applied correctly.
How to Trade EMA Crossover: Step-by-Step
Trading EMA crossovers is not simply about lines crossing, but all about the execution.
Even the difference between a minor loss and a powerful winning trade can be a matter of timing of entries and following some definite rules.
Here are some simple steps on how to trade EMA crossover:
Step 1: Choose EMAs Based on Your Style
Picking the right EMAs is the foundation of a successful crossover strategy because different styles demand different sensitivity to price changes.
- Short-term: 5 EMA and 13 EMA for quick momentum
- Medium-term: 8 EMA and 21 EMA for swing trades
- Long-term: 50 EMA and 200 EMA for positional trends
Selecting EMAs that match your trading horizon ensures signals are timely and relevant, reducing false entries.
Note: The most critical matching when choosing EMAs to use in positional trades or long-term trades is the pairing of the 50 EMA and 200 EMA.
When the 50 EMA moves above the 200 EMA, it is called a Golden Cross, indicating a possible beginning of a significant uptrend and a buy signal.
On the other hand, a Death Cross occurs when the 50 EMA crosses below the 200 EMA, and the market is likely to be on a down trend and sell signal.
These are long-term crossovers that both institutional and retail traders are keen to follow to affirm trends.
Step 2: Confirm the Trend and Validate the Signal
Even the best EMA crossover can fail if you trade against the bigger trend. Trend confirmation keeps you on the right side of the market.
Many traders hesitate here and wonder is ema crossover profitable when they see a signal that doesn’t immediately move in their favor.
The reality is that confirming trend alignment improves accuracy and prevents entering trades that fight dominant market pressure.
- Check the higher timeframe trend to avoid false signals
- Align EMA direction with overall market momentum
Confirming trend alignment improves accuracy and prevents entering trades that fight dominant market pressure.
How to Avoid False Crossover Signals: The 2-3 Candle Rule?
False EMA crossovers can eat into your profits if you act on every single signal. The 2-3 candle confirmation rule is a simple way to filter out these traps.
Instead of entering immediately when a fast EMA crosses a slow EMA, wait for 2-3 consecutive candles to close with the crossover holding.
Many advanced traders compare Double EMA vs EMA setups during this waiting period.
While the standard EMA requires this 2-3 candle patience to be safe, a Double EMA (DEMA) is designed to reduce lag, often giving you a valid crossover signal slightly earlier without sacrificing as much accuracy.
- Bullish signal: Fast EMA above medium EMA, medium EMA above slow EMA for 2-3 candles
- Bearish signal: Fast EMA below medium EMA, medium EMA below slow EMA for 2-3 candles
This is actually effective in trending markets rather than in sideways ranges. It should be used together with other indicators such as RSI, MACD, or OBV to further enhance the quality of signals.
Waiting until you see more than a handful of candles compared to jumping in when news spikes or short-term volatility hits guarantees you fewer but higher-probability trades.
Step 3: Entry Rules
Clear entry rules prevent hesitation and emotional decision-making, giving your trades a structured start.
- Enter long when the fast EMA crosses above the slow EMA, and the price closes above the fast EMA on that candle.
- Enter short when the fast EMA crosses below the slow EMA, and the price closes below the fast EMA on that candle.
The Pullback Entry
Instead of entering immediately at the EMA crossover, wait for the price to pull back to the fast EMA.
Look for a bullish candle forming at the retest and enter on its close, placing the stop just below the pullback low.
This method gives a more precise entry, improves risk-reward, and avoids chasing trades after the initial move.
For strong trends, you can also watch for the price to test both the 9 EMA and 21 EMA for continuation or failure trades.
Step 4: Stop Loss and Risk
Sticking to predefined entry conditions increases consistency and ensures you capture momentum efficiently.
- Place a stop loss below the recent swing low for long trades
- Use a risk-reward ratio of at least 1:2
Maintaining disciplined risk rules prevents small losses from turning into major setbacks, keeping your trading sustainable.
Note: If the swing low stop creates a poor risk-reward ratio, consider using an ATR-based stop instead.
ATR or Average True Range measures market volatility and helps set dynamic stop levels based on current price movement.
Step 5: Exit Strategy
Knowing when to exit is as important as entering. Trailing stops and trend monitoring safeguard profits.
- Trail stop along the slower EMA
- Close trade if EMAs start flattening or crossover reverses
A clear exit plan locks in gains and avoids letting emotions dictate the trade’s outcome.
Even with a clear setup, patience is key. Many traders exit too early or chase trades late, losing potential profits.
Best EMA Crossover Strategy for Day Trading
Day trading requires speed. The best EMA crossover for intraday strategy focuses on short-term EMAs that respond quickly to price swings.
Recommended EMAs:
- Fast EMA: 5 or 9
- Slow EMA: 13 or 21
A popular approach for scalpers is the 5 EMA strategy, which uses the 5-period average to catch rapid momentum bursts before they are visible on slower timeframes.
For traders who want slightly more confirmation, the 9 EMA strategy is a gold standard for catching the “meat” of the move on a 5 or 15-minute chart.
How It Works:
- Watch for price pullbacks to the fast EMA after a crossover
- Confirm with volume spikes for better probability
Day traders should avoid long sideways phases, as EMA crossovers perform poorly in choppy markets.
Best EMA Crossover for Swing Trading
Swing trading is slower and more relaxed. Here, the best EMA crossover for swing trading uses medium-term EMAs to capture multi-day trends.
Recommended EMAs:
- Fast EMA: 8 or 10
- Slow EMA: 21 or 34
Another highly reliable combination for medium-term traders is the 20 and 50 EMA Crossover, which filters out minor price noise while keeping you aligned with the primary trend.
How It Works:
- Confirm the trend on the daily chart first
- Enter trades on crossovers with trend alignment
This setup allows trades to ride bigger moves while giving room for minor pullbacks without triggering stop losses unnecessarily.
1. Swing Trading Workflow
To trade effectively, bridge the gap between trend confirmation and precise entry using multiple timeframes:
- Weekly Chart: Identify the long-term trend and overall market direction.
- Daily Chart: Spot EMA crossover signals that align with the weekly trend.
- 4-Hour Chart: Time pullback entries in the direction of the higher timeframe trend for better precision.
This three-level approach ensures swing trades are executed with discipline and reduces the risk of counter-trend entries.
EMA Crossover Trading Strategy Tips
Minor adjustments bring significant results. It is also possible to considerably raise accuracy by reviewing previous trades and ratifying EMAs to fit various market settings.
- Confirm crossover with the higher timeframe trend
- Use volume or momentum indicators for additional confirmation
- Avoid low-volume sessions to reduce false signals
- Trail stop along the slower EMA for better risk management
For traders who can’t monitor charts constantly, TradingView alerts make EMA crossover signals much easier to act on.
To set up an alert, click the bell icon on your EMA indicator, select the “crosses” condition, and choose the direction of the crossover you want to track.
This way, you get instant notifications when your setup triggers, ensuring you never miss a potential trade.
The Three-EMA Crossover System for Stronger Signals
An additional third EMA can certainly make a difference to the traders willing to minimize false signals.
A three-EMA crossover system involves a faster EMA (such as 9) overpowering a middle EMA (such as 21) whilst they both conquer a slower EMA (such as 55) as an affirmation of a bullish momentum.
Many intraday traders specifically prefer using the 5 8 13 EMA crossover strategy because these Fibonacci-based settings capture short-term trend shifts with incredible precision.
On the other hand, the three are all stacked bearishly, suggesting a powerful downtrend. Using this triple alignment filters out weaker setups, giving fewer but higher-quality crossover signals.
When There Is No Crossover
When the market is in a strong upward trend, the fast EMA would remain higher than the slow EMA without necessarily passing through it, indicating a strong current trend.
Traders should also observe pullbacks within the area of the fast and slow EMAs rather than wait to experience a new crossover.
These pullbacks will provide high probability entry points that will allow you to ride the trend without missing any significant moves.
By acknowledging this trend, one avoids being frustrated by the way of waiting for signals that may never come.
EMA Crossover Trade Example
Clarity comes with numbers. Let’s run a practical example using EMA crossover on a 15-minute chart of Bank Nifty.
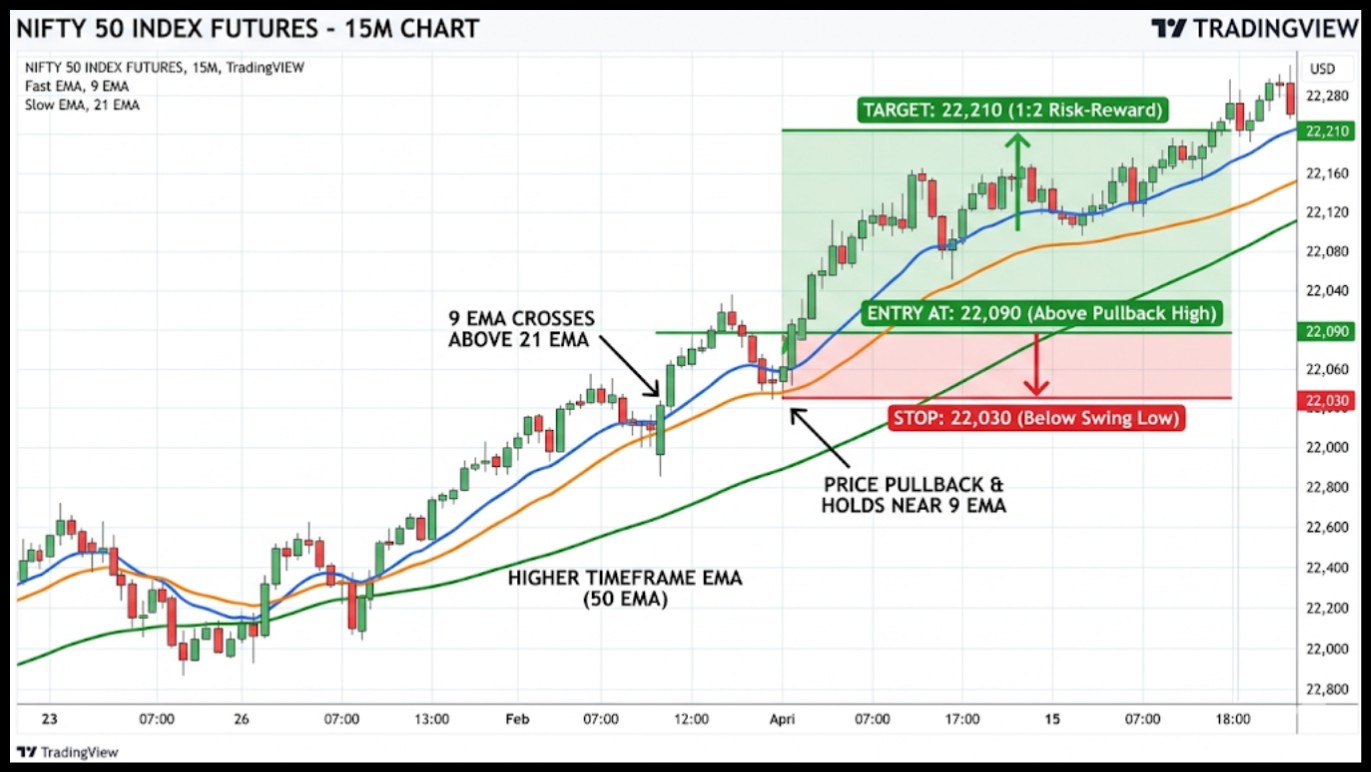
Trade Setup:
- Price: 48,300
- Fast EMA: 9 EMA at 48,280
- Slow EMA: 21 EMA at 48,250
Entry Conditions:
- 9 EMA crosses above 21 EMA
- Price pulls back and holds near 9 EMA
- Entry at: 48,310
Stop And Target:
- Stop: 48,250 (below swing low)
- Risk: 60 points
- Target: 48,430 (1:2 risk-reward)
Outcome:
- Price moves in favor and hits the target within a few candles
- Trend confirmed by the higher timeframe 50 EMA pointing upward
This shows how EMA crossover works in a real scenario with defined entry, stop, and target. Following such clear rules helps remove guesswork and keeps emotions from interfering with your trades.
Common Mistakes While Trading EMA Crossover
Even a simple EMA crossover system can go wrong if traders ignore discipline. The strategy itself is not the problem.
The problem is the trader who bends the rules the moment things get uncertain.
Here are the most common mistakes you need to watch out for:
- Trading Sideways Markets: EMA crossovers are trend-following tools, and they simply do not work well when the market is moving nowhere.
- Entering Too Late After the Crossover: Chasing a trade after the move has already happened means you are accepting a poor entry with limited upside.
- Ignoring Stop Loss Levels: Skipping your stop loss even once can result in a loss that wipes out multiple winning trades in a single moment.
- Overtrading Multiple Signals: Not every crossover deserves a trade, and taking every signal without context leads to unnecessary and avoidable losses.
- Entering the Crossover Candle Itself: Jumping in on the exact candle where the crossover happens is premature and often results in getting trapped in a false move.
Overconfidence and chasing setups without context often turn promising trades into losses.
Stick to clear rules and let EMAs guide your entries, not emotions.
Conclusion
If there is one strategy that has stood the test of time in trading, it is the EMA crossover. It is not flashy, it is not complicated, but it works because it is built on something real, which is price momentum.
Once you understand how to trade EMA crossover properly, you stop feeling lost in the charts and start seeing opportunities that you would have missed before.
The traders who struggle with this strategy are not struggling because of the EMA. They struggle because they skip the rules when things get uncertain.
They chase late entries, ignore stop losses, and trade sideways markets out of boredom.
Do not be that trader and align your EMAs with the trend, wait for confirmation, protect your capital, and trust the process.
The market will always give you another setup. Your job is simply to be ready when it does.
Master EMA crossovers and boost your trading skills. Join our Technical Analysis classes today.
FAQs
Q1: Which EMA Pair Works Best for Day Trading?
Ans: Pairs like 5 EMA and 13 EMA or 9 EMA and 21 EMA work well on short intraday charts for quick momentum trades.
Q2: Can EMA Crossovers Be Used for Swing Trading?
Ans: Yes, medium-term EMAs like 8 EMA and 21 EMA or 10 EMA and 34 EMA capture multi-day trends for swing trades.
Q3: How Do I Reduce False Signals With EMA Crossovers?
Ans: Confirm crossovers on higher timeframes and use volume or momentum indicators to filter weak setups.
Q4: What Risk-Reward Ratio Should I Use?
Ans: A minimum of 1:2 is recommended, with stop loss placed below swing lows for long trades or above swing highs for short trades.
Before investing capital, invest your time in learning Stock Market.
Fill in the basic details below and a callback will be arranged for more information:


