

Most traders chase complex indicators, only to realise simplicity works. If messy charts have ever made you miss good trades, you’re not alone.
That’s where the 9 EMA strategy makes things easier. It gives you one clean, responsive line that moves with price and shows you where the real momentum is.
Instead of lagging behind, it stays close to price action and helps you catch strong entries before the move runs away.
It’s one of those rare tools that works for both beginners and experienced traders.
Whether you’re trading intraday or taking quick scalps, it helps you stay aligned with the trend while keeping your risk under control.
Let’s break it down in a practical and simple way.
What Is The 9 EMA Strategy?
The 9 EMA strategy is a short-term trading strategy in which the 9-period Exponential Moving Average is used to follow the momentum and identify rapid entries.
It is responsive compared to simple moving averages, and this has made it popular with intraday traders.
Think of it as a dynamic guide. During high trends, the price has a tendency to respect the 9 EMA. When it hugs the line, momentum is intact.
When it breaks away, something is shifting.
The 9 EMA is calculated by first taking a simple moving average of the last nine periods. The specific moving average calculation then uses a multiplier derived from the period using the formula 2 ÷ (9+1) = 0.20.
This multiplier is then applied as:
EMA = (Current Price × 0.20) + (Previous EMA × 0.80).
This means the latest price carries 20% weight, which makes the 9 EMA react faster than longer-period averages.
Why Does The 9 EMA Work So Well?
The 9 EMA responds quickly to price changes. That’s its edge.
Short-term traders don’t want delayed signals. They want something that moves with the market, almost like a shadow.
The 9 EMA does that. While some traders use a 5 EMA strategy for even faster scalping entries, the 9 EMA provides a perfect balance.
It is quick enough to catch momentum but stable enough to filter out some of the minor price “hiccups” that a 5-period average might catch.
Here’s why it’s widely used:
- It reflects recent price action more than older data
- It helps identify micro trends within bigger moves
- It acts as dynamic support and resistance
- It gives faster entry signals compared to 20 or 50 EMA
But here’s the catch. Faster signals also mean more noise. That’s why discipline matters more than the indicator itself.
How to Read the 9 EMA Strategy Chart?
A 9 EMA strategy chart looks simple, but there’s nuance behind it. You’ll typically see price candles and a single EMA line. Sometimes traders add a 20 EMA for confirmation, but the 9 EMA remains the core.
Key Observations On The Chart:
- Price above 9 EMA suggests bullish momentum
- Price below 9 EMA suggests bearish pressure
- Repeated bounces off the EMA indicate trend strength
- Sharp breaks with volume hint at reversals
These signals help you read momentum quickly and avoid second-guessing every move.
When combined with proper risk control, they give a clear structure to your trades and improve decision-making over time.
Simple Chart Scenario
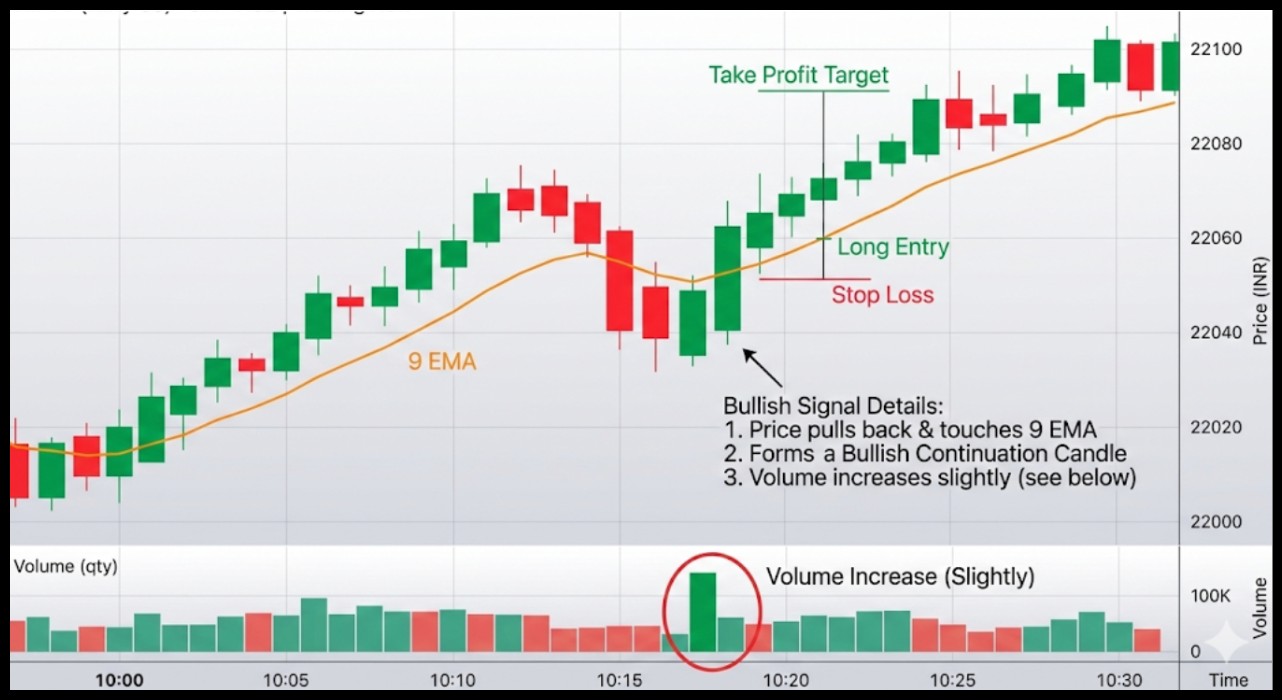
Let’s take the above stock, which is moving up on a 5-minute chart.
- Price pulls back and touches the 9 EMA
- It forms a bullish candle
- Volume increases slightly
That’s often a continuation signal. Traders enter long with a stop just below the EMA. It sounds simple. It is simple. But execution is where most fail.
9 EMA Strategy For Scalping
The 9 EMA strategy for scalping is where things get fast and intense. Scalpers rely on small moves.
The 9 EMA helps them catch those quick bursts without waiting too long.
Typical Scalping Setup:
- Timeframe: 1-minute or 3-minute
- Indicator: 9 EMA
- Market: High volume stocks or indices
This setup works best when the market shows a clear direction, and liquidity is strong. Stick to strict entry and exit rules, because in scalping, consistency matters more than catching big moves.
Entry Rules:
- Buy when the price pulls back to the 9 EMA in an uptrend
- Sell when the price rallies to the 9 EMA in a downtrend
- Confirm with a strong candle close
Exit Rules:
- Target small profits, usually 0.5% to 1%
- Exit if the price closes on the opposite side of the EMA
Scalping sounds exciting. It is. But it demands focus and quick decision-making. One hesitation can wipe out multiple small gains.
Risk Rules:
|
Rule |
Explanation |
| Risk per trade |
1 to 2 percent of capital |
|
Stop loss |
Just below or above 9 EMA |
| Reward ratio |
Aim for at least 1:1.5 |
It’s tempting to ignore stops when the trade “feels right.” That’s how losses grow. Stick to rules, even on good days.
Discipline protects your capital when emotions try to take over. In the long run, consistent risk control matters more than any single winning trade.
9 EMA With 20/21 EMA: The Most Reliable Combination
A 9 EMA is an effective tool, although a combination with 20 or 21 EMA is much more reliable.
Understanding how to trade EMA crossover signals between these two lines helps you distinguish between a minor price fluctuation and a true shift in momentum.
Such a system eliminates weak trades and leaves you in line with the bigger trend.
This combination is used by many traders due to its noise reduction and better decision-making capabilities, particularly in fast-moving markets.
How The Rule Works In Practice:
- When 9 EMA is above 20 or 21 EMA → Only look for buy trades
- When 9 EMA is below 20 or 21 EMA → Only look for sell trades
- Ignore trades that go against this direction
- Use pullbacks to the 9 EMA for precise entries
Trading against this EMA alignment tends to produce false signals and poor results. When the 9 EMA and 20/21 EMA are not aligned, it is better to stay out and wait for a cleaner setup.
Simple Example:
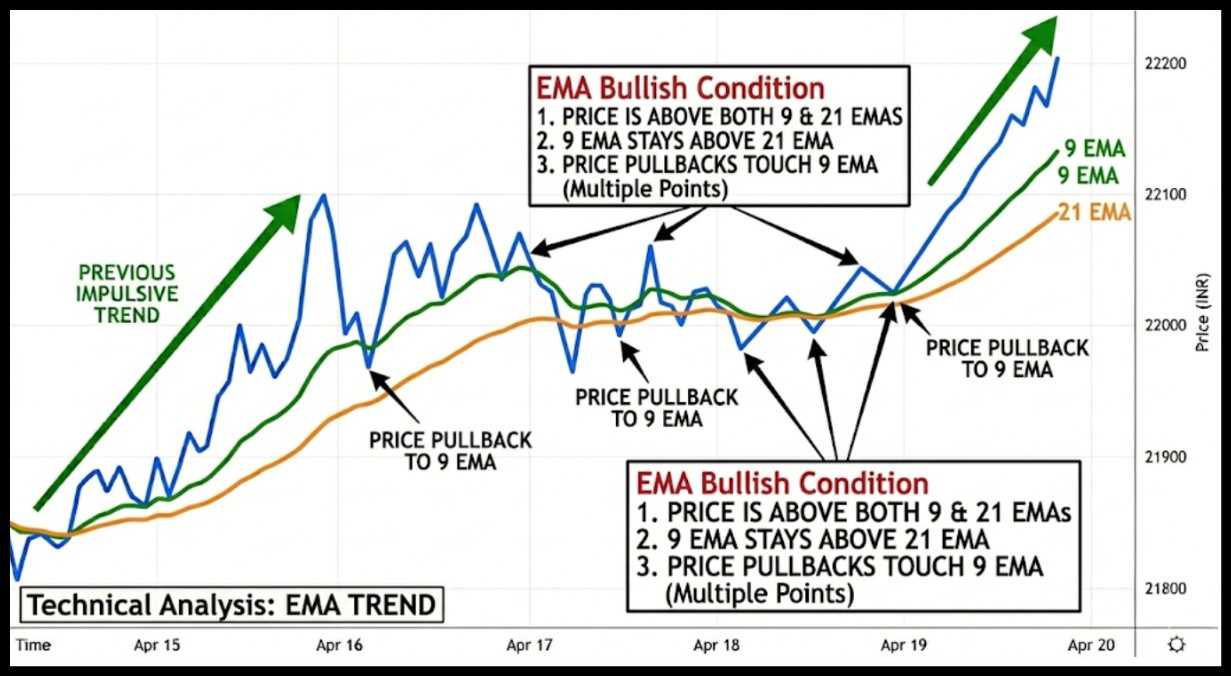
- Price is above both EMAs
- 9 EMA stays above 21 EMA
- Price pulls back and touches the 9 EMA
That pullback becomes a high-probability buy setup. The 21 EMA acts like a trend filter, keeping you on the right side of the market and reducing false signals significantly.
The 9/30 EMA Strategy (Mike Burns Method)
The 9/30 EMA strategy, introduced by Mike Burns, pairs the 9 EMA with the 30 WMA to capture trend continuation trades.
The 30 WMA defines the overall trend, while the 9 EMA helps spot pullback entries.
In an uptrend, when the price retraces and the 9 EMA moves toward the 30 WMA, it signals a potential buy.
This setup is widely used for swing trading alongside intraday EMA strategies.
The 9/21/55 Triple EMA System
The 9/21/55 EMA setup adds a strong layer of trend confirmation by using the 55 EMA as a long-term filter.
When EMAs are stacked bullishly (9 > 21 > 55), traders look to buy entries after a pullback toward the 9 or 21 EMA, provided the broader trend remains intact above the 55 EMA.
When stacked bearishly (9 < 21 < 55), only sell setups are considered on breakdowns.
This structured approach removes most counter-trend trades and keeps decisions clear and rule-based.
9 EMA Strategy Accuracy And Win Rate
Let’s address what everyone wants to know. The 9 EMA strategy accuracy and the 9 EMA strategy win rate. There’s no fixed number.
Markets don’t work that way. But based on real trading patterns:
- Win rate ranges between 50% to 65%
- Higher in trending markets
- Lower in sideways conditions
What Affects Accuracy:
- Market structure
- Timeframe used
- Risk management discipline
- Confirmation signals
These factors work together, not in isolation. When aligned, they can significantly improve your edge with the 9 EMA strategy. Ignore even one, and accuracy often drops faster than expected.
Reality Check:
A 60% win rate with proper risk management can be highly profitable. Even a 50% win rate works if your winners are bigger than your losers.
So the 9 EMA strategy’s success rate depends less on the indicator and more on the trader.
Real Trading Example
Let’s walk through a practical scenario.
Example 1: Intraday Long Trade
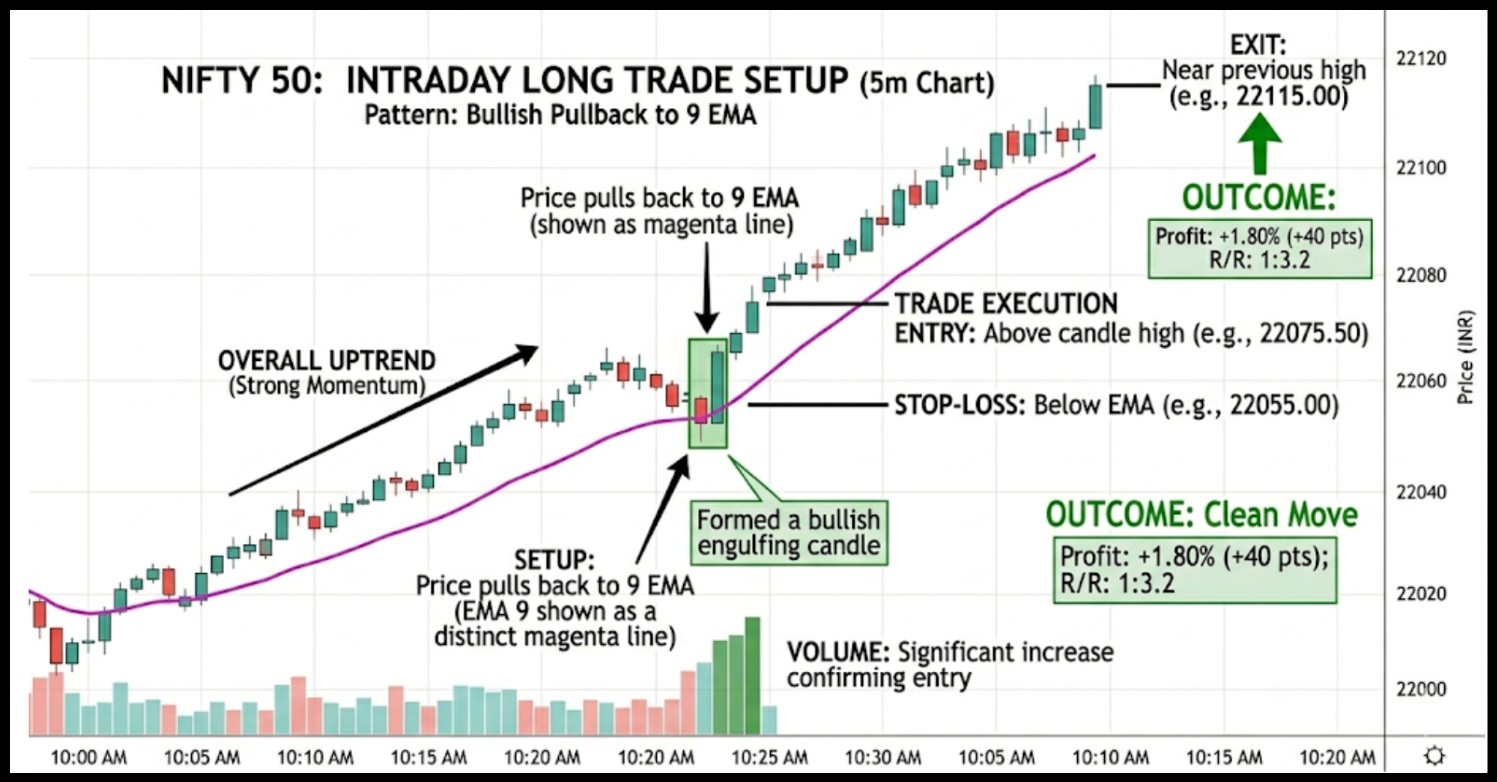
On a 5-minute chart of Reliance Industries in a clear uptrend, the price pulled back to the 9 EMA and formed a bullish engulfing candle with a noticeable rise in volume. ‘
This signaled a potential continuation move, so the entry was taken just above the candle’s high, with a stop loss placed below the EMA.
The trade played out smoothly, reaching near the previous high and delivering a clean 1.8% gain.
Example 2: Failed Trade
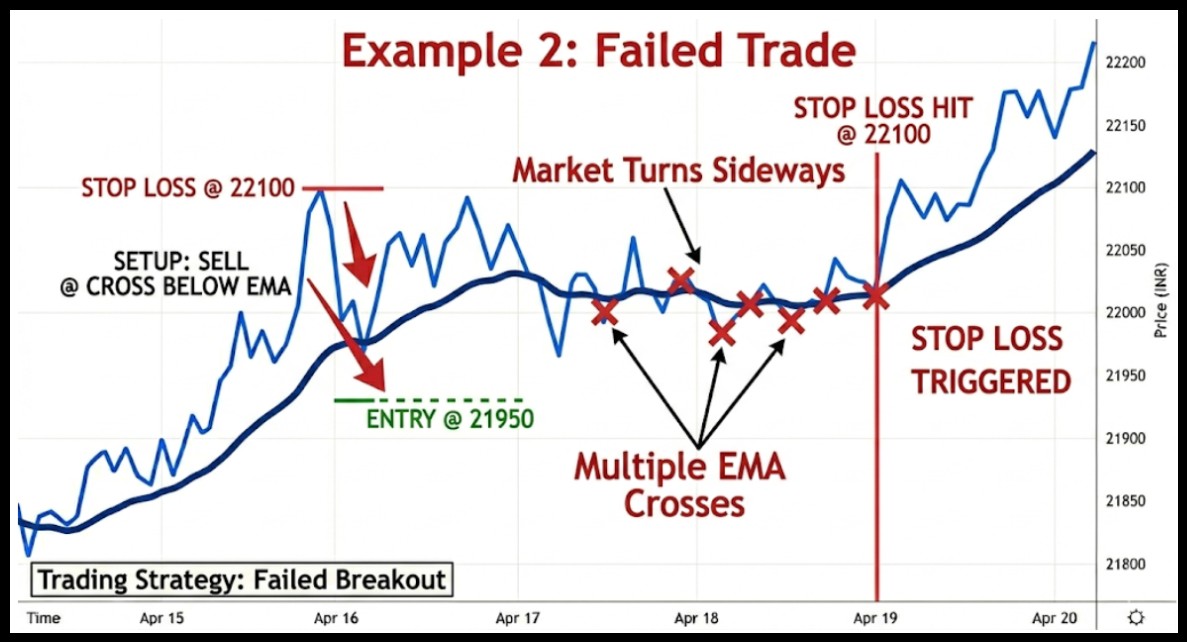
In this case, the same setup appears, but the market loses direction and starts moving sideways. Price begins to cross the 9 EMA repeatedly, showing a lack of clear momentum.
Instead of respecting the trend, it creates confusion with false signals. As a result, the trade fails to follow through, and the stop loss gets triggered, leading to a small loss.
This is where traders get frustrated. Same setup, different result, that’s trading. No system wins all the time.
Common Mistakes Traders Make
Even a solid 9 EMA trading strategy fails if used poorly. It is blindly followed by many traders because of the management of various traders, as they do not understand the market context, resulting in inconsistent outcomes.
It is not the indicator that fails; it is how it is used under pressure and in the absence of a clear strategy.
Mistakes To Avoid:
- Trading in sideways markets
- Ignoring the higher timeframe trend
- Overtrading on small signals
- Moving stop losses emotionally
A small contradiction here. The 9 EMA is simple, yet hard to master.
Why?
Because discipline is harder than analysis, most traders don’t fail due to a lack of knowledge; they fail due to inconsistent execution.
Conclusion
The 9 EMA strategy is one of the most powerful tools a trader can have in their arsenal, but like any strategy, it is only as good as the discipline behind it.
Markets are unpredictable, and no indicator in the world can guarantee profits on every single trade you take.
What the 9 EMA does brilliantly is give you a structured, objective way to read momentum and stay aligned with the trend instead of fighting against it.
Keep your setups simple, your risk controlled, and your focus on execution rather than perfection because that is what separates profitable traders from the rest.
Consistency is not built in one great trade; it is built trade after trade, with patience, discipline, and an unwavering respect for the process.
If you want to sharpen your execution with real-time practice, join our stock market classes, where you learn how to apply the 9 EMA on live charts with clarity and confidence.
FAQs
Q1: What Is The Best Timeframe For The 9 EMA Strategy?
Ans: Lower timeframes like 1-minute and 5-minute work well for scalping, while 15-minute charts suit intraday traders. Choose based on your trading style.
Q2: Is The 9 EMA Strategy Good For Beginners?
Ans: Yes, it’s simple to understand and apply. But beginners must focus on risk management and avoid trading in choppy markets.
Q3: Can The 9 EMA Strategy Be Used Alone?
Ans: It can be used alone, but adding volume or support and resistance improves accuracy. Confirmation reduces false signals.
Before investing capital, invest your time in learning Stock Market.
Fill in the basic details below and a callback will be arranged for more information:


