



ChatGPT prompts for technical analysis help you learn only when you use them with care. Here are 15 copy-ready prompts, and each one comes with a check to run after the answer.
Use them to understand charts, not to collect trade tips. AI can also get a number wrong without any warning.
How Do You Write a Good ChatGPT Prompt for Technical Analysis?
A vague question gets a vague answer. Tell ChatGPT who you are, what you have, and the format you want.
Add these five parts to every prompt you write:
- Your level: say you are a beginner learning technical analysis for Indian markets.
- One clear task: explain, compare, check or list, but not all at once.
- Your own data: the prices or chart description that you typed yourself.
- The format: a table, a short checklist or three bullet points.
- A limit: “Give no buy or sell advice and say when you are unsure.”
The last part matters most, because asking the AI to admit doubt reduces confident guesses.
Which ChatGPT Prompts Help You Learn Candlesticks, RSI and Moving Averages?
Start here if you are new to charts. These prompts turn ChatGPT into a patient tutor for trend, candlesticks, RSI and moving averages.
Copy one prompt at a time, then run the check in the last column before moving on.
| Goal | Prompt to copy | What to verify afterwards |
|---|---|---|
| 1. Learn trend basics | Explain uptrend, downtrend and sideways market to a beginner using a simple rupee price example. End with 3 questions to test me. | Check definitions against class notes. Confirm the example prices really form the trend. |
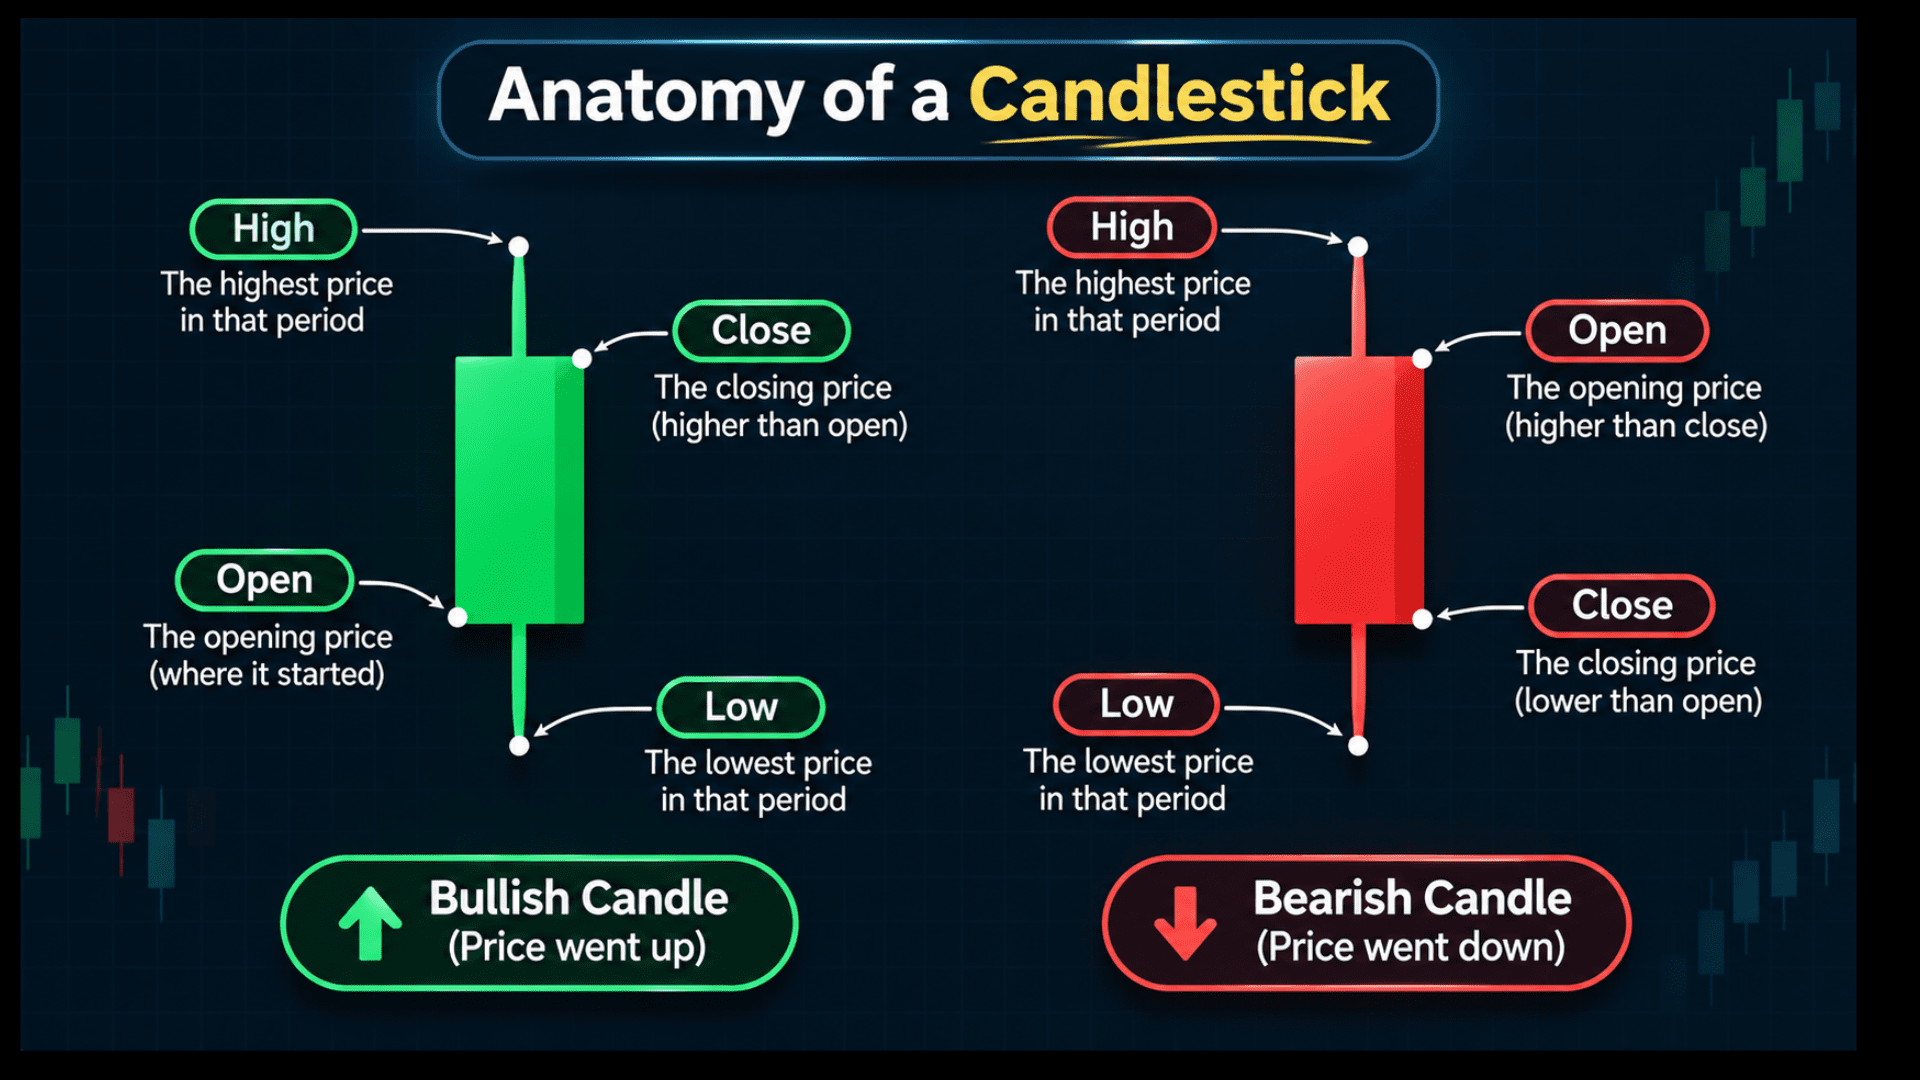
| 2. Understand candlesticks | Explain how one daily candle forms from open, high, low and close. Use a made-up example in rupees and say what each part shows. | Redraw the candle by hand and match body and wicks. |
| 3. Explain RSI | Explain RSI in simple words: what it measures, the usual 14-period setting, and why 70 and 30 are only reference levels. List 3 limits. | Compare the formula with a trusted textbook. |
| 4. Explain moving averages | Explain simple and exponential moving averages with a 5-day price example. Show every calculation step. | Recalculate each average yourself. AI arithmetic can slip. |
| 5. Compare two indicators | Compare MACD and RSI in a table: what each shows, and one situation where each can mislead a beginner. | Watch for claims that sound too certain. |
Once the basics are clear, test them on a real setup. You can see how a 20 and 50 EMA crossover is built and judged on live charts. Then ask ChatGPT to quiz you on it.
How Can You Use ChatGPT to Read Charts and Find Support and Resistance?
AI cannot see your screen unless you describe it or paste the data. Your input decides the quality of the answer.
Always mention the timeframe and session, because an intraday candle behaves differently across the day. Our note on intraday trading time in India explains why timing matters.
| Goal | Prompt to copy | What to verify afterwards |
|---|---|---|
| 6. Read a chart you describe | My daily chart: price rose from 480 to 540 in 3 weeks on rising volume, then fell to 515 on lower volume. What can an analyst observe, and what is not visible here? Give no advice. | Compare with the real chart. The AI only knows what you typed. |
| 7. Read a pasted data table | Here are 10 daily closing prices in rupees: [paste]. Give the highest, the lowest and the 5-day simple average of the last 5 closes. Show working. | Recalculate with a calculator. Any number that is not in your data is invented. |
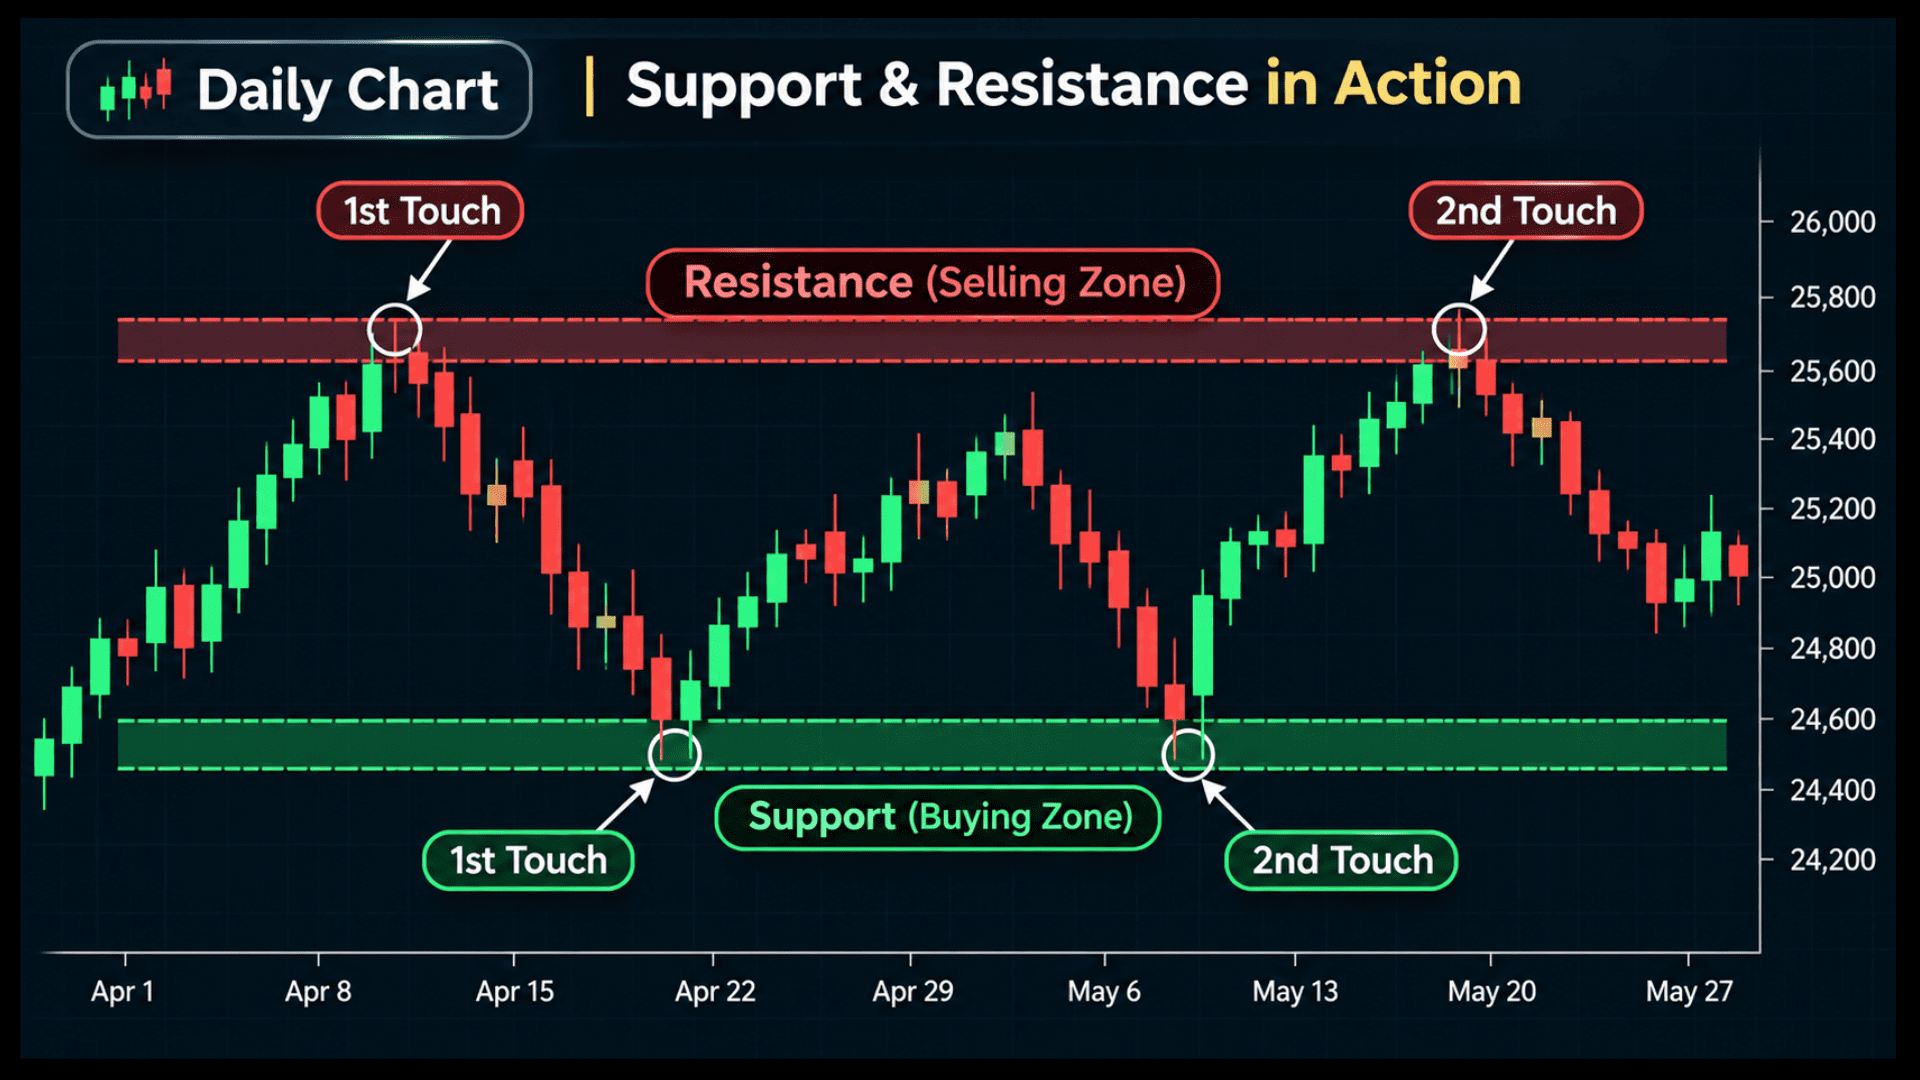
| 8. Find support and resistance | From these daily highs and lows: [paste], list price zones where price turned at least twice. Name the dates for each zone. | Mark the zones yourself. Check every date it quotes exists in your data. |
| 9. Judge a level | Explain how a clean break below support differs from a quick dip through it. List what extra confirmation a learner could watch. Make no predictions. | Ask what would prove this idea wrong. |
| 10. Build a checklist | Create a 10-point checklist for studying a daily chart as a beginner: trend, levels, volume, risk and timing. One line per point. | Delete points you do not understand. |
Be clear about which price you paste. The last traded price and the final close can differ, as this note on LTP vs closing price shows.
Can ChatGPT Review a Trade Journal, Position Size and a Backtest Idea?
Yes, as a thinking partner. These prompts help you spot patterns in your mistakes and check risk maths.
Remove names and account details from anything you paste.
| Goal | Prompt to copy | What to verify afterwards |
|---|---|---|
| 11. Review a trade journal | Here are my last 15 practice trades with entry, exit, stop loss and reason: [paste]. Group the mistakes by type and count each type. | Count them yourself. AI often miscounts rows. |
| 12. Find journal patterns | From the same entries, which setup type hit its stop loss most often? Show counts only, with no advice on what to trade. | Match each count with your sheet. |
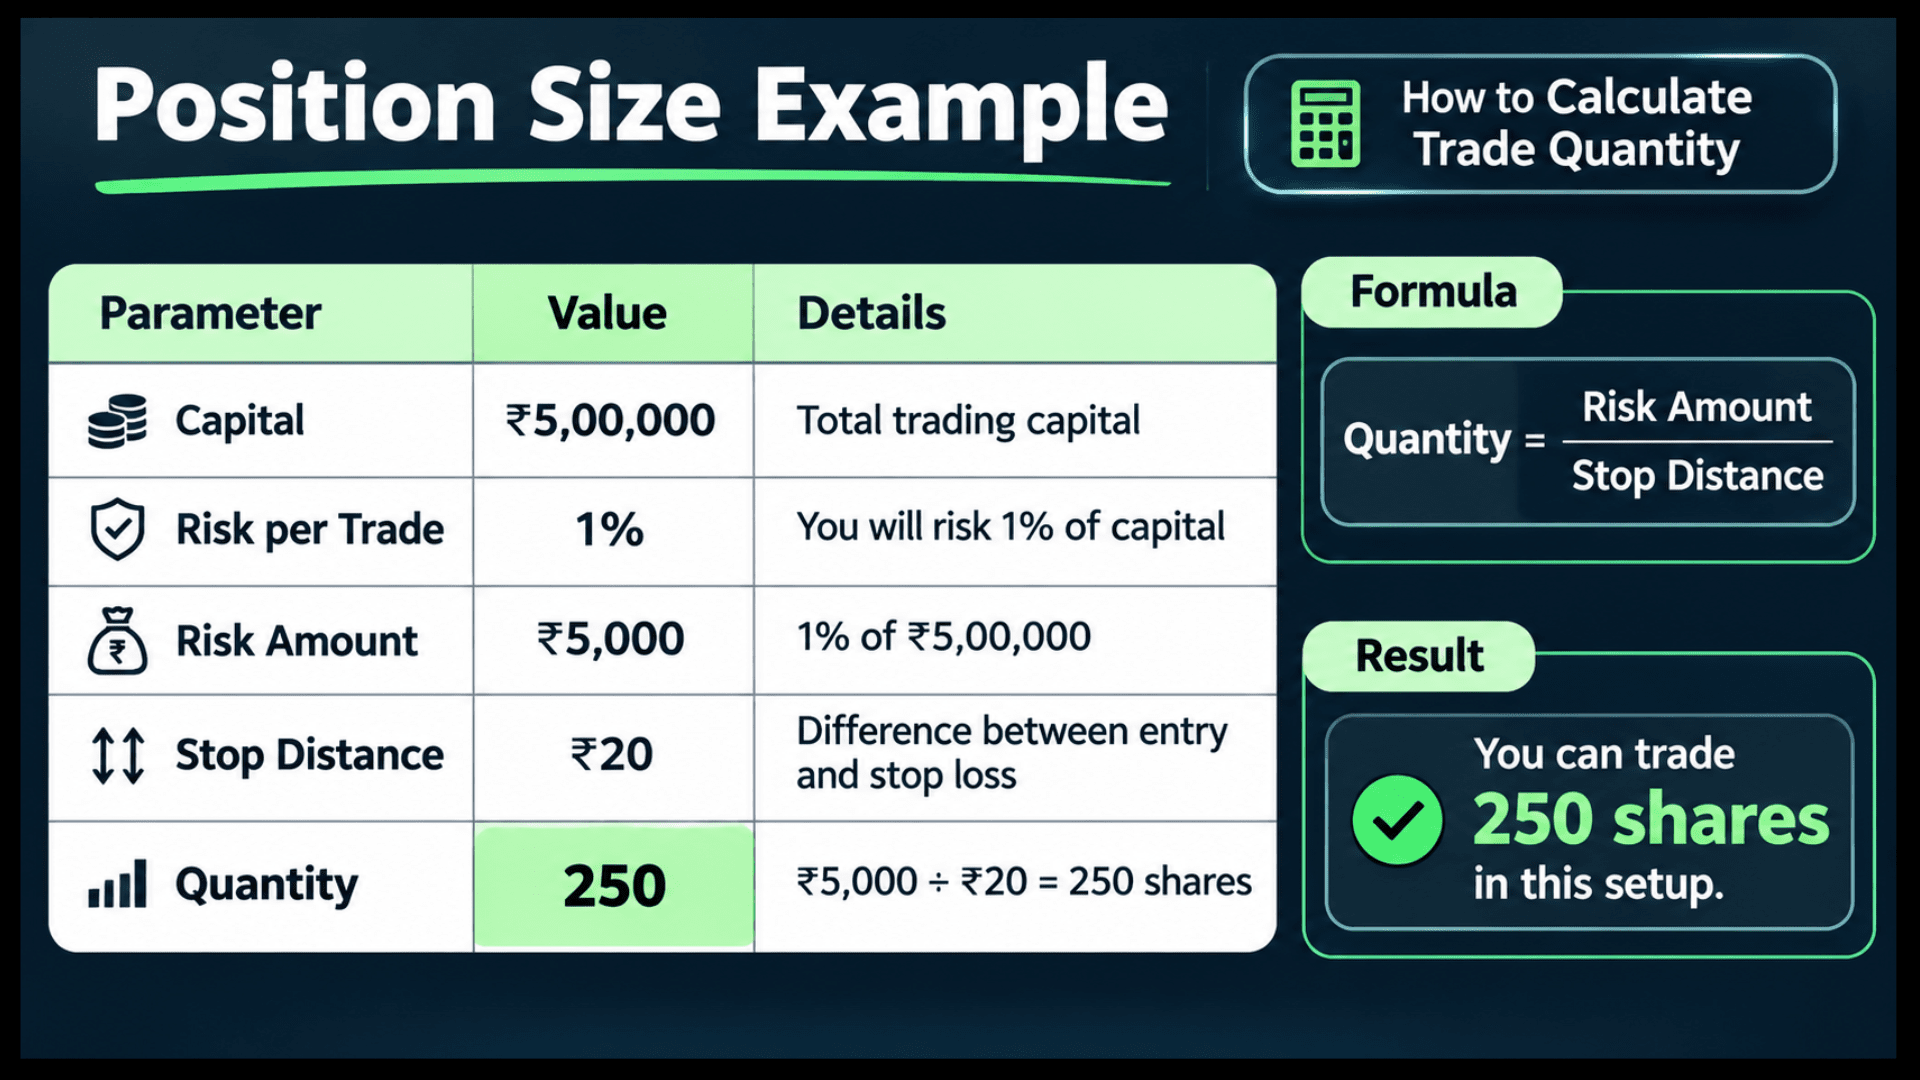
| 13. Calculate position size | Capital Rs 2,00,000. I risk 1% per trade. Entry 250, stop loss 240. Calculate the quantity and show every step. | Redo it by hand. Charges and margin are usually left out. |
| 14. Check risk and reward | Entry 250, stop loss 240, target 270. Calculate the risk-reward ratio and explain what that ratio does not tell me. | Confirm the maths and check the target on the chart. |
| 15. Critique a backtest idea | My rule is: [describe entry, exit and stop]. List the weak points in testing it, such as sample size, bias, costs and market conditions. | Test on your own data. Never trust claimed results. |
Here is the maths behind prompts 13 and 14, for illustration only. With Rs 2,00,000 capital and 1% risk, you accept a maximum loss of Rs 2,000 on one trade.
Entry at 250 and stop loss at 240 means a risk of Rs 10 per share. So the quantity is 2,000 divided by 10, which is 200 shares and a position value of Rs 50,000.
With a target of 270, the reward is Rs 20 per share, so the ratio is 1:2.
Try the 9 EMA strategy as a rule and ask ChatGPT how it could fail. Then check each point on charts.
Can You Trust ChatGPT Answers?
Because ChatGPT predicts words, not market facts. It can sound sure while being wrong, and may invent prices or indicator values.
Run these checks before you trust any answer:
- Recalculate every number with a calculator or spreadsheet.
- Match dates and prices with your own chart or data.
- Confirm definitions in your class notes or a trusted textbook.
- Check exchange rules on the official NSE, BSE or SEBI websites.
Is It Safe to Share Trades With ChatGPT?
Treat the chat window as a public place. Never paste anything that could identify you or reach your money.
Never share:
- Your name, phone number, email or address
- Account numbers, client IDs, passwords or OTPs
- PAN, Aadhaar or any other ID details
- Screenshots that show your balance or holdings
Use labels like “Trade 1” instead. The AI only needs prices and reasons.
Does ChatGPT Give Trading Signals? No, It Gives Education
ChatGPT can teach you what a pattern means, but it cannot know what the market will do next.
Never ask “Should I buy now?” Ask “what could go wrong here?” instead.
AI fits into intraday study too, so learn how to do intraday trading using AI with the same caution.
What Are the Common Mistakes With AI Chart Analysis?
Most mistakes come from trusting the output too fast. Watch out for these:
- Asking for a prediction instead of an explanation
- Pasting too little data and expecting a full analysis
- Never testing the idea on real charts
- Changing the plan every time the AI answers differently
Many learners hunt for a free AI tool for intraday trading in India hoping for shortcuts. Read such pages with care, because nothing removes the need to understand risk.
How Do You Build Real Chart Skill? Practise Beyond the Prompts
Prompts speed up learning, but chart sense comes from looking at many real charts and making small mistakes.
These two steps help you move from copying prompts to reading charts on your own.
Should You Learn Technical Analysis Before Using AI?
Ask yourself first whether this path suits you. This short note, Should I Learn Technical Analysis, can help you decide.
Then practise daily: mark levels, note your reason, and write one lesson in your journal.
Can ChatGPT Label Elliott Waves Correctly?
Even Elliott waves need a trained eye, and a chatbot can label waves wrongly.
You can study these Elliott wave strategies for trading and then test your own labels on charts.
Want to read charts with confidence instead of only copying prompts?
Prompts give you answers, but real charts and a mentor’s feedback build the real skill.
Get personalised mentorship and practise on real charts, with no profit guarantee.
Conclusion
The best ChatGPT prompts for technical analysis give you clearer notes, not tips.
Give a level, a task, your data and a limit, then verify every number.
Protect your personal details and treat each answer as education.
Real skill comes from practising on charts.
Disclaimer: This blog is for education only and is not investment advice. Please verify rules on the official NSE, BSE and SEBI websites.
Frequently Asked Questions
Before investing capital, invest your time in learning Stock Market.
Fill in the basic details below and a callback will be arranged for more information: