



Descending triangle pattern trading starts with a stock that keeps bouncing off the same floor. Each bounce is weaker than the last.
Sellers are getting more aggressive, and buyers are running out of patience.
That is the descending triangle. It is one of the clearest bearish warning shapes on a chart.
This guide shows how to spot it, how to plan a trade around it, and how to handle it in the Indian market, where short selling has its own rules.
What Is a Descending Triangle Pattern?
A descending triangle has two lines. The bottom line is flat support, and the top line slopes down through lower highs.
Price squeezes between them. Buyers defend one price level while sellers push the highs lower each time.
Most traders treat it as a bearish continuation pattern, much like a flag and pennant pattern. It usually forms inside a downtrend and often ends with a break below support.
Classical vs. Elliott Wave Descending Triangle Pattern: What’s the Difference?
This is a common source of confusion. The same name appears in two different frameworks.
Here is how they differ
| Feature | Classical descending triangle | Elliott wave descending triangle |
|---|---|---|
| Purpose | A tradable chart pattern | A corrective wave structure |
| Structure | Flat support, falling highs | Five overlapping sub-waves, labelled A to E |
| How you use it | Trade the breakdown with a measured target | Count waves to judge where the correction ends |
| Where to learn | This guide | Our separate Elliott wave post |
This post covers the classical pattern. If you are counting waves, use our guide on the descending triangle pattern elliott wave.
How Does the Descending Triangle Chart Pattern Form?
Every stage of the pattern shows sellers slowly gaining control. The next two sections break down the formation step by step.
They also explain what the shape says about the fight between buyers and sellers.
What Are the Stages of a Descending Triangle?
Each stage shows sellers gaining control. Watch how the highs behave.
- Price falls and finds support at a level.
- Buyers push it up to a pullback high.
- Sellers step in sooner, and the next high is lower.
- Price tests the same support again.
- This repeats until price breaks below the flat line.
You need at least two touches on support and two on the falling line.
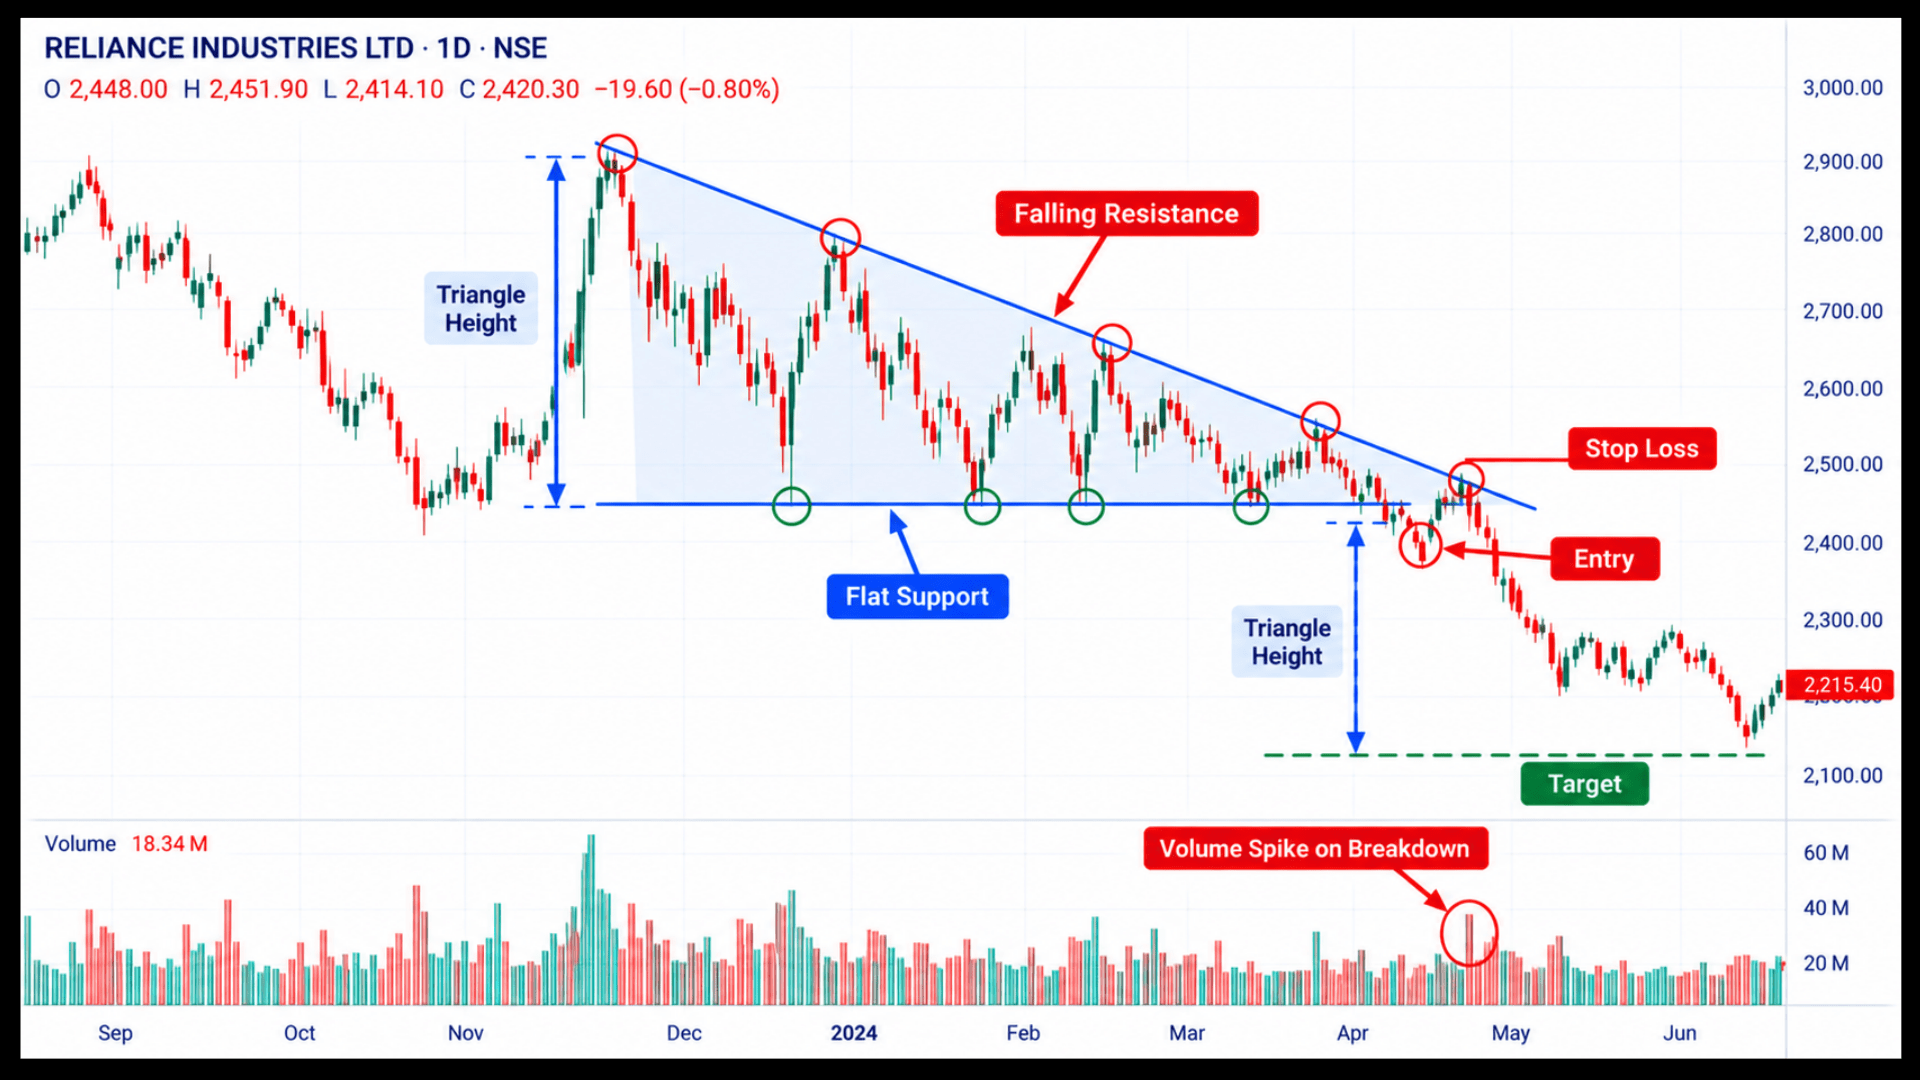
Volume usually shrinks as the triangle tightens. It should expand when price breaks down.
What the Descending Triangle Pattern Tells Us About Buyers and Sellers?
The shape is a record of a small battle. Reading it as a story helps you trust the pattern.
Buyers keep placing orders at one price. They defend the same floor each time. That is the flat line.
Sellers keep accepting a lower price each time. They do not wait for a bigger bounce. That is the falling line.
Eventually the buyers at the floor run out of capital or patience. Sellers absorb the last bids, and price breaks down. That is why the drop can feel sudden.
How to Identify a Descending Triangle Pattern Without Forcing It
Do not force the shape. A valid triangle meets clear rules.
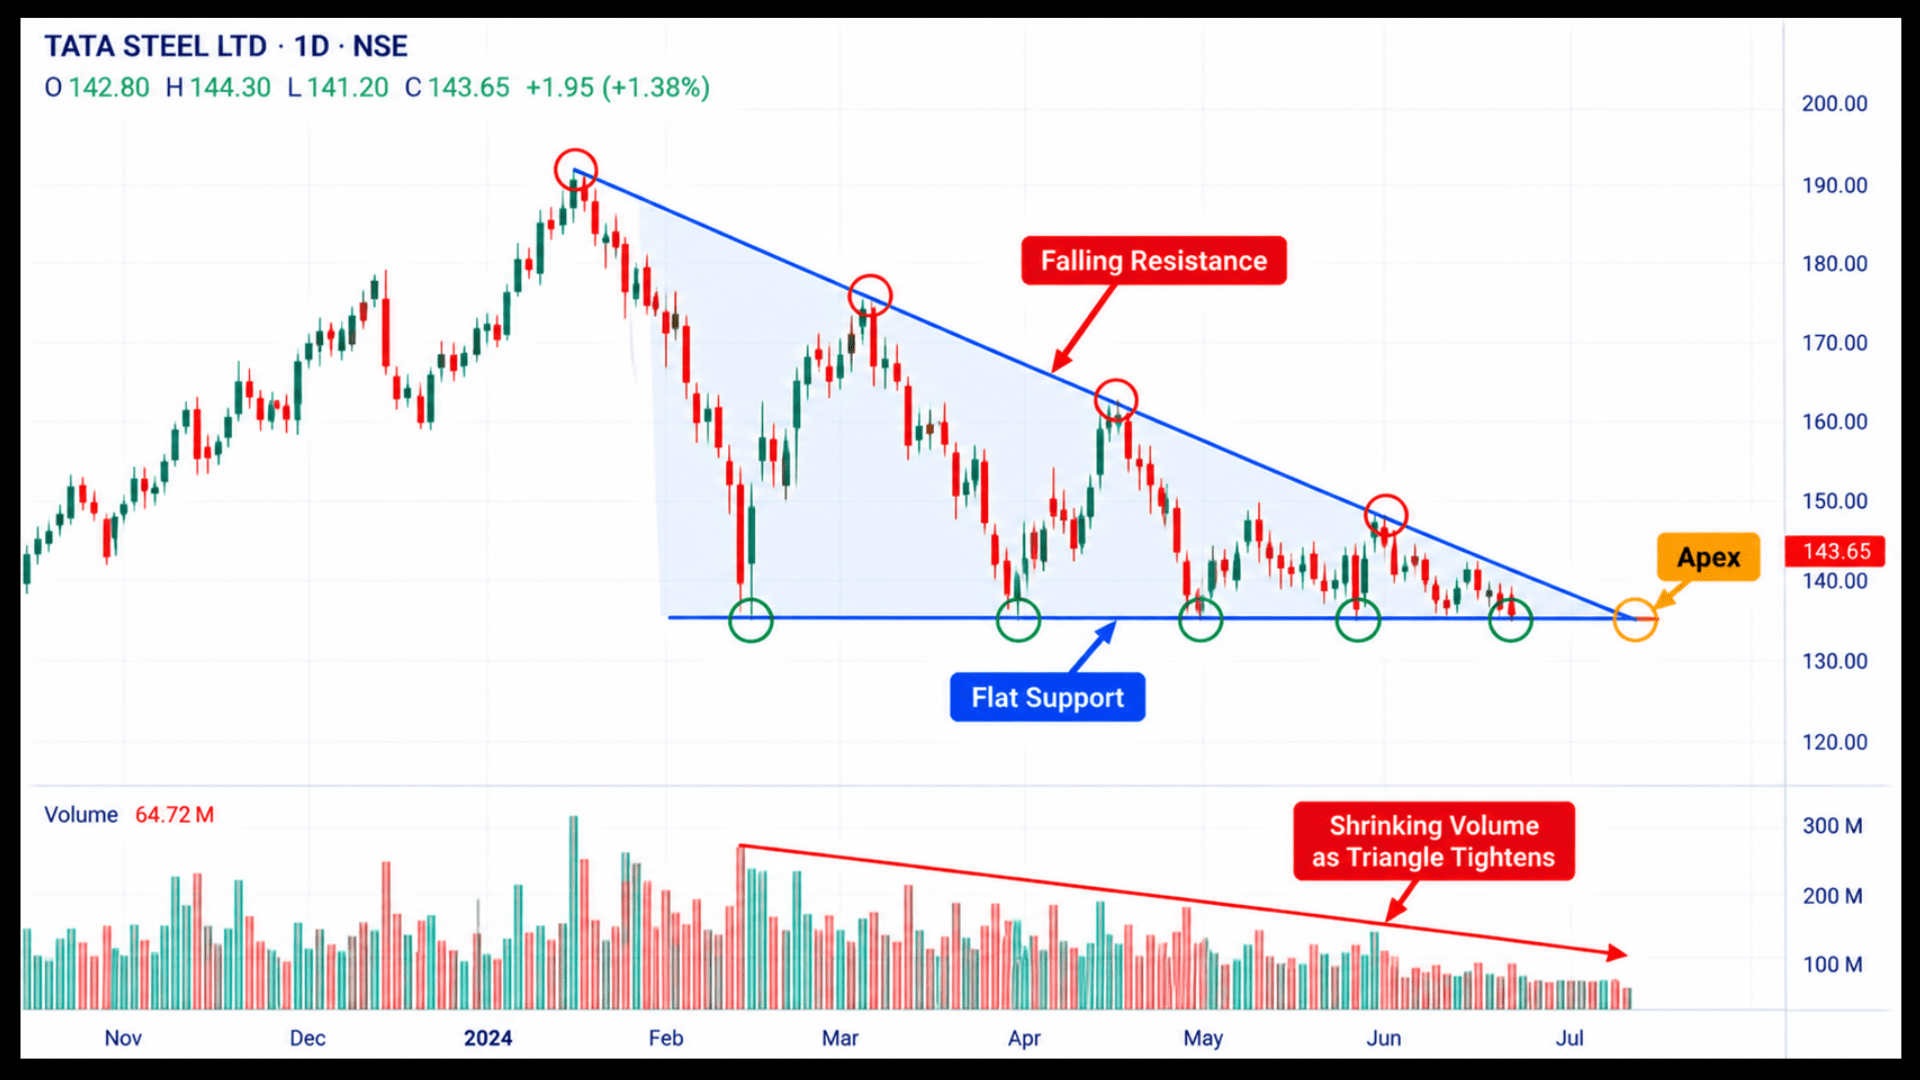
Two touches on one floor can also look like a double top and double bottom pattern, so always check that the highs are falling.
Use this checklist.
- The bottom line is flat, or very close to flat.
- The highs fall in a clean sequence.
- At least two touches sit on each line.
- The pattern lasts several weeks, not just a few days.
- Volume contracts inside the triangle.
How to Trade a Descending Triangle Breakdown: Entry, Stop Loss and Target
Plan three levels before the breakdown. That keeps emotion out of descending triangle pattern trading.
Here is a simple rule set for a breakdown.
- Entry: sell when a candle closes below the flat support, ideally on rising volume. A safer option is a retest of the broken support from below.
- Stop loss: place it above the most recent lower high, or just above the broken support after a retest.
- Target: measure the height at the widest part of the triangle. Subtract that distance from the breakdown point.
Compare this with the bullish version in our guide on ascending triangle pattern trading.
Descending Triangle Pattern Trading in India: Rules for Shorting
Short selling works differently in India, so the instrument you choose matters as much as the entry.
The first part below covers which instruments suit a bearish view. The second walks through a worked example with real numbers.
How Do You Take a Bearish View Within Indian Market Rules?
In the Indian cash market you cannot carry a short position overnight. A multi-day breakdown trade needs futures or put options.
Many traders use the pattern differently. They exit existing long positions when support breaks, or they avoid new longs in the stock.
Worked Example: A Descending Triangle Breakdown
These figures are illustrative and are not a recommendation.
A stock finds support at ₹400 three times. Its highs fall from ₹460 to ₹440 to ₹425. The triangle is ₹60 tall at its widest point.
Price closes at ₹394 on strong volume. You take a bearish position through a put option or futures at about ₹393.
Your stop goes above the last lower high at ₹426. Risk is ₹33 per share.
The target is ₹393 minus ₹60, or ₹333. That is ₹60 of reward, around 1.8 times your risk.
Why Do Descending Triangles Fail, and How Can You Spot It Early?
Not every descending triangle breaks down. Some turn into bullish reversals, much like a falling wedge pattern does. Others break and fail.
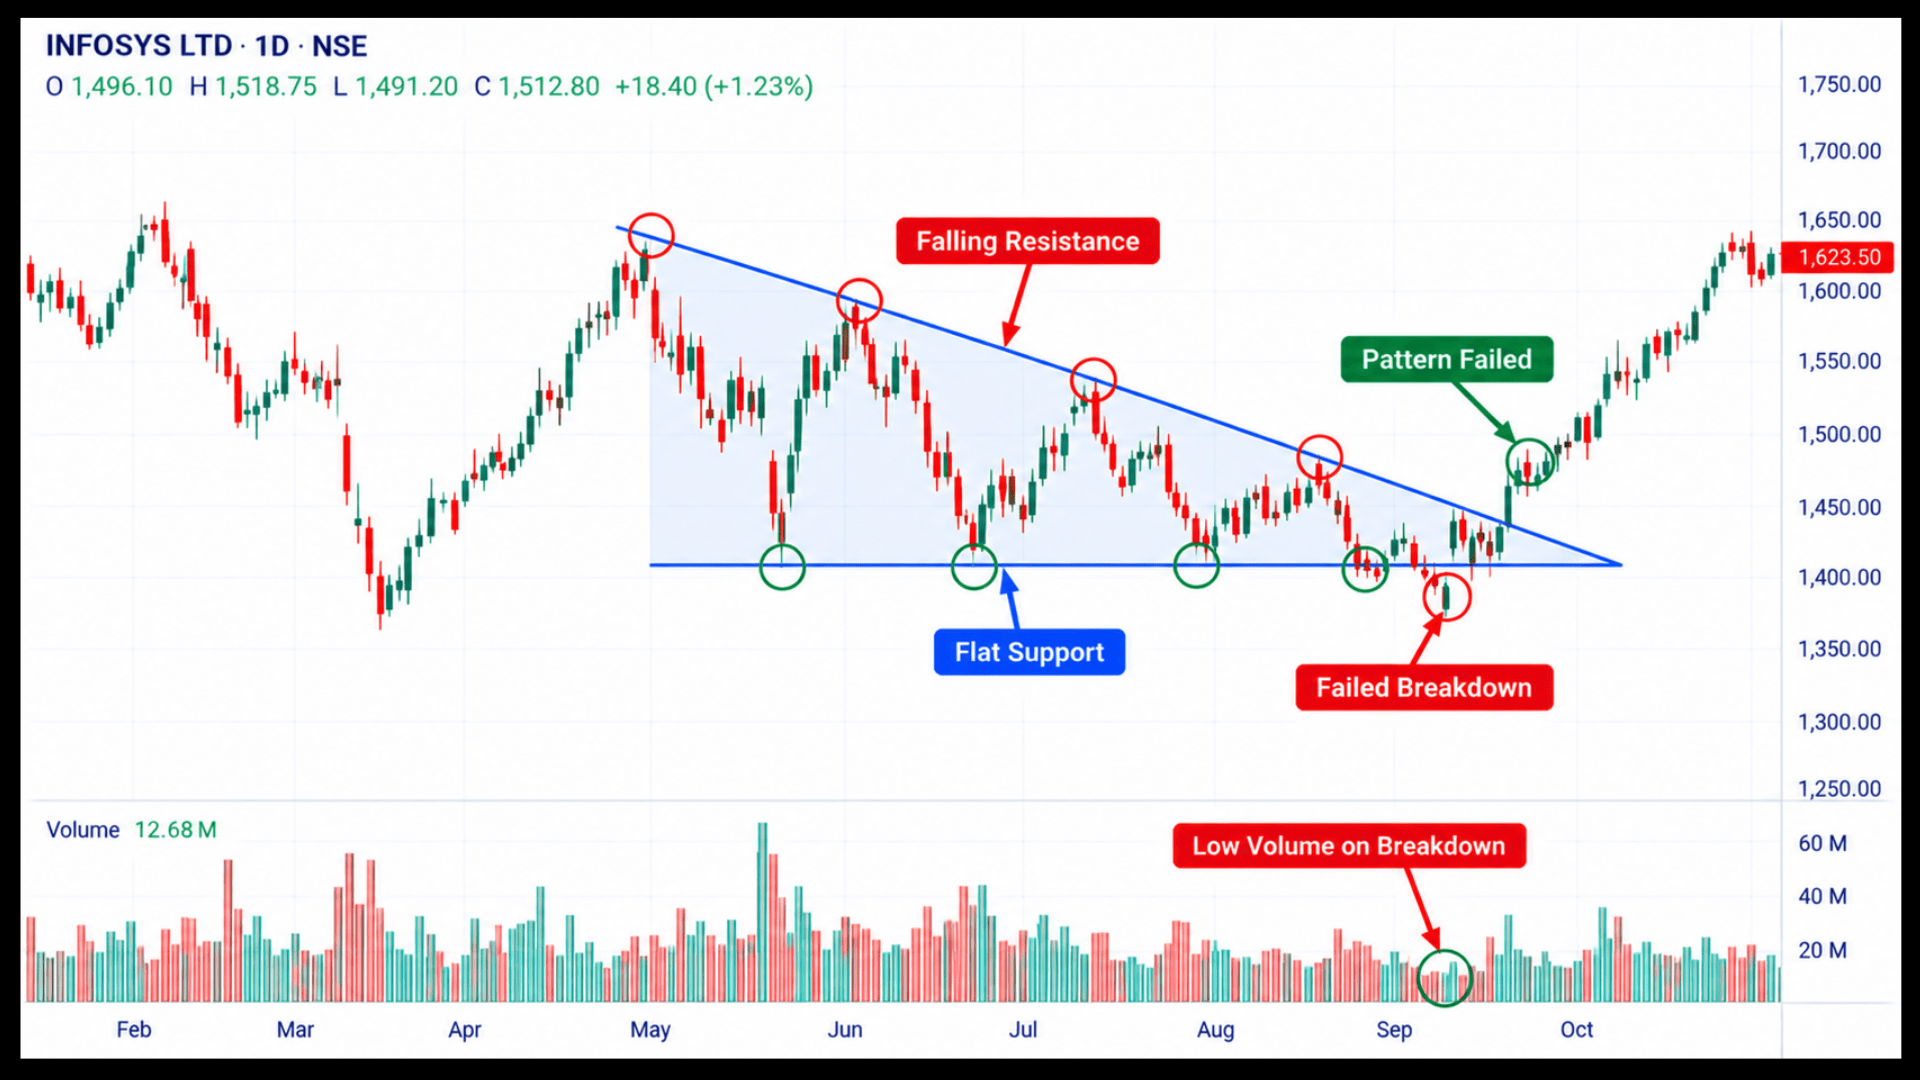
Good descending triangle pattern trading plans for both outcomes.
Watch for these warning signs:
- Price breaks upward through the falling line on strong volume. The pattern has flipped.
- The breakdown candle closes back above support within a few sessions.
- The breakdown comes on thin volume.
- The broader market is rising strongly and lifts the stock.
How Does the Descending Triangle Compare With Other Triangles?
Triangles come in three common shapes. The slope of each line tells you which one you have.
The descending triangle has flat support and falling resistance. A third version has both lines sloping in toward each other. Read about it in our guide on symmetrical triangle pattern trading.
Want to Trade Triangles With Live Guidance?
Spotting a triangle on a finished chart is easy. Handling the breakdown in real time is the harder skill.
Our online echnical analysis classes India teach this live, on real Indian stocks.
Conclusion
The descending triangle shows sellers gaining ground while buyers defend one flat line. That balance often tips in favour of the sellers. Wait for a close below support, confirm it with volume, and place your stop above the last lower high. Measure the triangle height for a target. If price breaks upward instead, accept it and move on. In India, a multi-day bearish trade needs futures or put options, so plan the instrument before you plan the entry. That discipline matters more than the pattern itself.
Frequently Asked Questions
Before investing capital, invest your time in learning Stock Market.
Fill in the basic details below and a callback will be arranged for more information: