



Symmetrical triangle pattern trading starts when the market simply cannot decide. Buyers pay a little more each time. Sellers accept a little less each time.
The range shrinks until something gives. That coiling shape is the symmetrical triangle.
This guide shows how to trade the breakout and how to avoid guessing the direction too early.
What Is Symmetrical Triangle Pattern Trading?
A symmetrical triangle has two converging lines. The top line slopes down through lower highs. The bottom line slopes up through higher lows.
Neither side is winning. Price compresses toward a point called the apex.
The pattern is neutral until price breaks one of the lines. Most triangles break in the direction of the trend that came before. That is a tendency, not a rule.
Difference Between Symmetrical, Ascending, and Descending Triangles?
Three triangles look alike at first glance, and mixing them up leads to wrong trades. The table below separates them by the slope of each line.
The slope of each line decides which triangle you have. A flat bottom with a falling top gives the descending triangle pattern.
Here is a quick comparison.
| Feature | Symmetrical | Ascending | Descending |
|---|---|---|---|
| Top line | Falls | Flat | Falls |
| Bottom line | Rises | Rises | Flat |
| Bias | Neutral, follows prior trend | Bullish | Bearish |
| Breakout direction | Either way | Usually up | Usually down |
The flat-topped version is covered in our guide on ascending triangle pattern trading.
How Does a Symmetrical Triangle Pattern Form? Every Step Explained
The pattern builds through shrinking swings. Each swing is smaller than the one before.
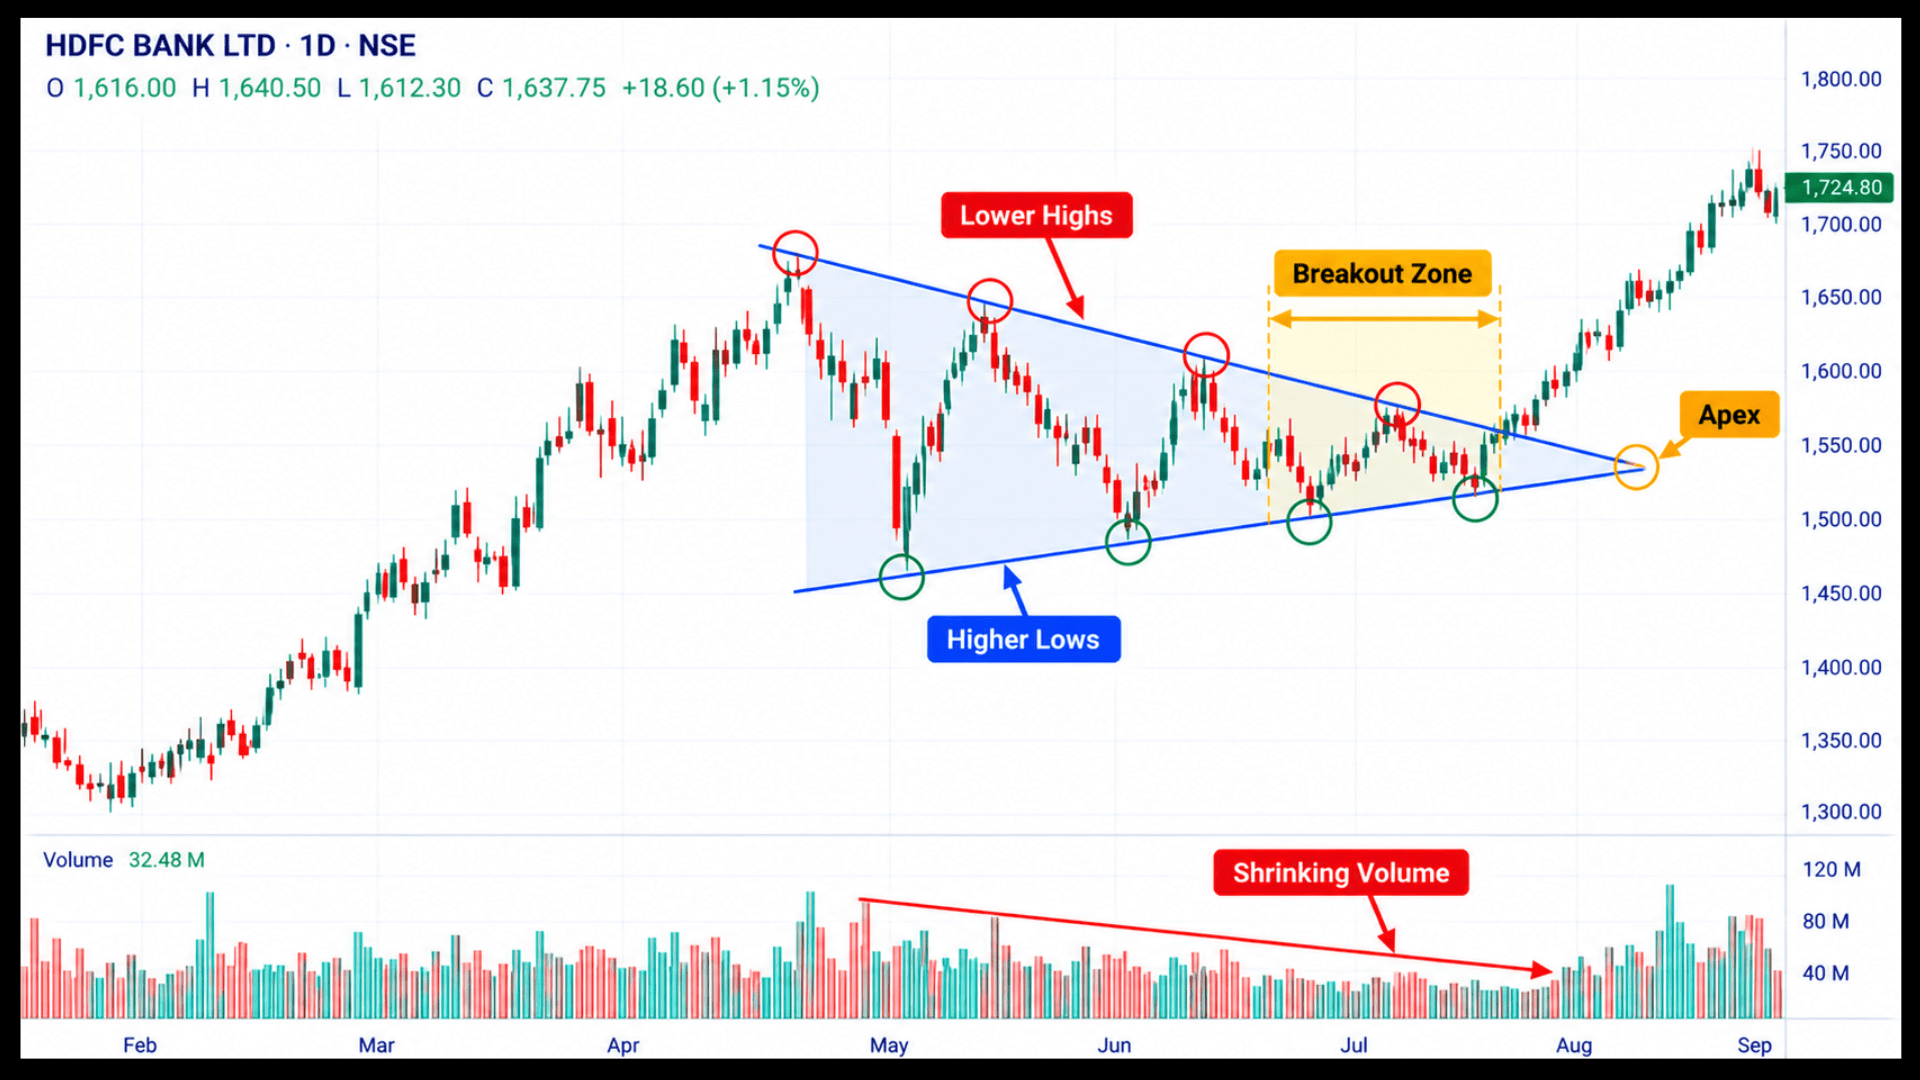
Here are the stages:
- Price moves in a trend and then stalls.
- A pullback creates a lower high.
- The next dip stops at a higher low.
- Swings keep tightening between the two lines.
- Price breaks out through one line.
You need at least two touches on each line. Volume should shrink as the triangle tightens, then expand on the break.
Why Symmetrical Triangle Pattern Trading Requires Waiting for the Breakout?
Many traders try to predict the break. That is a coin flip dressed up as analysis. Wait for price to choose.
Trade the confirmed break, not the shape. That is the core rule of symmetrical triangle pattern trading. Waiting costs you a small part of the move. It saves you from the many triangles that break the wrong way.
For a sense of how Elliott traders treat triangle shapes differently, see our post on the elliott wave triangle pattern. That is a wave-counting framework, not the classical pattern covered here.
How to Confirm Symmetrical Triangle Pattern Trading Breakouts?
Confirmation filters out false moves. Without it, you are acting on a hope.
The checklist below is what you should tick off before putting money in:
The Steps That Confirm a Real Breakout
Use these checks before you enter.
- A candle closes beyond the trendline. A wick through the line does not count.
- Volume rises well above the recent average.
- The break happens roughly two-thirds to three-quarters of the way toward the apex.
- The break matches the larger trend, or at least does not fight it.
- Price holds beyond the line on the next session, or after a retest.
Breaks very close to the apex lose force. Price has run out of room to build momentum.
Symmetrical Triangle Pattern Trading: Entry, Stop Loss and Target
Plan three levels before the break. That keeps you disciplined when price moves fast.
Here is a simple rule set for an upside break. Flip it for a downside break.
- Entry: buy when a candle closes above the upper line on rising volume, or on a retest.
- Stop loss: place it below the last higher low, or just under the broken line after a retest.
- Target: measure the height at the widest part of the triangle. Add that distance to the breakout point.
A downside break needs futures or put options for a multi-day trade, because the Indian cash market does not allow overnight shorts.
Symmetrical Triangle Pattern Trading Example: What to Look For?
Rules are easier to trust when you see the numbers.
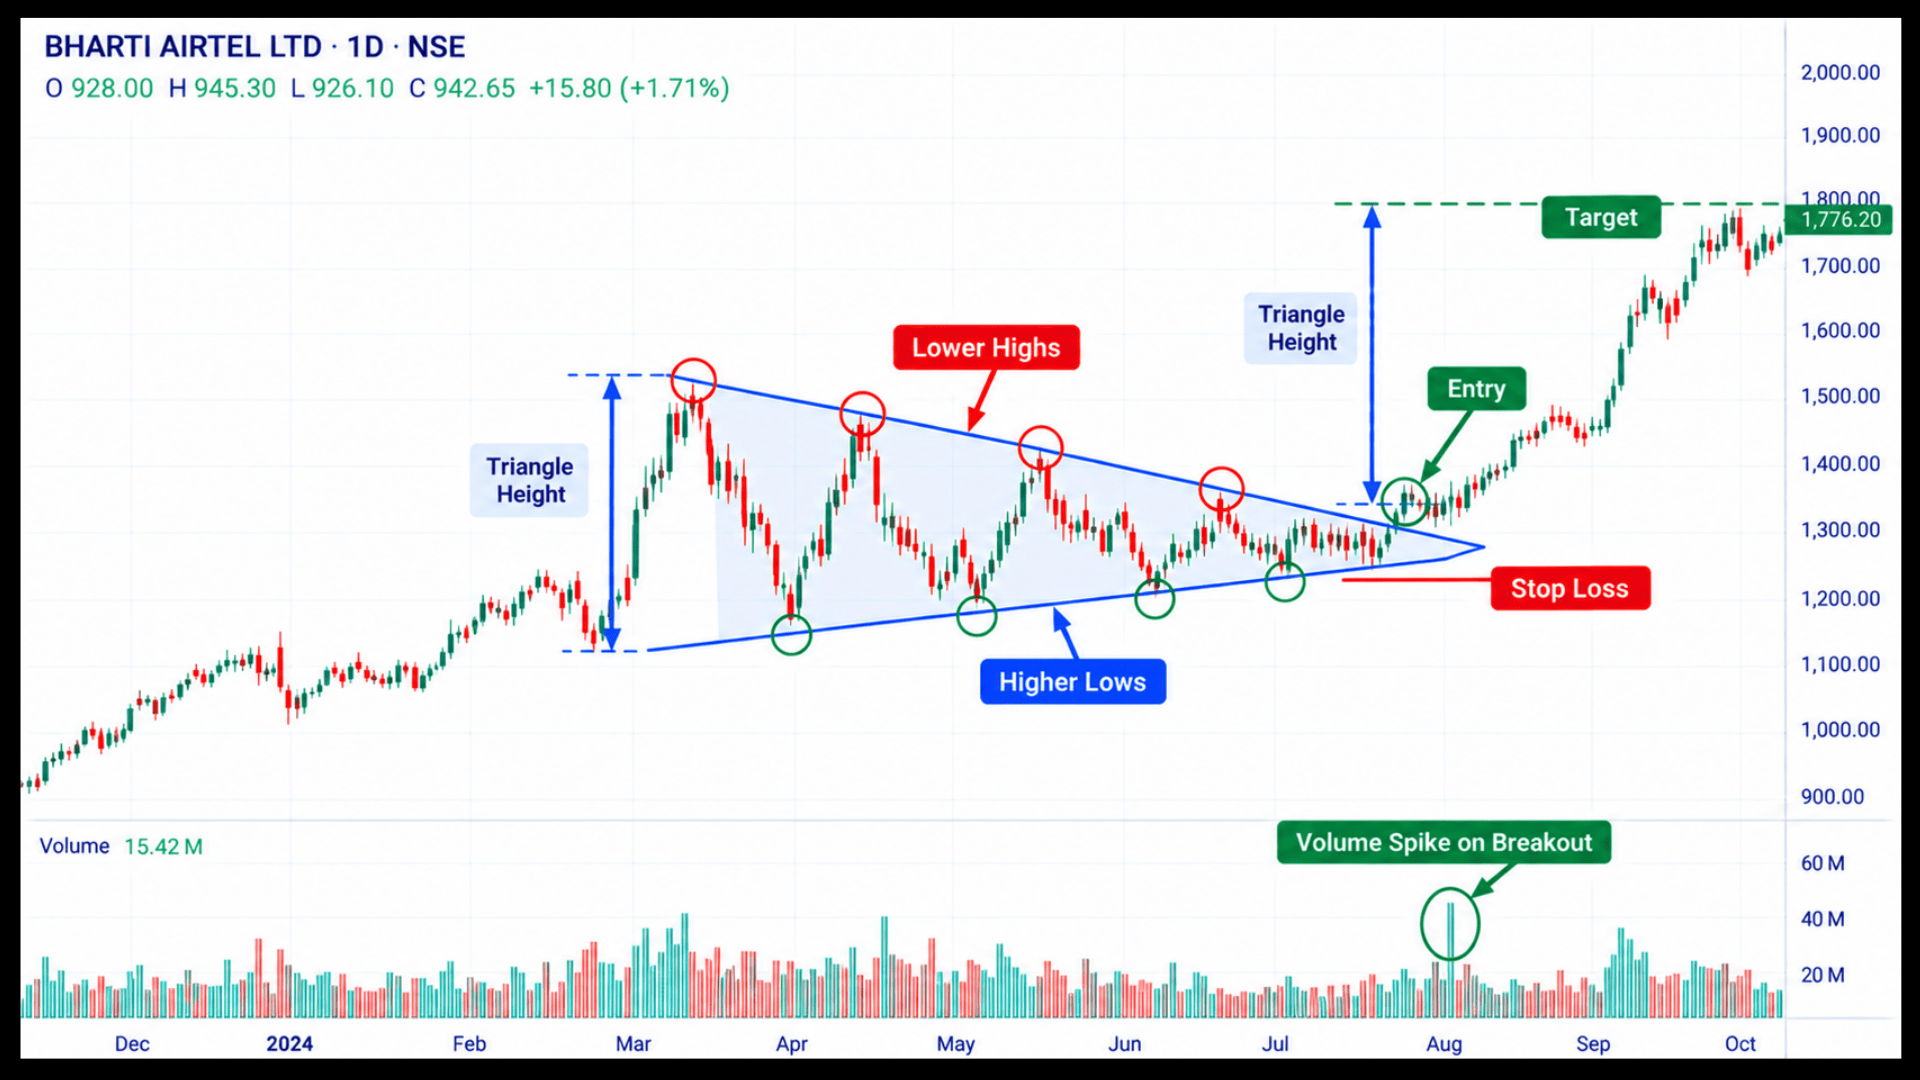
The example below shows symmetrical triangle pattern trading applied to one trade, using the entry, stop loss and target from above.
These figures are illustrative and are not a recommendation.
A stock in an uptrend coils for ten weeks. Its highs fall from ₹850 to ₹820. Its lows rise from ₹760 to ₹790. The triangle is ₹90 tall at its widest point.
Price closes at ₹824 above the upper line on strong volume. You buy at ₹825.
Your stop goes at ₹788, below the last higher low. Risk is ₹37 per share.
The target is ₹825 plus ₹90, or ₹915. That is ₹90 of reward, around 2.4 times your risk.
Which Timeframe Works Best for Symmetrical Triangles?
Triangles show up on every timeframe. Their reliability changes, though.
Daily and weekly charts give the cleanest shapes. Each candle carries more volume and more traders, so the lines mean more.
Intraday charts show many small triangles. Most of them fail. If you trade short timeframes, use the daily triangle as your guide and treat intraday shapes with care.
A longer triangle also tends to lead to a bigger move. That is a tendency, not a rule.
Short, sharp pauses inside a trend are a different shape, and the flag and pennant pattern strategy covers them.
What to Do While a Symmetrical Triangle Pattern Forms?
Most of the work happens before the break. Use the quiet weeks well.
Mark both trendlines and update them as new touches appear. Set an alert just beyond each line.
Decide your stop loss and position size now, while price is calm.
Then wait. If neither line breaks, you have no trade. That is a fine result.
Why Do Symmetrical Triangle Breakouts Fail?
False breakouts are common in triangles. Price pokes through a line, pulls everyone in, then reverses.
Spotting the failure early saves capital. The signs below are the ones to watch.
What Are the Warning Signs of a False Breakout?
Watch for these warning signs:
- The breakout candle shows weak volume.
- Price closes back inside the triangle within a few sessions.
- The break comes very late, near the apex.
- The break fights the larger trend with no clear reason.
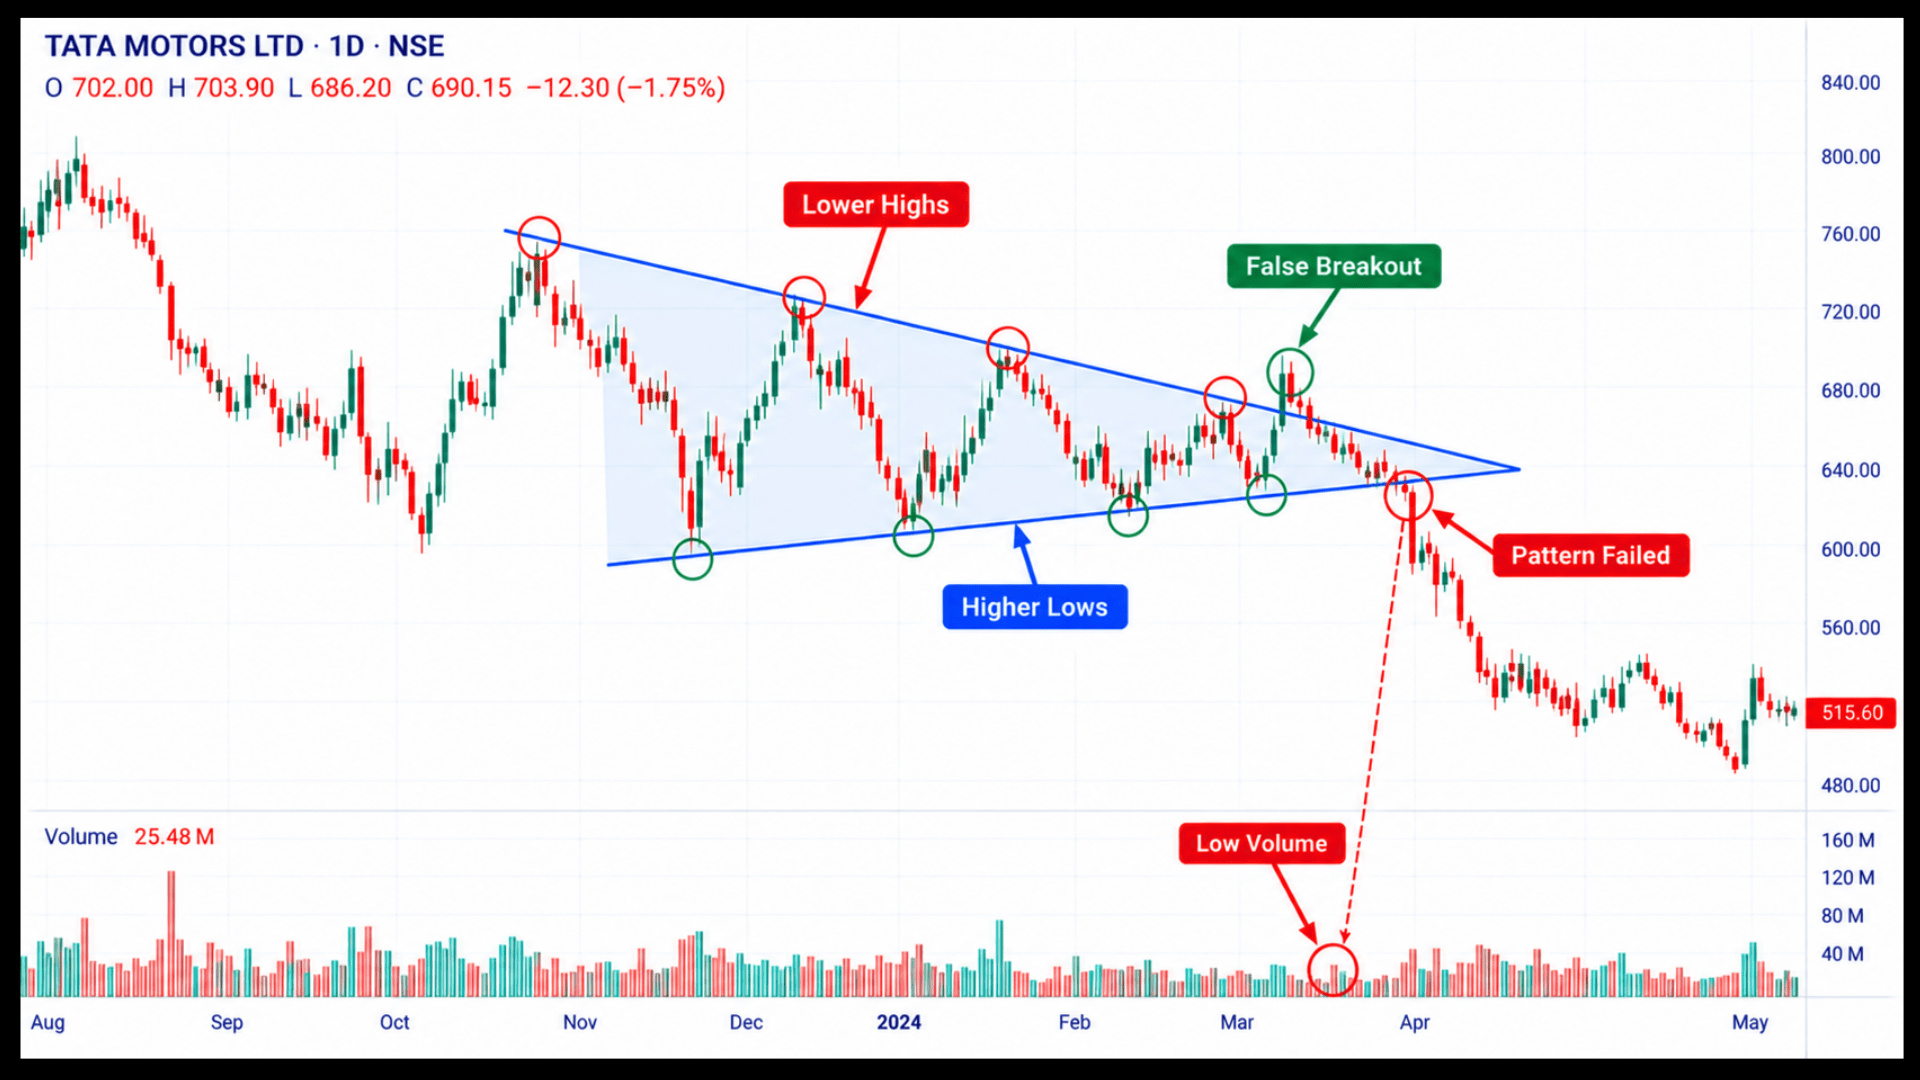
When a failed break turns into a full reversal, the double top and double bottom pattern strategy helps you read what comes next.
How Does Symmetrical Triangle Pattern Trading Fit Into Your Chart Analysis?
Triangles are part of a family of consolidation patterns. Flags, wedges and rectangles all pause a trend in different ways.
A wedge also converges, but both lines slope the same way. Compare it in our guide on wedge pattern trading strategy.
Want to Trade Breakouts With Live Guidance?
Drawing a triangle after the breakout is easy. Waiting for confirmation while price is still coiling is the real skill.
Our technical analysis classes teach this live, on real Indian stocks.
Conclusion
A symmetrical triangle shows a market coiling before a move. The shrinking swings tell you pressure is building, but not which way it will release.
Mark both lines early, set alerts, and size your position before price moves.
Wait for a close beyond a line, confirm with volume, and place your stop on the other side of the last swing. Measure the widest part for a target. Treat very late breaks with caution.
The edge here is patience, because traders who wait for confirmation avoid most false moves.
Frequently Asked Questions
Before investing capital, invest your time in learning Stock Market.
Fill in the basic details below and a callback will be arranged for more information: