


A wedge pattern trading strategy helps you spot a trend that is losing power. Each new high is smaller than the last, and the range tightens.
Price is still moving, but with less force behind it. That is the moment a wedge forms, so you can trade what comes next.
This guide covers rising and falling wedges, how to confirm a breakout, and how to plan your stop loss and target.
What Is a Wedge Pattern Trading Strategy?
A wedge forms when price moves between two trendlines that slope the same way and squeeze together. As a result, the range narrows over time.
In a rising wedge, both lines slope up, but the lower line is steeper. In a falling wedge, both lines slope down, but the upper line is steeper.
Wedges show fading momentum. Price makes progress, but each push is weaker than the one before.
They often mark the end of a move, much like the reversals in our double top and double bottom pattern guide.
Rising vs. Falling Wedge Pattern: Differences & Trading Strategy
While both patterns feature converging trendlines that indicate fading market momentum, a rising wedge slopes upward to signal a potential bearish breakdown at the end of an uptrend.
In contrast, a falling wedge slopes downward to signal a bullish breakout as selling pressure wanes near the end of a downtrend.
Our guide on the descending triangle pattern trading explores how converging trendlines develop similar compression mechanics in different market contexts.
Here is a quick comparison of the two shapes:
| Feature | Rising wedge | Falling wedge |
|---|---|---|
| Line slope | Both rise, converging | Both fall, converging |
| Usual signal | Bearish | Bullish |
| Typical location | End of an uptrend | End of a downtrend |
| Breakout direction | Down through the lower line | Up through the upper line |
| Volume inside | Tends to shrink | Tends to shrink |
Why the Rising Wedge Pattern Traps Traders?
A rising wedge looks bullish at first. Price keeps making higher highs and higher lows. That is why it traps so many buyers.
However, the warning is in the squeeze. The lows rise faster than the highs, so the range narrows. As a result, buyers push less each time.
Look for these traits:
- At least two touches on each trendline.
- Both lines slope up, and they converge.
- Volume fades as the wedge matures.
- Momentum indicators make lower highs while price makes higher highs.
The last point is divergence. For example, our post on swing trading strategy using rsi shows how to read it.
How to Trade the Falling Wedge: Spotting Sellers Losing Steam
A falling wedge is the mirror image. Price keeps making lower lows and lower highs. Because it looks weak, sellers feel confident.
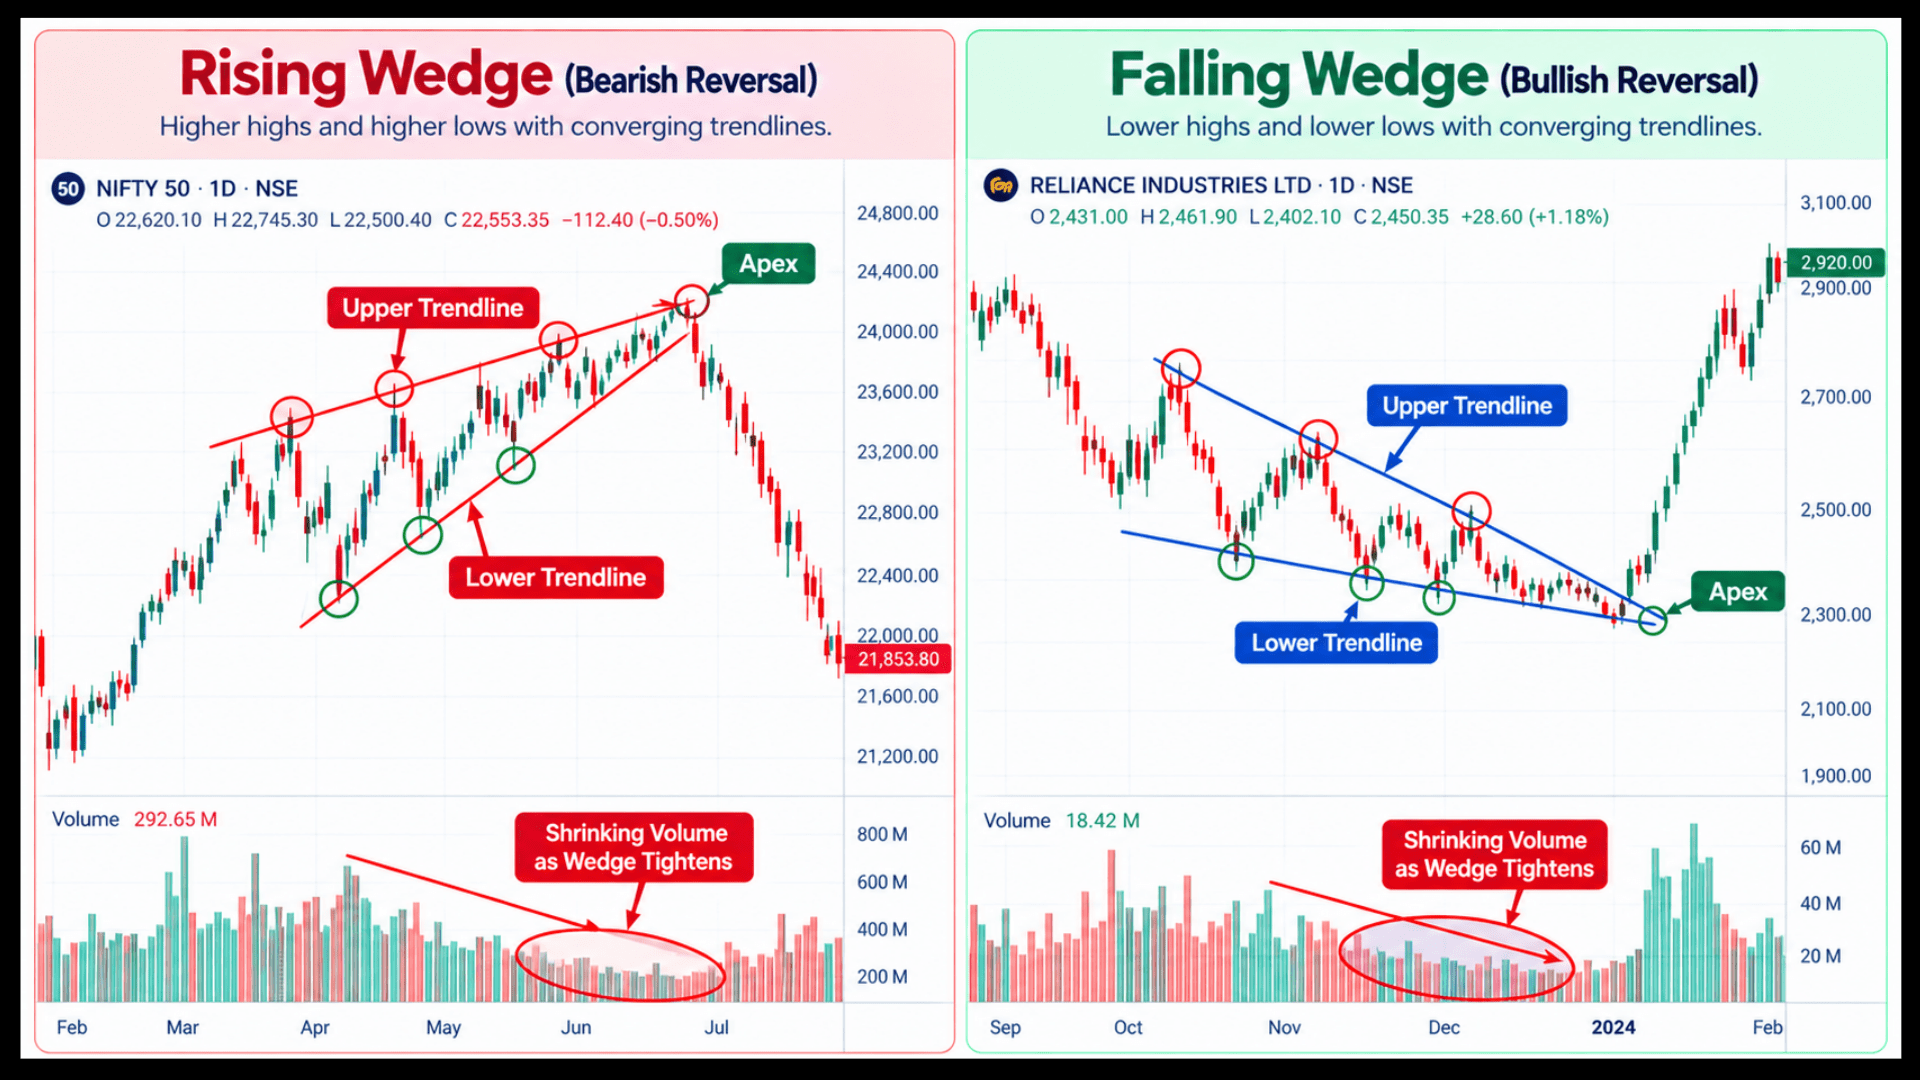
The highs fall faster than the lows. As a result, selling pressure fades with each push. Eventually, sellers run out of steam.
Look for these traits:
- At least two touches on each trendline.
- Both lines slope down, and they converge.
- Volume dries up near the apex.
- Price breaks out upward, ideally on rising volume.
Clean trendlines make wedges easier to see.
Wedge vs Flag Chart Patterns: Spotting the Differences
Wedges and flags look alike, so traders mix them up. The slope of the lines is the giveaway.
A flag has parallel lines, while a wedge has converging lines.
In a similar fashion, when price consolidates sideways between horizontal support and resistance levels without converging or sloping, it forms a rectangle pattern trading strategy, highlighting a temporary pause before the next major breakout.
To explore how these multi-line shapes differ further, our guide on the ascending triangle pattern strategy explains the distinct horizontal and sloping boundaries used in continuation setups.
Also, a flag tilts against the trend and continues it. In contrast, a wedge slopes with the trend and often ends it.
Our guide on flag and pennant pattern strategy shows the flag side of this comparison. Likewise, a triangle has converging lines, but one line is usually flat or the slopes point in opposite directions.
How to Use a Wedge Pattern Trading Strategy: Entry, Stop Loss and Target
Wait for the break. A wedge is a warning, not a signal, so any wedge pattern trading strategy needs patience. Price can stay inside it for weeks.
Next, you get a simple rule set for entry, stop loss and target. After that, a worked example shows the numbers in action.
Wedge Pattern Trading Strategy Rules for a Falling Wedge
Here is a simple rule set for a falling wedge. Flip it for a rising wedge.
- Entry: buy when a candle closes above the upper trendline, ideally on rising volume.
- Stop loss: place it below the most recent swing low inside the wedge.
- Target: measure the widest part of the wedge. Add that distance to the breakout point.
A rising wedge breaks down. However, in the Indian cash market you cannot carry a short overnight.
Instead, use futures or put options, or simply exit longs. Our post on Best Swing Trading Strategies in a Bear Market explains the rule.
Wedge Pattern Trading Strategy Example
These figures are illustrative and are not a recommendation.
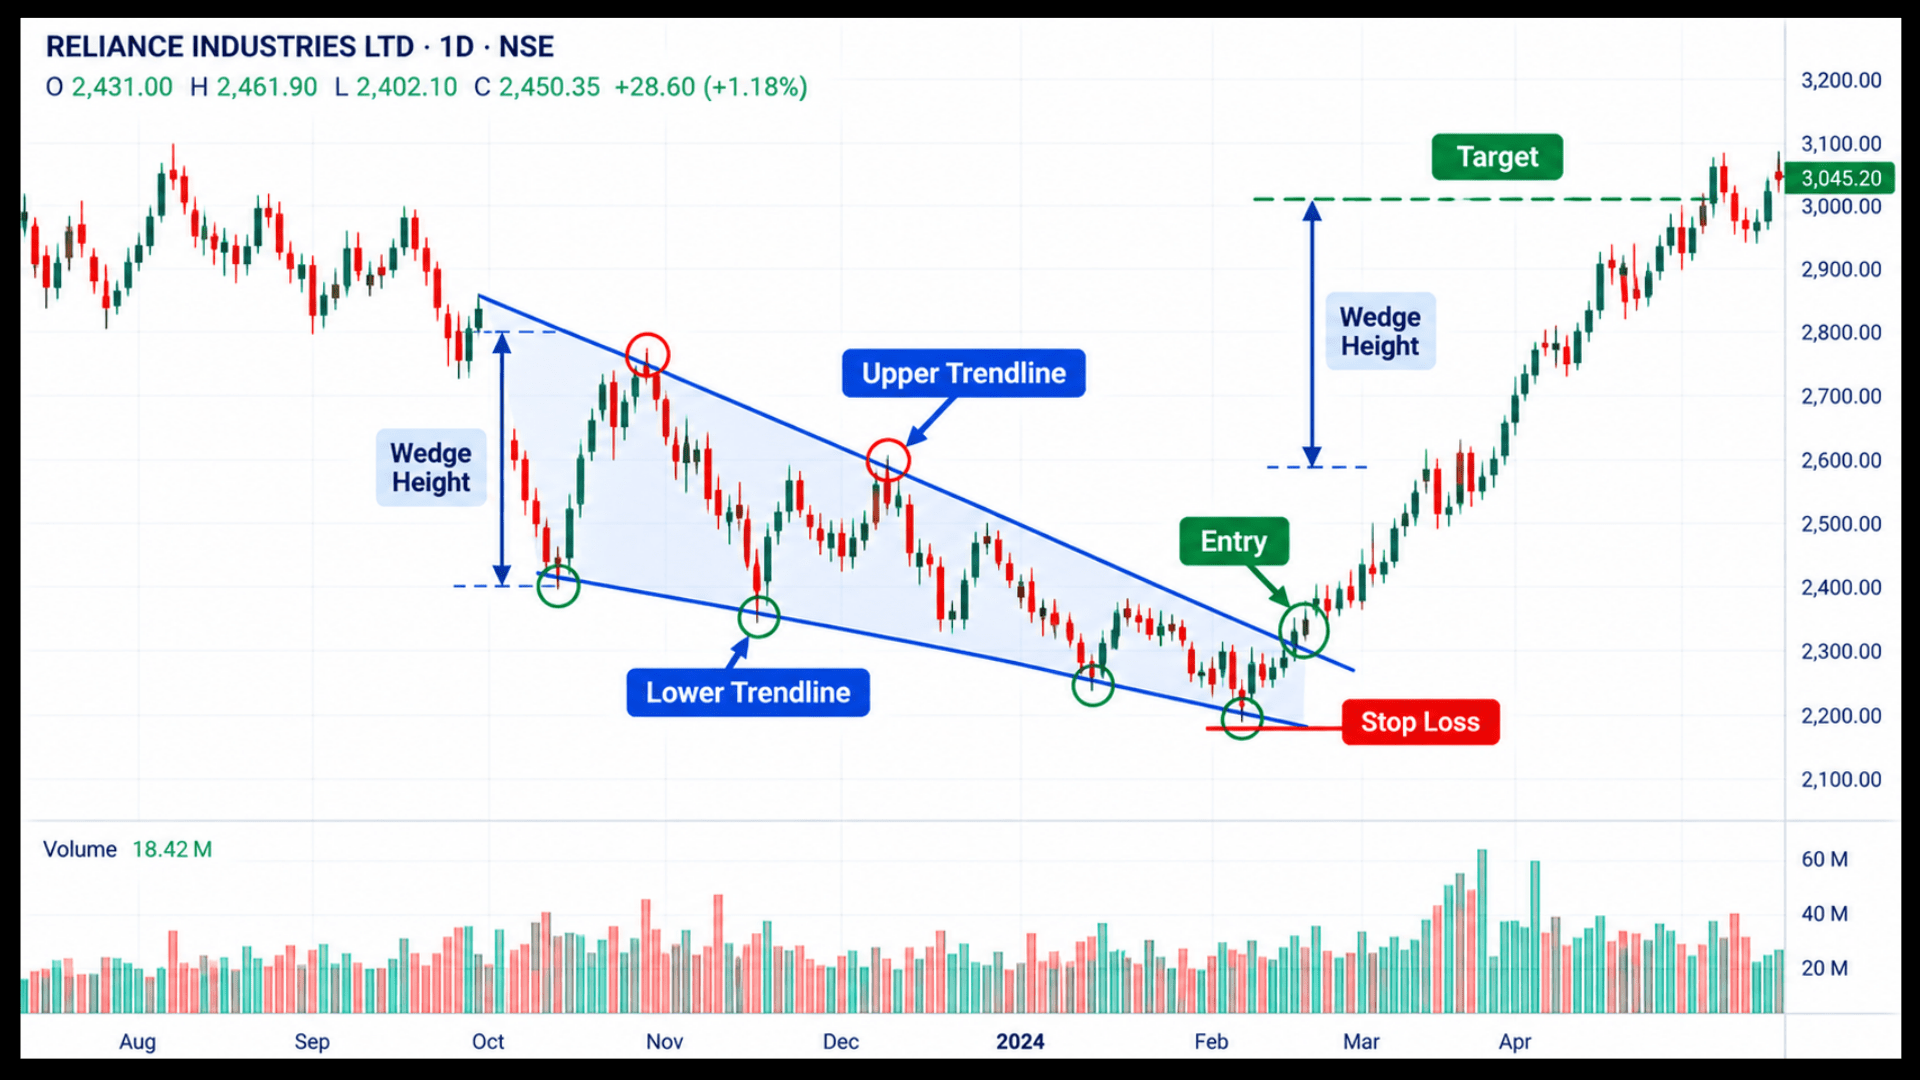
A stock slides from ₹300 to ₹240 inside a falling wedge. At its widest point, the range is ₹30 wide.
Near the apex, volume dries up. Then price closes at ₹246 above the upper line on rising volume, so you buy at ₹247.
Your stop goes below the last swing low at ₹238. As a result, risk is ₹9 per share.
The wedge width was ₹30. Therefore, the target is ₹247 plus ₹30, or ₹277. That is ₹30 of reward, around 3.3 times your risk.
How to Prepare While Waiting for a Wedge Breakout?
A wedge can last for weeks. Use that time to prepare instead of guessing the break.
First, mark both trendlines and add new touches as they appear. Then set an alert just beyond each line. Finally, decide your stop loss and position size while price is calm.
Do not trade inside the wedge. Instead, wait for a close beyond a line. If neither line breaks, you have no trade.
Why Does a Wedge Pattern Trading Strategy Fail?
Wedges are tricky. Price can break the wrong way, or break and fail. Therefore, know the common failure points.
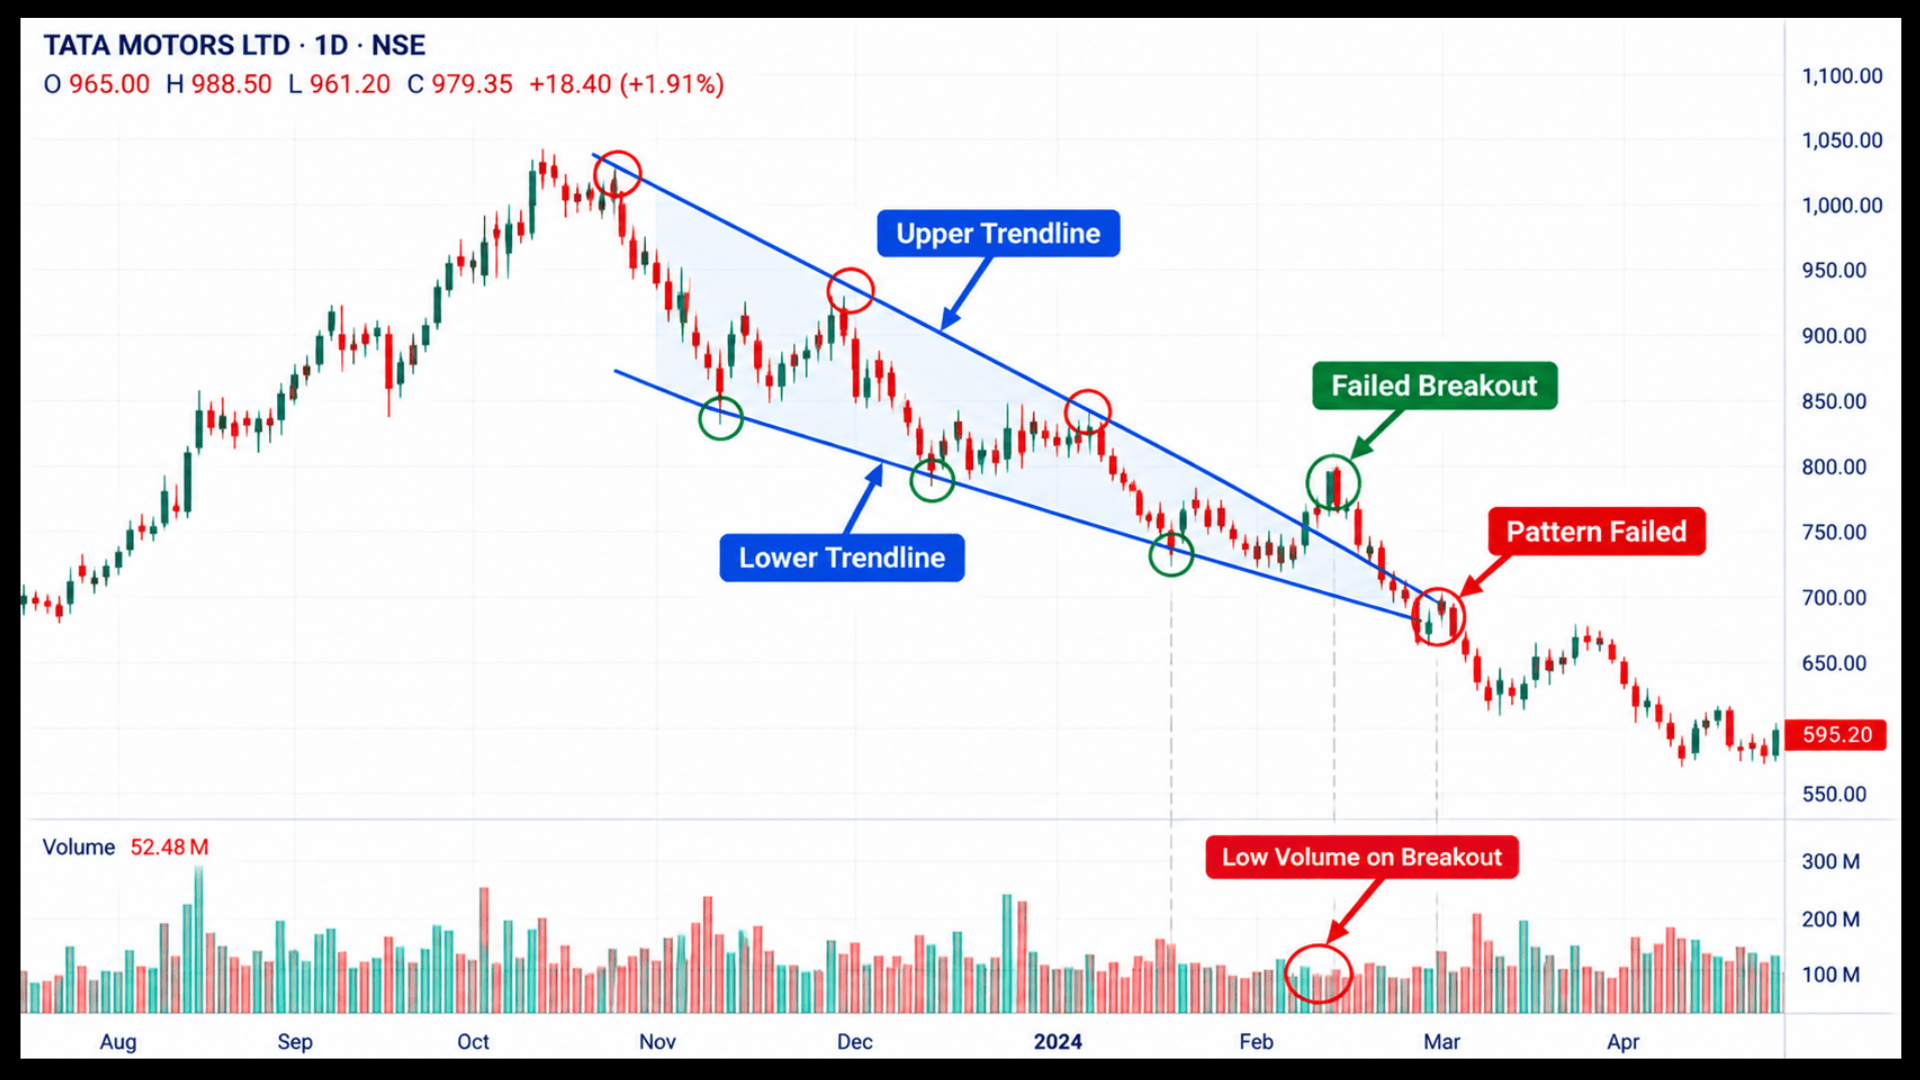
Watch for these warning signs:
- Price breaks out late, very close to the apex. Late breaks lose power.
- The breakout candle shows weak volume.
- Sometimes a rising wedge keeps rising and never breaks down. It may be a normal trend.
- Likewise, a falling wedge may form in a strong downtrend that simply resumes.
Where Do Wedge Patterns Rank Among Other Technical Chart Patterns?
Wedges are one of several shapes that squeeze price into a narrowing range.
Triangles do the same job with a different slope.
A symmetrical shape that points sideways is a triangle. Read about it in our guide to symmetrical triangle pattern .
Want to Draw and Trade Wedges With Live Guidance?
Drawing trendlines on an old chart is easy. Drawing them on a live chart, with price still moving, is the real test.
Our technical analysis classes in India teach this live, on real Indian stocks.
Conclusion
A wedge tells you a trend is still moving but running out of force. The squeeze is the clue. Price makes less progress with each push.
Wait for the breakout close, check volume, and place your stop beyond the last swing. Measure the widest part of the wedge for a target.
Skip wedges that break very late or on thin volume.
A wedge is a warning first and a signal second, so patience pays here. Practise on past charts first, then trade only the setups that follow every rule you set.
Frequently Asked Questions
Before investing capital, invest your time in learning Stock Market.
Fill in the basic details below and a callback will be arranged for more information: