

Every powerful trend leaves a signature before it begins or ends, and the diagonal triangle pattern Elliott wave is one of the clearest signatures in all of technical analysis.
Price slows down, waves start overlapping, momentum fades, yet the market keeps pushing forward as if running on fumes.
Most traders see this as noise and step aside, but experienced Elliott Wave traders see it as a signal.
The diagonal triangle pattern Elliott wave appears in two critical locations: at the very start of a new trend and at the final exhaustion point of an existing one.
This makes it one of the few patterns that signal both opportunity and reversal.
Understanding how to identify and trade this pattern can help traders catch breakouts early, time reversals accurately, and avoid being trapped on the wrong side of a move.
This guide breaks down everything you need to know about the diagonal triangle pattern Elliott wave, from structure and rules to real trading setups.
What Is The Diagonal Triangle Pattern Elliott Wave?
The diagonal triangle Elliott wave is a five-wave formation that appears as a triangle wedge on the chart. Unlike a normal impulse wave, the internal waves overlap.
The structure still follows the Elliott rule of five waves, but the shape narrows as the price moves forward.
Core Characteristics:
|
Feature |
Description |
| Wave Count |
5 waves (1, 2, 3, 4, 5) |
|
Shape |
Wedge or contracting triangle |
| Overlap |
Wave 4 may enter Wave 1 territory, though overlap is not always mandatory |
|
Momentum |
Gradually weakening |
| Location |
Beginning or end of a trend |
Think of it as a tired trend that still tries to move forward.
A quick example:
Take a look at the chart example given below that explains the diagonal triangle pattern:
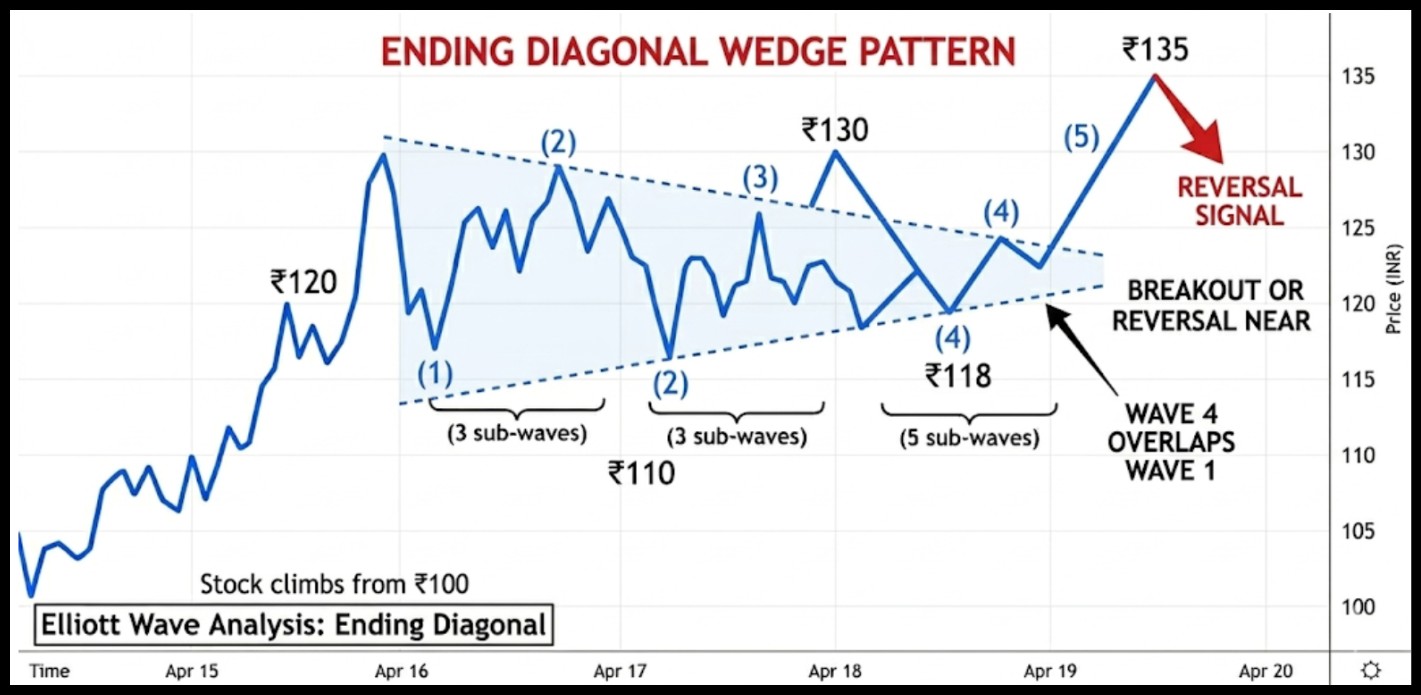
- Stock climbs from ₹100 to ₹120 in Wave 1
- Pulls back to ₹110 in Wave 2
- Pushes to ₹130 in Wave 3
- Drops to ₹118 overlapping Wave 1
- Final push to ₹135 before reversing
That wedge shape often hints that a breakout or reversal is near.
Types Of Diagonal Triangle Elliott Wave
The Elliott wave of diagonal triangles has two primary forms, depending on the location where it forms in the wave cycle.
They both share the same five-wave overlapping structure but are positioned differently within the trend, relaying an entirely new message on the market sentiment and trading behavior of traders.
1. Leading Diagonal Triangle
The Leading diagonal triangle appears at the start of a new trend. It is one of the most reliable ways to identify Elliott Wave 1 because it shows the initial struggle between buyers and sellers as a new move begins.
It forms in either:
- Wave 1 of an impulse
- Wave A of a correction
Have a look at the chart example below:
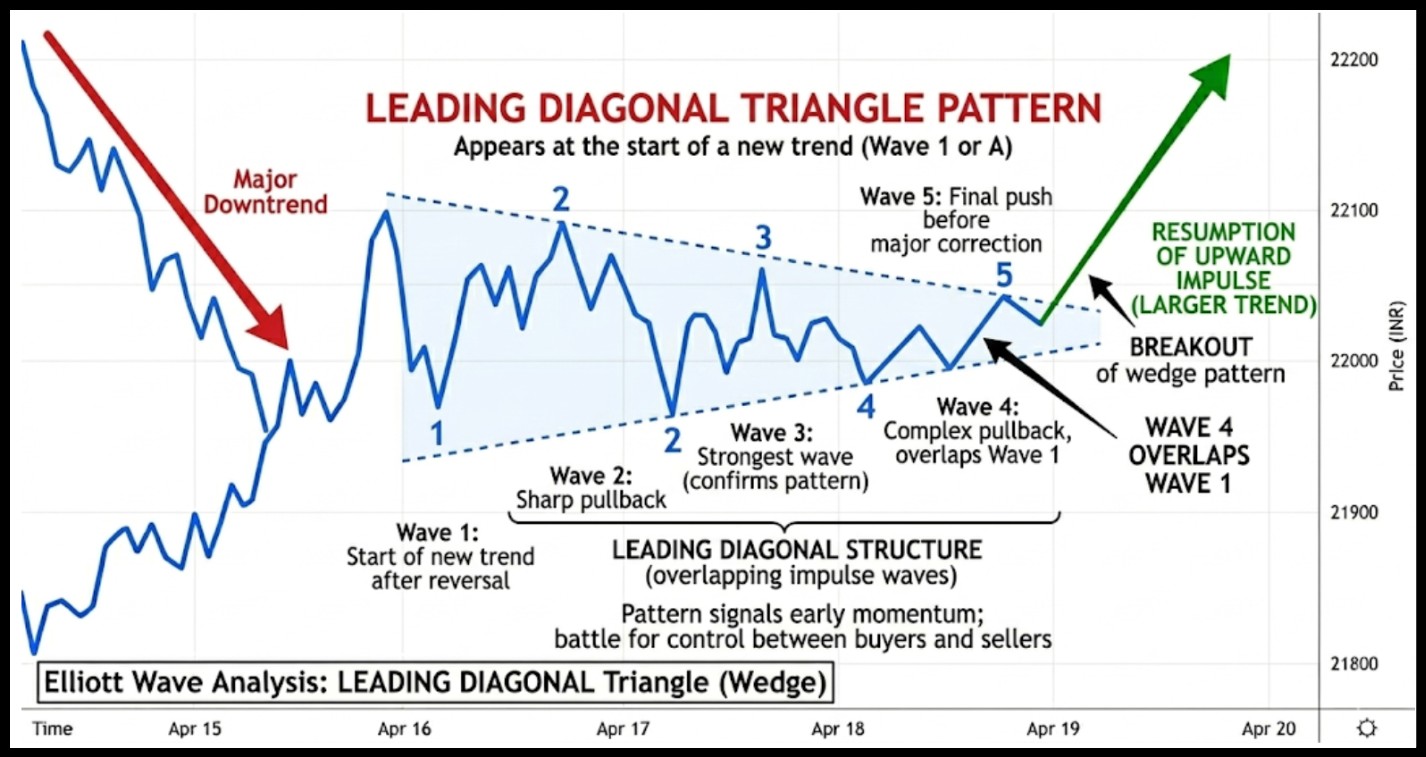
The Leading diagonal pattern often signals early momentum after a major reversal. Markets are still uncertain. Buyers and sellers battle for control.
That struggle creates overlapping waves.
Structure Of A Leading Diagonal:
Leading diagonal: internal structure is most commonly 3-3-3-3-3, though some cases can be labeled 5-3-5-3-5, meaning the trend will continue after correction.
|
Wave |
Typical Behavior |
| Wave 1 |
Starts a new trend |
|
Wave 2 |
Sharp pullback |
| Wave 3 |
Strong move |
|
Wave 4 |
Overlaps Wave 1 |
| Wave 5 |
Final push before correction |
A real trading scenario might look like this.
A stock drops for months. Then the price forms a small wedge while climbing slowly. That wedge could be a leading diagonal triangle, hinting that a larger uptrend may follow.
Traders often confirm this when Wave 3 breaks the wedge.
Leading Diagonal Rules
A leading diagonal appears at the beginning of a new trend, typically in Wave 1 of an impulse or Wave A of a correction.
Understanding the Elliott Wave Leading Diagonal is essential because it shows that a new directional move is forming, but the market is still unstable and volatile.
|
Rule |
Explanation |
| Wave 2 Never Ends Beyond Start Of Wave 1 |
Wave 2 must stay within the boundary of Wave 1 and cannot fully retrace it. |
|
Wave 3 Must Break The End Of Wave 1 |
This confirms that the new trend has momentum and is progressing forward. |
| Wave 4 Often Breaks Beyond the End Of Wave 1 |
Unlike standard impulses, Wave 4 in a leading diagonal commonly overlaps Wave 1. |
|
Wave 5 Usually Breaks The End Of Wave 3 |
In most cases, Wave 5 pushes past the top of Wave 3, confirming continuation. |
|
Wave 3 cannot Be The Shortest Wave |
Similar to other impulse structures, Wave 3 must not be the smallest among Waves 1, 3, and 5. |
2. Ending Diagonal Triangle
The ending diagonal triangle is more common. It appears near the end of a trend.
You usually find it in:
- Wave 5 of an impulse
- Wave C of a correction
This pattern shows exhaustion. Buyers push prices higher, but momentum keeps fading.
Ending Diagonal Triangle Elliott Wave Pattern Behavior:
Ending diagonal: internal structure is 3-3-3-3-3, meaning the trend is about to reverse.
|
Signal |
Meaning |
| Weak Momentum |
The trend is losing strength |
|
Overlapping Waves |
Market indecision |
|
Wedge Shape |
Price compression |
| Sharp Break After Wave 5 |
Reversal likely |
Traders often see this before major reversals.
Ending Diagonal Rules
The ending diagonal is a pattern that occurs towards the tail-end of a good trend, traditionally in Wave 5 of an impulse or in Wave C of a correction.
It is an indicator that the momentum is dying and the trend can soon change or experience a higher correction.
Understanding the Elliott Wave Ending Diagonal structure is vital because the momentum is clearly dying.
When analyzing this structure, the Elliott Wave 5 Length becomes a critical focus for traders because it often shows “truncation” or extreme shortening, proving that the buyers (or sellers) have finally run out of steam.
|
Rule |
Explanation |
| Wave 2 cannot Go Beyond Start Of Wave 1 |
The correction of Wave 2 should remain higher than the start of Wave 1 in an uptrend (or lower than it in a downtrend). |
|
Wave 3 cannot Be The Shortest Wave |
Wave 3 should not be the shortest of the Waves 1, 3, and 5; it typically exhibits moderate momentum. |
|
Wave 4 cannot Move Beyond The Origin Of Wave 3 |
Wave 4 overlaps Wave 1 but does not go beyond the end of Wave 3. |
|
Wave 5 Is Often The Shortest In A Contracting Diagonal |
In many ending diagonals, Wave 5 becomes shorter as momentum fades. |
|
Wave 5 Can Be Truncated |
Sometimes Wave 5 fails to exceed the end of Wave 3, signalling exhaustion in the trend. |
What Is A Throw-Over In An Ending Diagonal?
Within an ending diagonal, the last wave is usually completed by a throw-over, which is a short-lived price breakage above the trendline between Waves 1 and 3.
Volume, which usually declines during the diagonal, often spikes during this move.
Many traders mistake this for a breakout, but in reality, it often signals trend exhaustion and an upcoming reversal.
Contracting Vs Expanding Diagonal Triangle
Diagonal patterns in Elliott Wave appear in two main forms: contracting and expanding.
Most traders are familiar with the contracting version because it forms a wedge where trendlines move closer together.
The expanding diagonal is less common but important to recognize because the price swings grow larger instead of tighter.
While many people simply refer to this as a wedge, the technical Elliott Wave Triangle Pattern describes this specific five-wave overlapping move that defines the boundaries of the trend.
In an expanding diagonal, each wave becomes progressively larger. Wave 1 is the shortest, Wave 3 is longer, and Wave 5 becomes the longest.
This is the reverse of the contracting diagonal, in which the price range continuously decreases.
|
Feature |
Contracting Diagonal | Expanding Diagonal |
| Trendline Shape | Converging lines |
Diverging lines |
|
Wave Size |
Waves become smaller | Waves become larger |
| Wave Length Pattern | Wave 1 longest |
Wave 1 shortest |
|
Final Wave |
Smaller Wave 5 |
Strong extended Wave 5 |
Diagonal Triangle Pattern Elliott Wave Formula
A diagonal triangle in Elliott Wave appears near the beginning or the end of a trend and signals that the market is losing momentum.
The diagonal triangle pattern Elliott Wave formula focuses mainly on wavelength relationships, overlapping waves, and a contracting structure.
Typical Wave Relationships In A Contracting Diagonal:
|
Wave |
Typical Relationship | Behavior |
| Wave 2 | 50% to 78% retracement of Wave 1 |
Deep pullback, but remains corrective |
|
Wave 3 |
Shorter than Wave 1 | Momentum weakens compared to Wave 1 |
| Wave 4 | 66% to 81% retracement of Wave 3 |
Deep retracement with clear overlap |
|
Wave 5 |
Usually shorter than Wave 3 |
Final weakening move completing the pattern |
In a contracting ending diagonal, the wave structure gradually loses strength.
Wave 3 is not extended and is generally shorter than Wave 1, whereas Wave 5 tends to be the shortest of all waves as the pattern reaches closure.
Key Structural Rules:
Several structural features help confirm a diagonal triangle pattern:
- The waves overlap with each other, particularly Wave 4 overlapping Wave 1
- Trendlines intersect with highs and lows being drawn nearer to one another
- Wavelengths shrink progressively in a contracting diagonal
As traders relate the highs and lows of the waves, the price tends to take the form of a wedge, which is an indication that the trend is draining out.
Tools Traders Use To Confirm The Pattern:
To verify whether the structure is truly a diagonal, traders often combine wave counting with technical tools such as:
- TradingView trendlines to confirm the wedge shape
- Fibonacci retracement levels to measure wave relationships
- Volume indicators to track participation
Volume behavior often supports the pattern. Trading activity tends to decline during the formation of the diagonal, reflecting weakening momentum.
Once the pattern completes, volume frequently spikes during the breakout, confirming the next directional move.
How Traders Actually Trade Diagonal Patterns?
Patterns are useful only when they help make decisions. Here is how experienced traders handle them.
Leading Diagonal Setup:
- Wait for Wave 2 pullback to confirm the diagonal structure is forming correctly
- Enter near the wedge support zone where price shows signs of holding and reversing
- Place your stop loss just below the Wave 1 starting point to protect the trade
Ending Diagonal Setup:
- Wait patiently for Wave 5 to fully complete before considering any trade entry
- Enter the trade after a confirmed breakdown below the lower wedge trendline
- Target previous support levels where price found strong buying interest before the diagonal formed
The diagonal triangle pattern rewards patience above everything else, as rushing an entry before confirmation is the fastest way to get caught on the wrong side.
Respect the structure, wait for the pattern to complete, and the trade often sets up with remarkable clarity.
A Practical Example:
To understand the diagonal triangle pattern Elliott wave nicely, let us have a look at a practical example on Nifty:
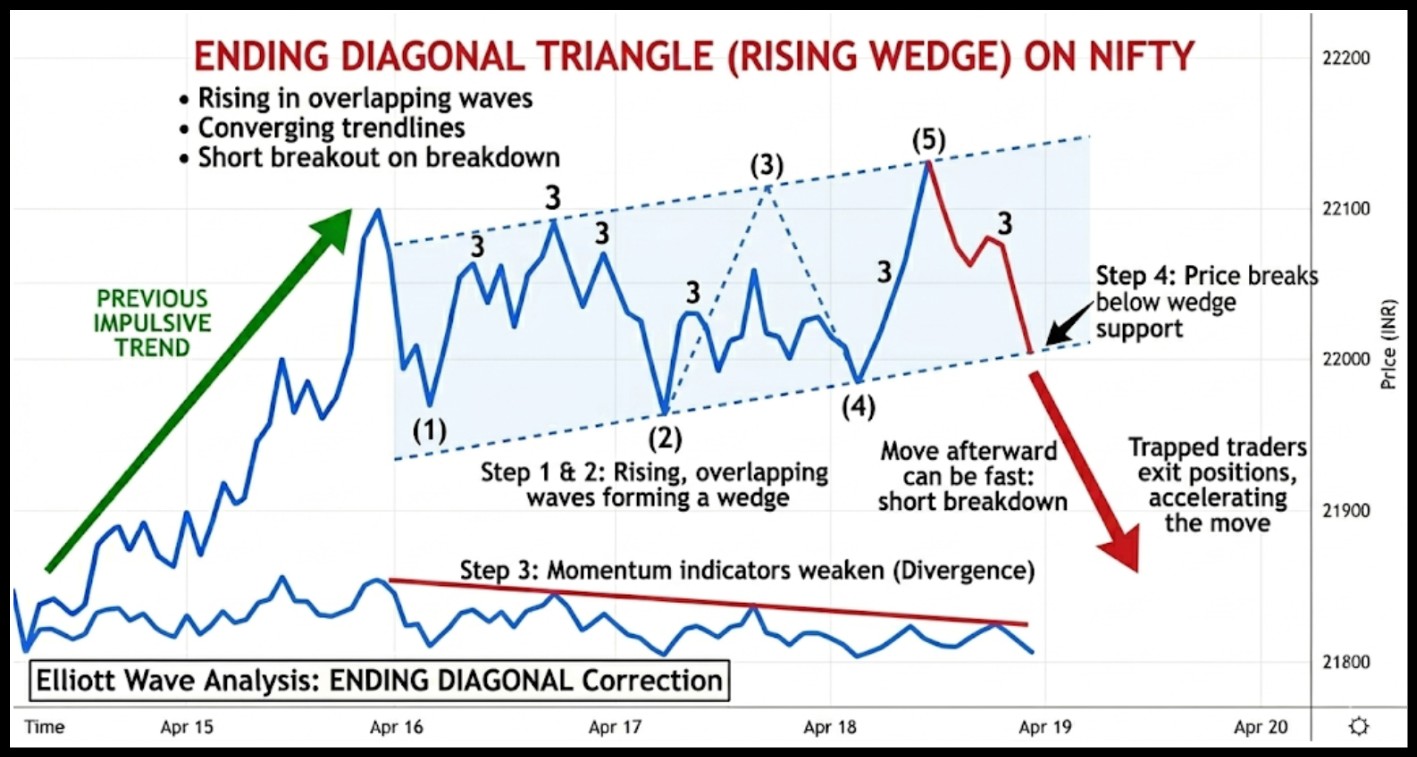
The above chart of NIFTY shows:
|
Step |
Market Action |
| Step 1 |
NIFTY rises in overlapping waves |
|
Step 2 |
Trendlines form a rising wedge |
| Step 3 |
Momentum indicators weaken |
|
Step 4 |
Price breaks below wedge support |
Traders who spot the ending diagonal triangle often short the breakdown. The move afterward can be fast because trapped traders exit positions.
Common Mistakes In Diagonal Triangle Pattern
Even experienced traders misread diagonal structures.
A few common traps include:
- Confusing wedges with channels where trendlines run parallel instead of converging toward a point
- Ignoring volume behavior, which should visibly decline as the diagonal forms and spike at the breakout
- Entering the trade too early, before Wave 5 completes and the pattern fully confirms itself
- Mislabeling corrective waves as diagonal structures when the overlap and wedge shape are not clearly present
A diagonal must show clear overlap and a converging wedge structure to be valid. If the trendlines are parallel, it is a channel, not a diagonal.
Patience is everything here because the most reliable entry comes only after the pattern fully completes.
Conclusion
The diagonal triangle pattern is one of the most telling structures in Elliott Wave analysis.
It does not just show where the price is going, but it also shows how much energy the trend has left.
Whether it appears at the start of a move as a leading diagonal or at the exhaustion point as an ending diagonal, the pattern gives traders a structured way to anticipate what comes next.
The overlapping waves, narrowing wedge, and fading momentum are all clues that the market is either building up or winding down.
Like all Elliott Wave patterns, the diagonal triangle works best when confirmed with volume, Fibonacci levels, and momentum indicators rather than used in isolation.
Mastering the diagonal triangle means learning to read not just price, but the story that price is trying to tell.
If you want to understand how these patterns actually behave in real market conditions, join our live stock market classes, where we break down such structures step by step with practical trading insights.
FAQs
Q1: How Do Traders Confirm An Ending Diagonal Triangle?
Ans: Traders confirm it using converging trendlines, overlapping waves, weak momentum, and a breakdown after Wave 5.
Q2: Is The Leading Diagonal Pattern Reliable?
Ans: Yes, but it appears less frequently. When confirmed, it often signals the early stage of a strong new trend.
Q3: Can A Diagonal Triangle Pattern Elliott Wave Expand Instead Of Contract?
Ans: Yes, though it is rare. The trend lines at other instances move apart, other than converging, forming a widening diagonal.
The wave structure still follows the same five-wave overlap rules, but price volatility increases as the pattern progresses.
Before investing capital, invest your time in learning Stock Market.
Fill in the basic details below and a callback will be arranged for more information:


