


Prices rarely turn around in one clean move.Before a trend ends, buyers or sellers often try twice and fail. That double failure leaves a shape on the chart. In this guide, having the double top and double bottom pattern explained helps you understand how these formations tell you a trend has hit a wall twice and may be ready to reverse.
It shows how to spot both patterns, where to enter, where to place your stop loss, and how to measure a target.
It also covers how the pattern fails.
What Are Double Top and Double Bottom Patterns?
These are reversal patterns. They form when price tests the same level twice and fails both times.
We touched on both patterns briefly in our post on swing trading patterns, but having the double top and double bottom pattern explained in detail makes this guide go much deeper.
A double top forms after an uptrend. Price hits a high, pulls back, rallies to the same area again and then falls.
It looks like the letter M.
A double bottom forms after a downtrend. Price hits a low, bounces, falls to the same area again and then rallies.
It looks like the letter W.
Double Top vs. Double Bottom: Key Differences Explained
Here is a quick comparison before we go through each pattern in detail.
| Feature | Double top | Double bottom |
|---|---|---|
| Prior trend | Uptrend | Downtrend |
| Shape | M | W |
| Signal | Bearish reversal | Bullish reversal |
| Confirmation | Close below the middle low | Close above the middle high |
| Stop loss | Above the second peak | Below the second low |
| Target | Pattern height projected down | Pattern height projected up |
How Does a Double Top Form
The pattern builds in stages. Knowing each stage stops you from calling a pattern too early.
Here are the five stages of a double top:
- Prices rally in a clear uptrend and make an initial high.
- Next, a pullback occurs toward a support level, establishing the neckline.
- Following that, buyers push the market up again, though it stalls near the first peak.
- Then, prices drop back down toward the neckline.
- Finally, a candle close below the neckline confirms the pattern.
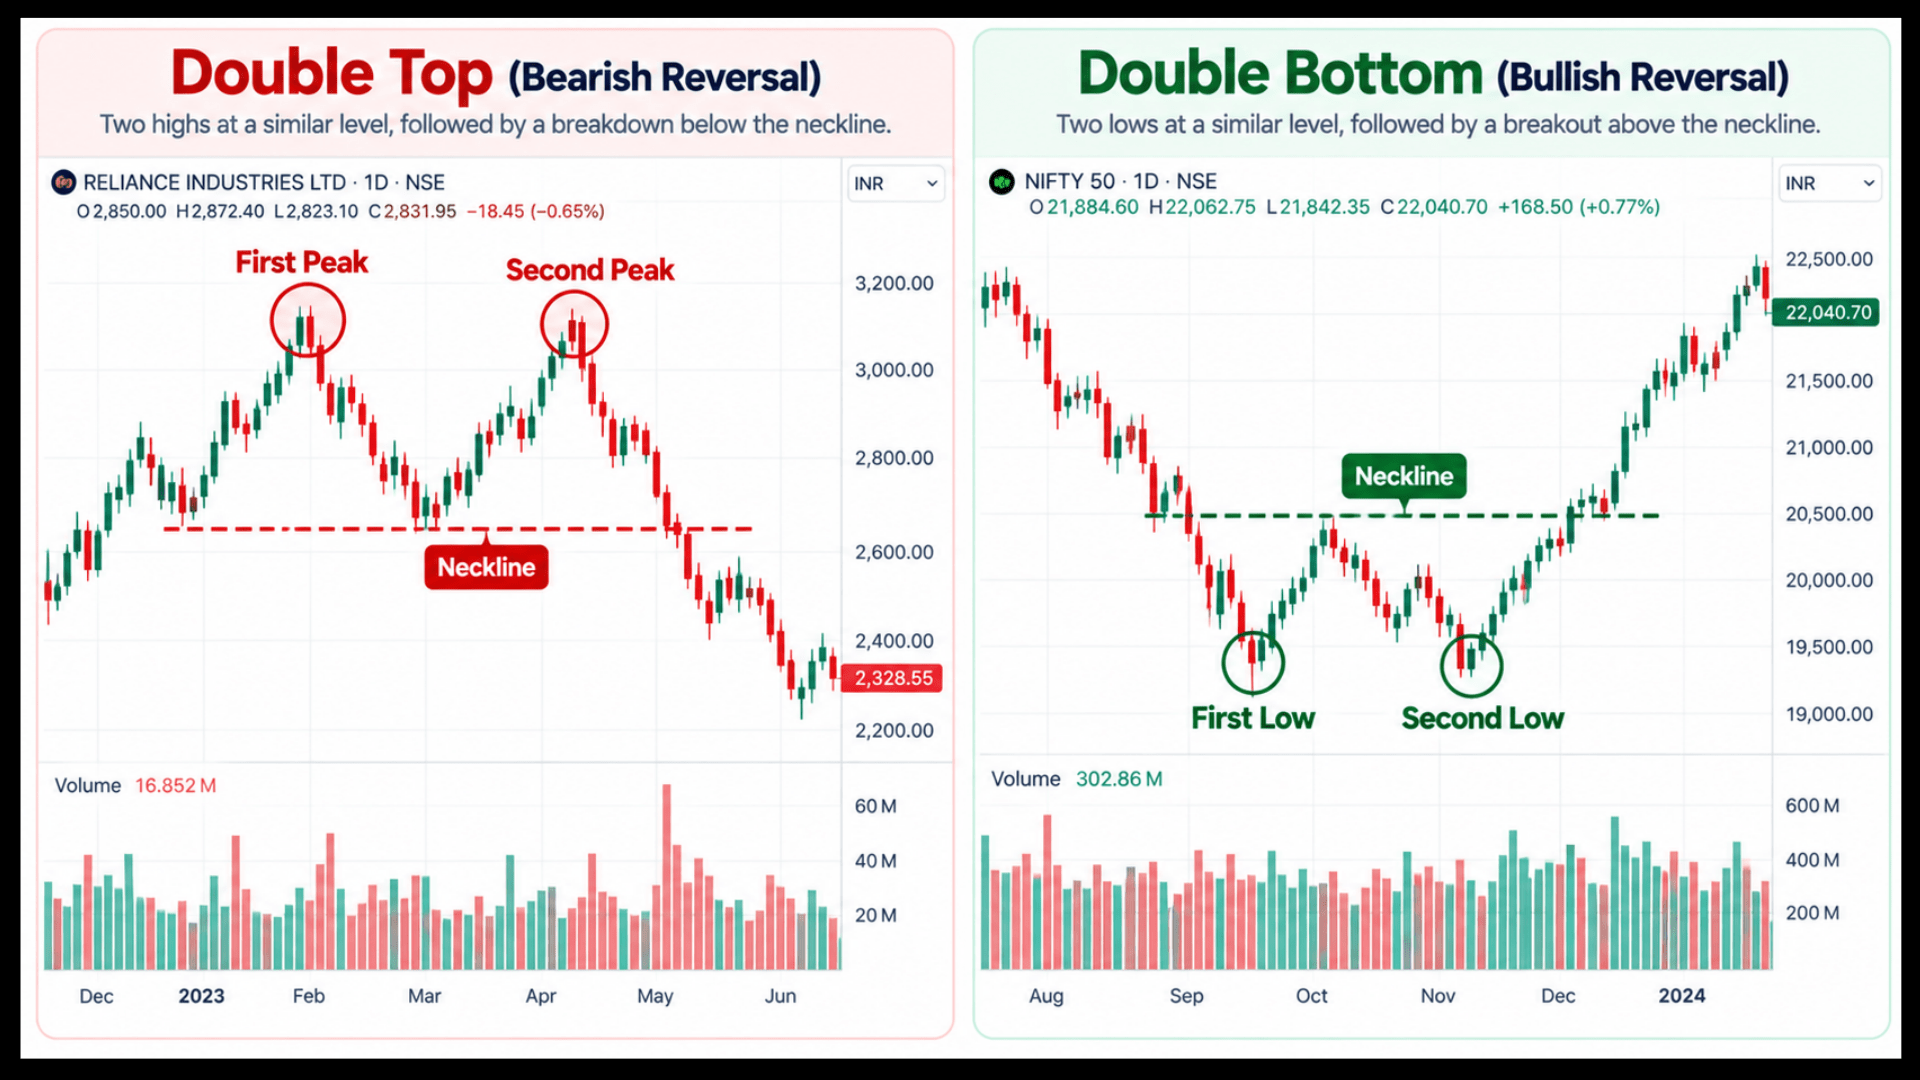
Volume often fades on the second peak. That shows fewer buyers are willing to pay up.
A double bottom runs the same way in reverse. Volume usually picks up on the rally away from the second low.
How to Verify a Double Top Before Trading
A shape alone is not a signal. Confirmation protects you from trading a half-formed pattern.
Run through these checks before you act.
- A clear trend existed before the pattern, lasting at least several weeks.
- The two peaks sit within about 3% of each other.
- A few weeks separate the peaks, not just a few days.
- Price closes beyond the neckline, not just touches it.
- Volume rises on the neckline break.
The neckline is simply a support level. If you want to sharpen that skill, exploring a wedge pattern trading strategy gives traders a clear guide and explanation for how converging trendlines compress price action before a breakout.
How to Trade Double Top and Double Bottom Patterns
Once the pattern is confirmed, the trade comes down to three levels: entry, stop loss and target. The sections below cover the double top first, then the double bottom, and end with a worked example in rupees.
For traders looking to ride subsequent trend expansions after a breakout, mastering flag and pennant pattern trading can help you identify brief consolidation phases before the market resumes its primary direction.
How to Trade a Double Top
Plan all three levels before you enter. Decide them while the pattern is still forming, not after.
Here is a simple rule set for a double top.
- Entry: sell when a candle closes below the neckline. A safer option is to wait for a retest of the neckline from below.
- Stop loss: place it above the second peak. A tighter stop sits just above the neckline after a retest.
- Target: measure the height from the peaks to the neckline. Subtract that distance from the neckline.
In the Indian cash market you cannot carry a short position overnight. To trade a double top on the downside across days, you need futures or put options.
Our guide on the rectangle pattern explains how prolonged horizontal consolidation ranges help traders identify accumulation phases before the next directional wave.
How to Trade a Double Bottom
A double bottom is the mirror image. You can buy it in the cash market, which makes it easier to use.
Use the same three-level plan:
- Entry: buy when a candle closes above the neckline, or on a retest from above.
- Stop loss: place it below the second low, or just under the neckline after a retest.
- Target: measure the height from the lows to the neckline. Add that distance to the neckline.
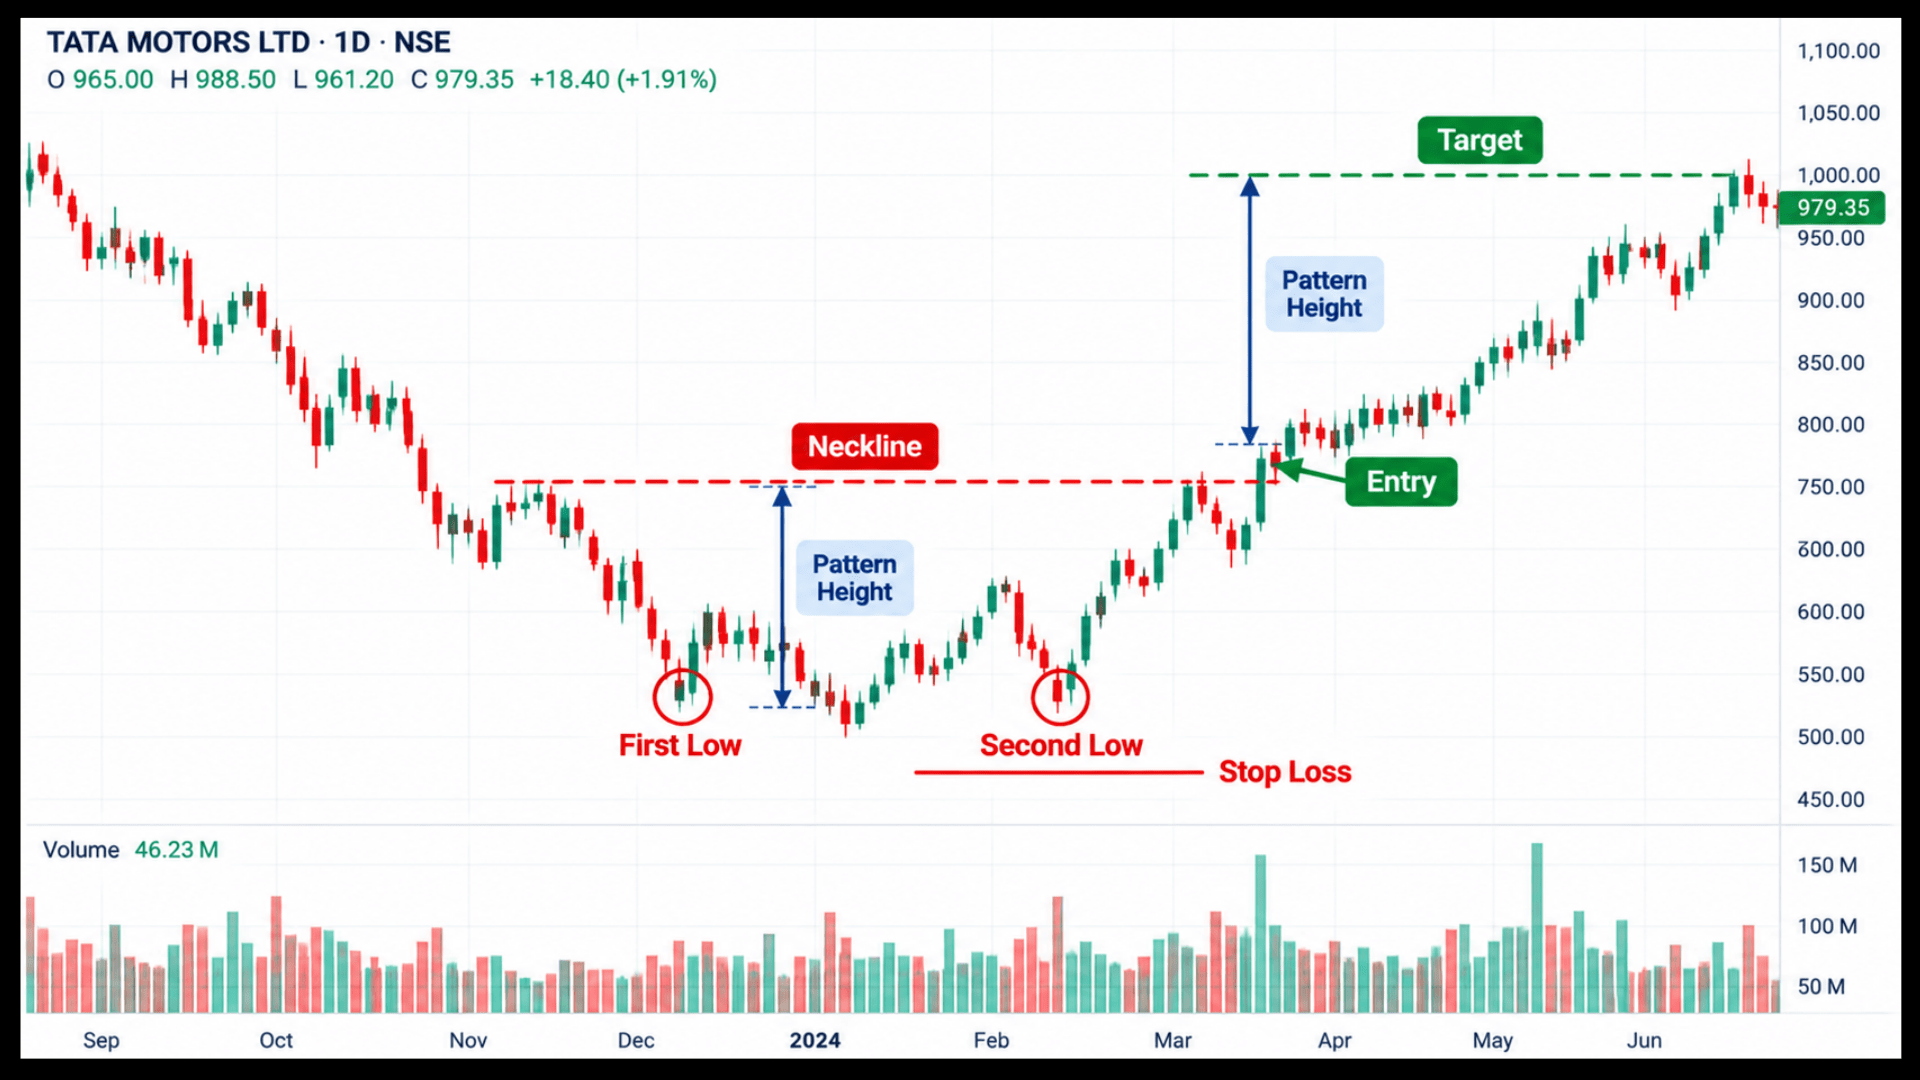
Double Bottom Worked Example: What Do the Numbers Look Like?
These figures are illustrative and are not a recommendation.
A large-cap stock falls to ₹440 and bounces to ₹500. It falls again to ₹442, then rallies.
The neckline sits at ₹500.
Price closes at ₹506 on rising volume. It then dips back to ₹502 and holds.
You buy at ₹503.
Your stop loss goes at ₹489, below the neckline. That is ₹14 of risk per share.
The pattern height is ₹60 (₹500 minus ₹440). The target is ₹560.
That is ₹57 of reward, roughly four times your risk.
A breakout entry with a stop below the second low often gives closer to 1:1. A retest improves the ratio, but the retest does not always come.
When Does a Double Top Fail? Signs and Exit Strategies
Double patterns fail often enough that you need an exit plan. Failure is a normal part of trading them.
Watch for these double top pattern failure signs:
- Price breaks the neckline, then closes back above it within a few sessions.
- The second peak climbs well above the first. The pattern may become a breakout instead.
- The breakdown happens on weak volume.
- The pattern forms against a strong, steep trend.
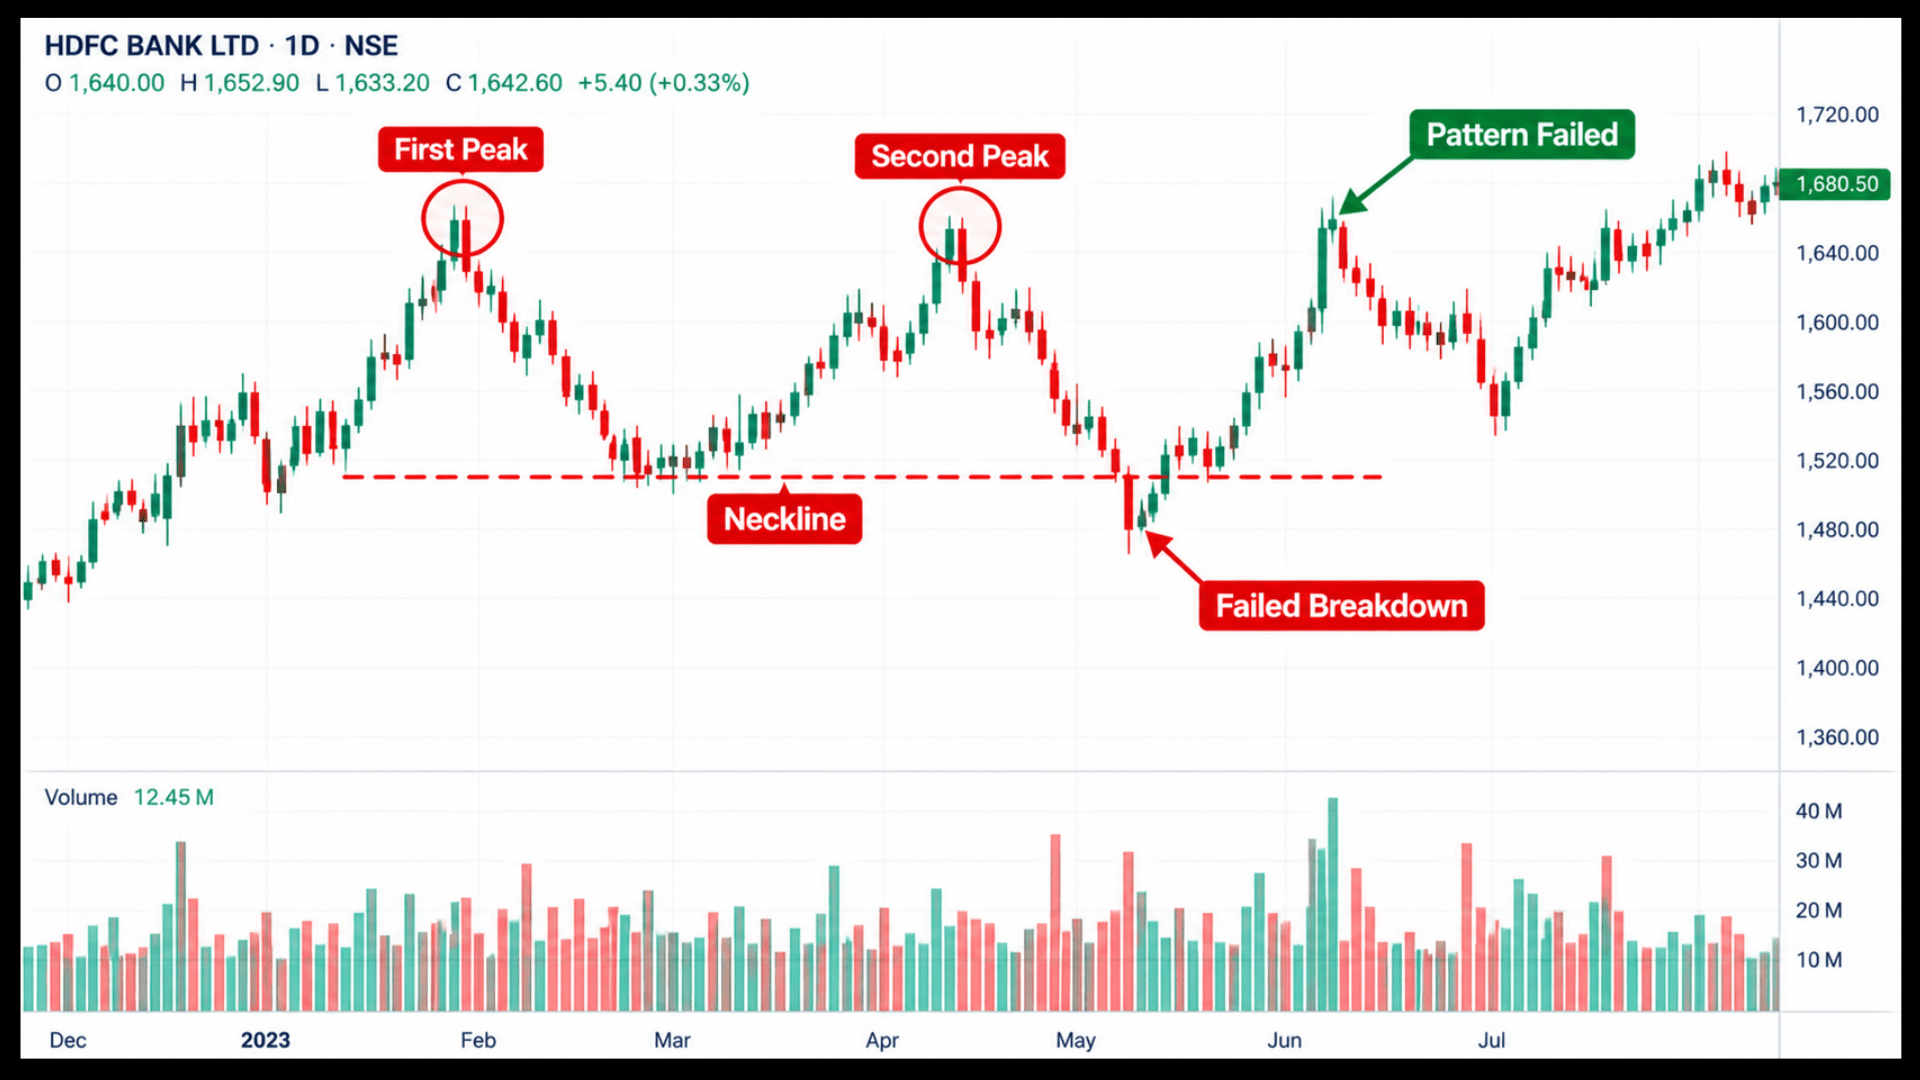
If price pushes well above the first peak, treat it as your exit signal.
A third attempt at the same level is a triple top, which carries its own risks.
Our guide on symmetrical triangle pattern trading breaks down how converging boundaries reduce false breakouts compared to traditional reversal structures.
Mistakes to Avoid When Trading Double Tops and Bottoms
Most losses come from a few repeat habits. Fix these and your results improve.
The first mistake is trading the second peak before confirmation. You are guessing that a pattern will complete. It often does not.
The second is ignoring the larger trend. A double top inside a strong uptrend fails far more often.
The third is placing a stop inside the noise. Give the trade room, then cut the size to fit.
A related reversal pattern uses three peaks instead of two. Our guide on the head and shoulders pattern explains it.
Our guide on the descending triangle pattern highlights how similar multi-timeframe confirmation methods apply when evaluating continuation setups.
How to Combine Double Tops and Bottoms with Other Technical Indicators
A pattern works best as one part of a bigger picture. Trend, volume and momentum all add weight.
Check the trend on a higher timeframe first. Then look at volume on the neckline break.
Our guide on the ascending triangle pattern emphasizes how broader trend context and volume expansion work together to validate breakouts before you commit capital.
Want to Spot These Patterns on Live Charts?
Finding a double top on a finished chart is easy. Judging one while the second peak is still forming takes practice.
Our technical analysis classes teach pattern reading live, on real Indian stocks.
Conclusion
Having the double top and double bottom pattern explained clearly reminds you that these formations show where a trend has failed twice at the same level.
That is useful information, not a guarantee.
Wait for the neckline close, check volume, and plan your stop before you enter.
Use a retest when you can, and size the trade for a wider stop when you cannot.
When price reclaims the neckline, accept the loss and move on. That discipline matters more than the shape, and it keeps one failed pattern from becoming a large loss.
Frequently Asked Questions
Before investing capital, invest your time in learning Stock Market.
Fill in the basic details below and a callback will be arranged for more information: