



Flag and pennant pattern trading is built on one idea. Strong moves rarely run in a straight line.
Instead, they sprint, rest, and then sprint again. The rest looks like a small flag or pennant on the chart.
Therefore, the goal is to catch the second sprint. First, you wait for the pause, then you trade the move that follows.
This guide covers how both patterns form, how to tell them apart, and how to plan your entry, stop loss and target.
What Is a Flag and Pennant Pattern in Trading?
Both are continuation patterns. In other words, they suggest a strong move will resume after a short pause.
Each pattern has two parts. First, the flagpole is the sharp move. Second, the flag or pennant is the pause that follows.
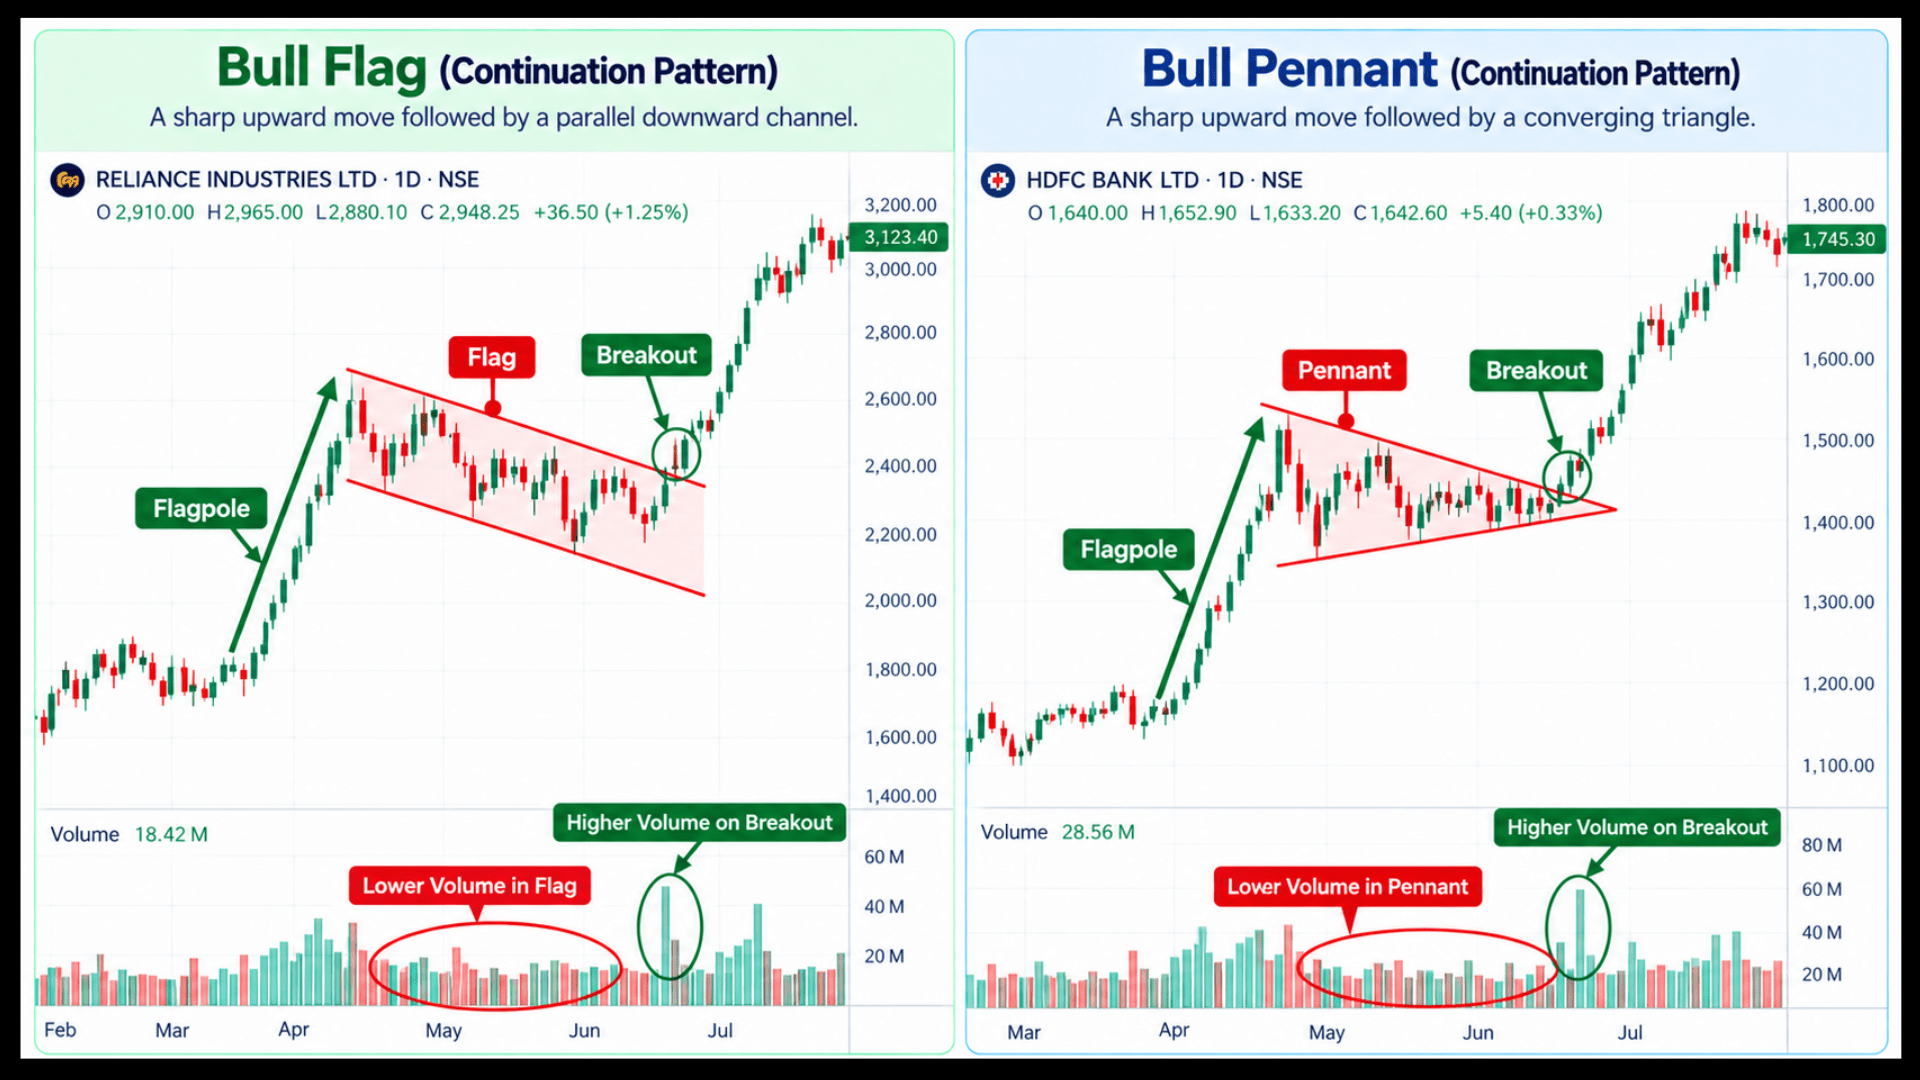
A flag drifts against the move inside a small, parallel channel. In contrast, a pennant squeezes into a small triangle.
Still, both usually end with a break in the direction of the flagpole.
We introduced both shapes in our post on swing trading patterns. This guide goes deeper.
Difference between Flag Pattern and Pennant Pattern
While flags and pennants are the most popular continuation structures, traders should also keep an eye out for a rectangle pattern when analyzing broader consolidations.
Unlike the sloping channel of a flag or the converging lines of a pennant, a rectangle pattern forms when prices bounce horizontally between parallel support and resistance levels.
This horizontal sideways movement indicates a temporary equilibrium between buyers and sellers before the prevailing trend resumes with similar momentum.
Here is a quick comparison of the two shapes.
| Feature | Flag | Pennant |
|---|---|---|
| Shape of the pause | Small parallel channel | Small symmetrical triangle |
| Slope | Tilts against the flagpole | Roughly flat |
| Typical length | A few days to about three weeks | A few days to about three weeks |
| Volume inside | Falls | Falls |
| Breakout | In the direction of the flagpole | In the direction of the flagpole |
What Is a Flagpole in a Flag and Pennant Pattern?
The flagpole tells you how much energy the move carries. As a result, a weak pole makes a weak pattern.
Look for these traits in the pole:
- A sharp, near-vertical move over a few sessions.
- Wide candles with little overlap.
- Volume well above the recent average.
- A clear news or momentum reason, such as results or a sector rally.
Without a real pole, you only have a normal pullback. In short, that is a different setup.
How to Identify a Bull Flag Pattern and a Bear Flag Pattern
A bull flag forms after a sharp rise. Then the pause tilts slightly downward, like a flag hanging on a pole.
Similarly, a bear flag forms after a sharp fall. The pause tilts slightly upward before the fall resumes.
Use this checklist to confirm a flag:
- The pole is clear and sharp.
- The pause lasts roughly three days to three weeks.
- The pullback stays shallow, usually under half the pole.
- Volume dries up during the pause.
- Price breaks the flag line on rising volume.
However, a deep pullback weakens the case. For example, if price retraces most of the pole, the pattern is probably not a flag.
Also, a wider, flatter pause is a different pattern. Read about it in our guide to rectangle pattern trading strategy.
Flag and Pennant Pattern Trading Strategy: Entry, Stop Loss and Target
In flag and pennant pattern trading, plan the whole trade before the breakout candle arrives. Above all, decide your risk first.
Here is a simple rule set for a bull flag or pennant.
- Entry: buy when a candle closes above the upper line of the flag or pennant, ideally on rising volume.
- Stop loss: place it below the lowest point of the flag or pennant.
- Target: measure the flagpole, then add that distance to the breakout point.
For bear flags, flip the rules.
The same breakout logic carries over to other consolidation patterns, and our guide on the ascending triangle pattern shows how a close above flat resistance works as the entry trigger.
However, in the Indian cash market you cannot hold a short position overnight, so a multi-day bear flag trade needs futures or put options.
For the bigger picture on combining patterns with trend and indicators, read our guide to swing trading with technical analysis.
Bull Flag Pattern Trading Example With Entry, Stop Loss and Target
These figures are illustrative and are not a recommendation.
For example, a mid-cap stock jumps from ₹200 to ₹240 in six sessions on heavy volume. That is a ₹40 flagpole.
It then drifts between ₹230 and ₹238 for eight sessions, with falling volume. The flag is shallow because only ₹10 of the pole is retraced.
After that, price closes at ₹239 above the flag line on strong volume. So you buy at ₹240.
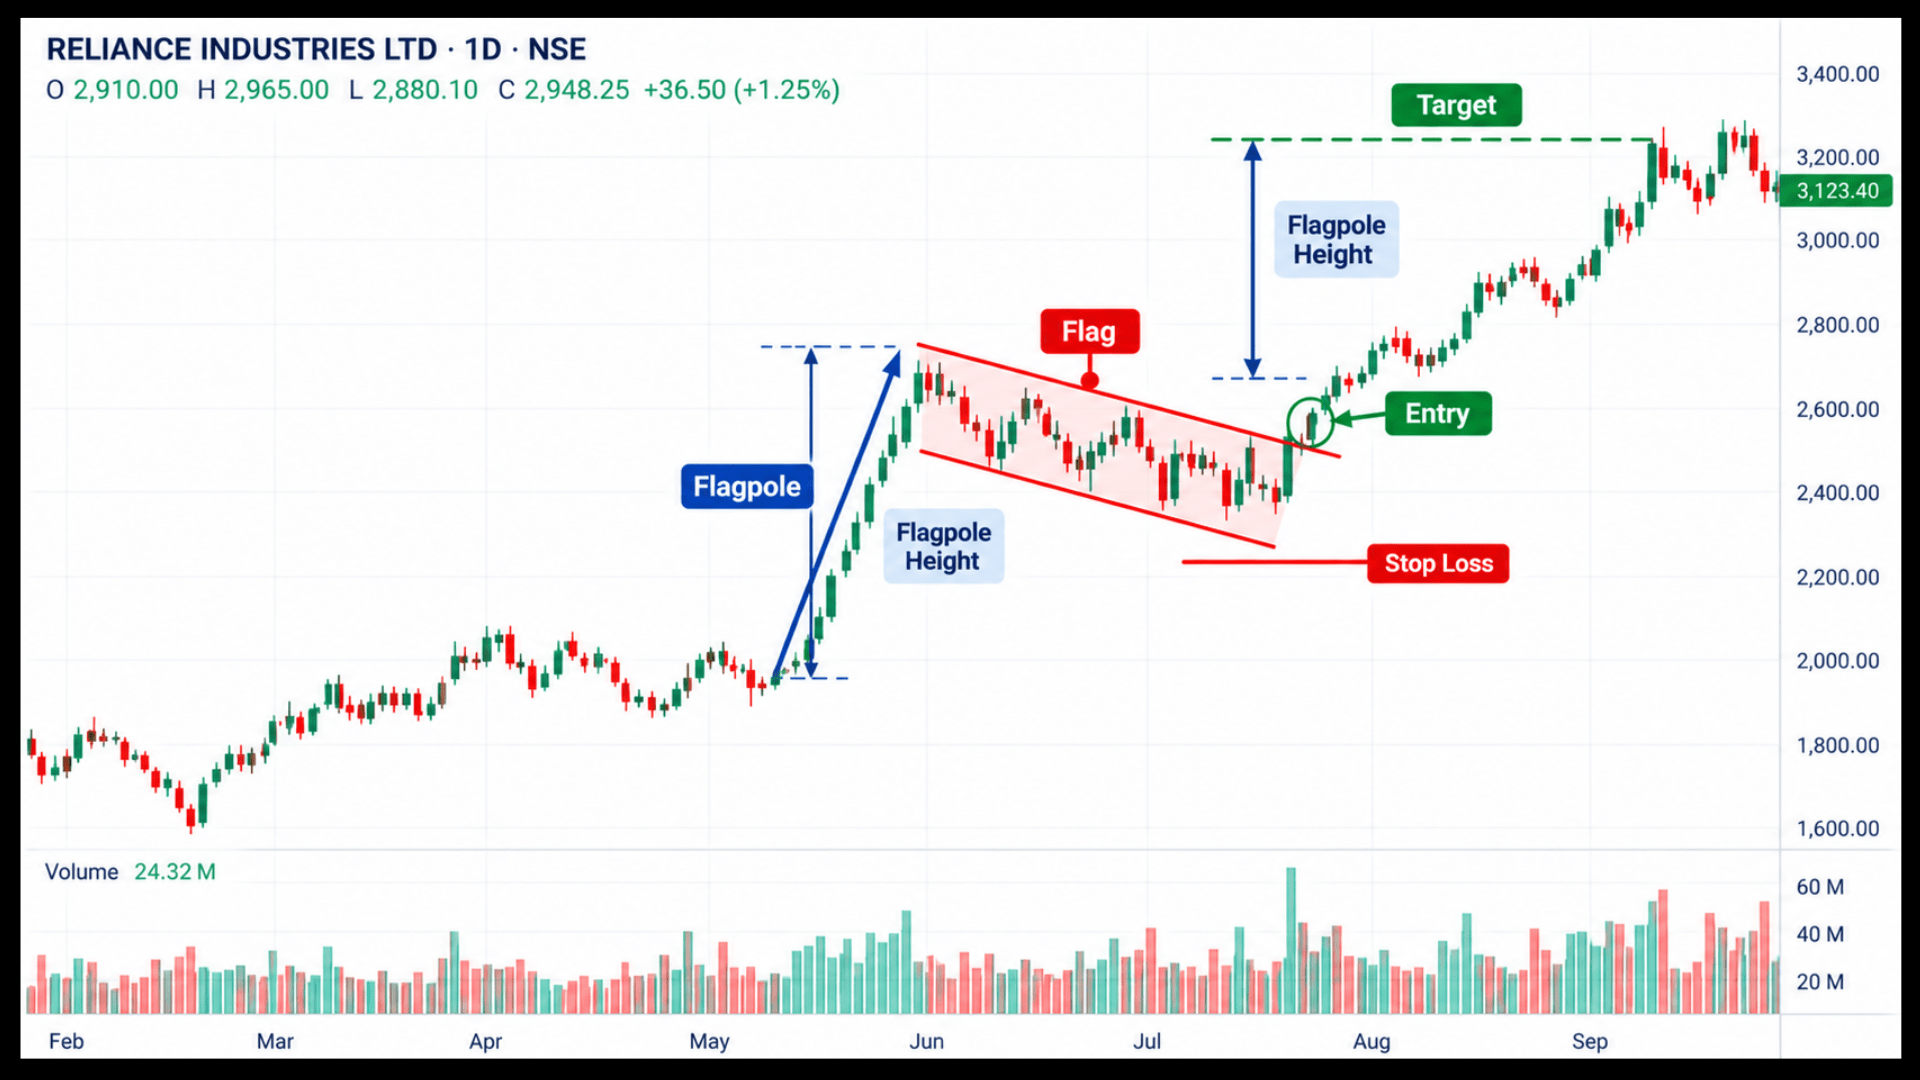
Your stop sits at ₹229, just below the flag low. Therefore, risk is ₹11 per share.
The measured target is ₹240 plus ₹40, or ₹280. That is ₹40 of reward, around 3.6 times your risk.
Why Is Volume Important in a Flag and Pennant Pattern Breakout?
Volume tells you whether the pause is healthy. In short, a good flag looks quiet, then wakes up.
First, volume should shrink while price consolidates. That shows sellers are not rushing in.
It should then expand on the breakout.
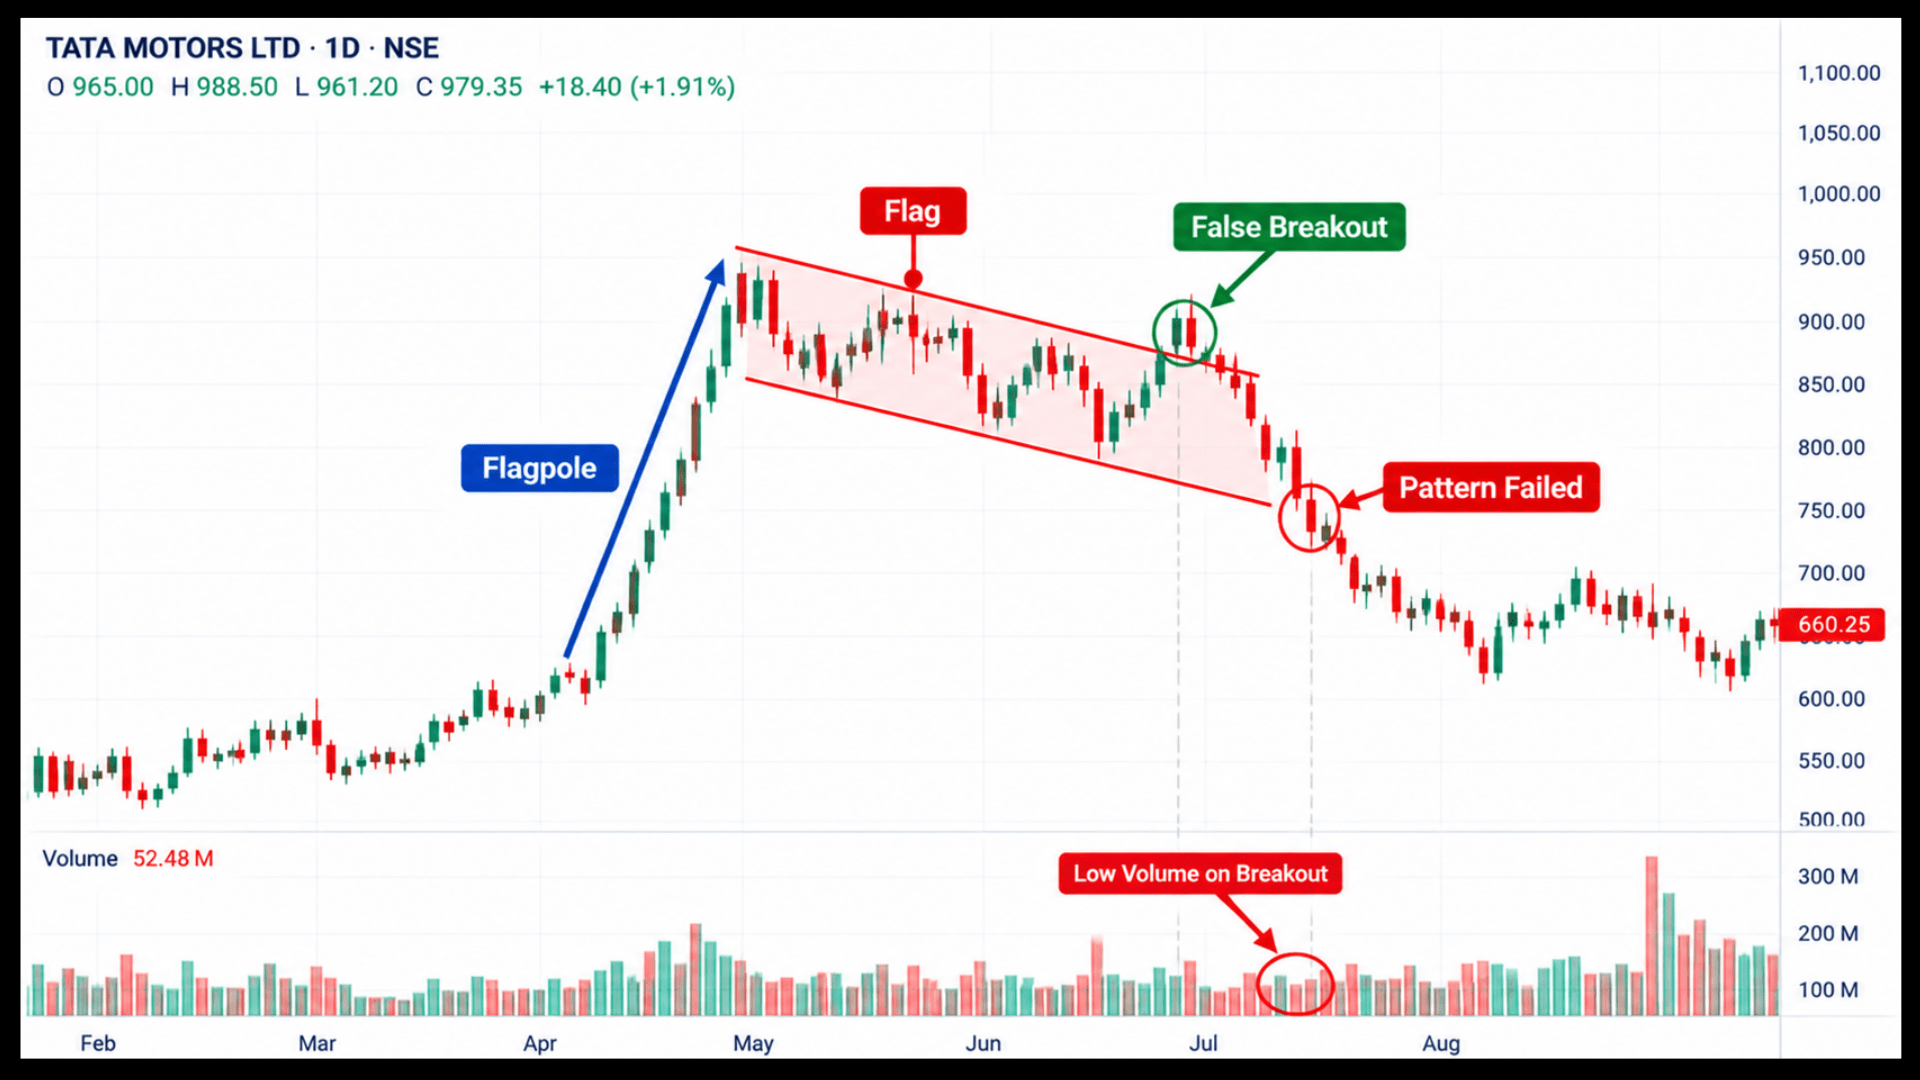
However, a breakout on weak volume is a warning. As a result, many of these fail and slide back into the pattern.
The same logic applies to bigger continuation patterns like the one in our cup and handle swing trading strategy.
Why Does a Flag and Pennant Pattern Fail?
Flags fail when the move behind them was never strong. In fact, most failures trace back to the pole or the volume.
Watch for these failure signs.
- The pause drags on for many weeks, so momentum fades.
- Price retraces most of the flagpole.
- The breakout candle closes back inside the pattern.
- The breakout comes on thin volume.
A failed flag can also turn into a reversal. Our guide on double top and double bottom patterns shows how those shapes form.
Flag Pattern vs Wedge Pattern vs Rectangle Pattern
Several continuation patterns look alike. However, the slope and shape of the pause tell them apart.
A flag has parallel lines that tilt against the trend. In contrast, a wedge has converging lines that both slope the same way.
Similarly, our guide on symmetrical triangle pattern trading highlights how contracting trendlines form a neutral consolidation phase before the primary trend resumes.
If you want to diversify your technical approach, exploring a wedge pattern trading strategy helps traders spot similar compression phases where price boundaries contract before the primary trend resumes.
Finally, a rectangle has flat, horizontal lines. It is a wider, slower pause.
Want to Trade Continuation Patterns With Live Guidance?
Spotting a flag after the breakout is easy. Judging one while it is still forming is the skill.
Our online technical analysis classes walk through patterns like this live, on real Indian stocks.
Conclusion
Flags and pennants show a strong move taking a breath. The pole shows the strength, and the quiet pause shows the market is not selling hard.
For instance, our guide on descending triangle pattern trading outlines how consolidation zones develop before a major price direction is confirmed.
Wait for a breakout close on rising volume, place your stop beyond the pause, and measure the pole for a target.
Skip the setup when the pole is weak, the pullback is deep or the pause drags on.
A flag works because the trend behind it is strong. Without that strength, you are only trading a shape.
Frequently Asked Questions
Before investing capital, invest your time in learning Stock Market.
Fill in the basic details below and a callback will be arranged for more information: