



A rectangle pattern trading strategy starts with a stock that goes nowhere for weeks. It bounces between the same two prices again and again, and it feels like nothing is happening.
Something is happening, though. Energy is building. The rectangle pattern is how that quiet range often ends in a clear move.
This guide covers how to spot a rectangle, how to trade the breakout, and how to avoid the fakeouts that catch many traders.
What Is a Rectangle Pattern? Trading Strategy & Rules
A rectangle forms when price moves sideways between two flat lines. The top line is resistance. The bottom line is support.
It is also called a trading range or consolidation. Buyers defend the floor. Sellers defend the ceiling. Neither side wins for a while.
Most rectangles continue the trend that came before. Some reverse it. A reversal can look like a double top and double bottom pattern, so the break tells you which one you have.
Difference Between Rectangle, Triangle & Flag Pattern
Several patterns pause a trend. The shape of the pause tells them apart.
Here is a quick comparison.
| Feature | Rectangle | Triangle | Flag |
|---|---|---|---|
| Top line | Flat | Sloped or flat | Sloped, parallel |
| Bottom line | Flat | Sloped or flat | Sloped, parallel |
| Length | Weeks to months | Weeks to months | A few days to weeks |
| Bias | Follows prior trend | Depends on type | Follows the flagpole |
A flat ceiling with a rising floor is a different setup, explained in ascending triangle pattern trading.
How Does a Rectangle Pattern Form Using a Rectangle Pattern Trading Strategy?
A rectangle builds through repeated tests of the same two levels. More tests make the levels stronger.
Here are the stages.
- Price moves in a trend and then stalls.
- It hits a ceiling and falls back.
- It finds a floor and bounces.
- It repeats between the same two levels.
- It breaks out through one of them.
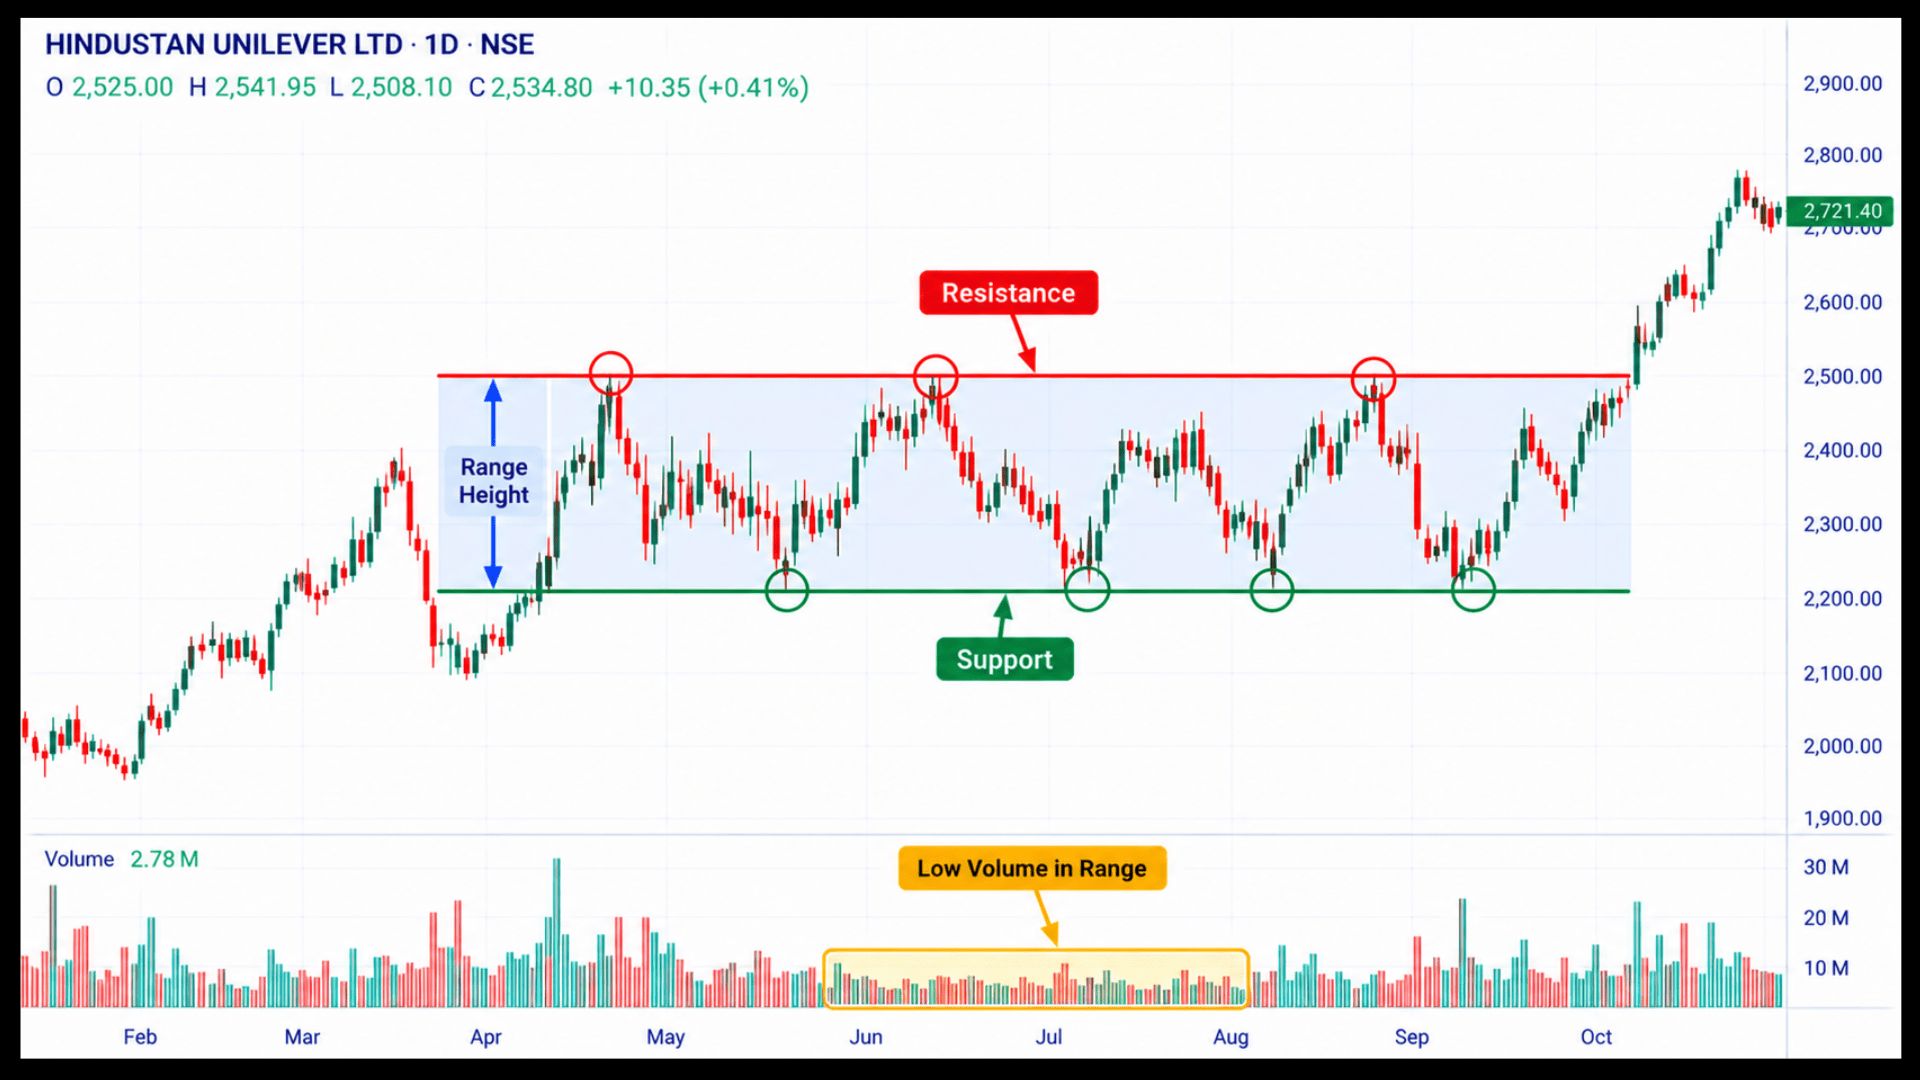
You need at least two touches on the top and two on the bottom. Volume should shrink inside the range, then expand on the break.
Rectangles are one of several shapes in our overview of swing trading patterns.
Rectangle Pattern Trading Strategy: How to Verify Your Range Before Trading
A messy range is not a rectangle. Real rectangles meet clear rules.
A sloping ceiling over a flat floor is another shape, covered in descending triangle pattern trading.
Use this checklist:
- Two flat, horizontal levels you can draw clearly.
- At least two touches on each level.
- The range lasts several weeks, not just a few days.
- Volume contracts inside the range.
- The levels matter. They are old highs or lows, not random numbers.
Clean levels are the foundation. If you need practice drawing them
Rectangle Pattern Breakout Strategy: Entry, Stop Loss and Target
Plan three levels before the break. That keeps you calm when price moves fast.
Here is a simple rule set for an upside breakout. Flip it for a downside break.
- Entry: buy when a candle closes above the top line on rising volume. A safer option is a retest of the old resistance from above.
- Stop loss: place it back inside the rectangle, near its midpoint, or just under the broken line after a retest.
- Target: measure the height of the rectangle. Add that distance to the breakout point.
A downside break needs futures or put options for a multi-day trade, since the Indian cash market does not allow overnight shorts. Our post on positional trading strategy shows how longer holds fit this kind of breakout.
How Does a Rectangle Breakout Trade Work in the Stock Market?
The example below puts the entry, stop and target rules into actual prices. These figures are illustrative and are not a recommendation.
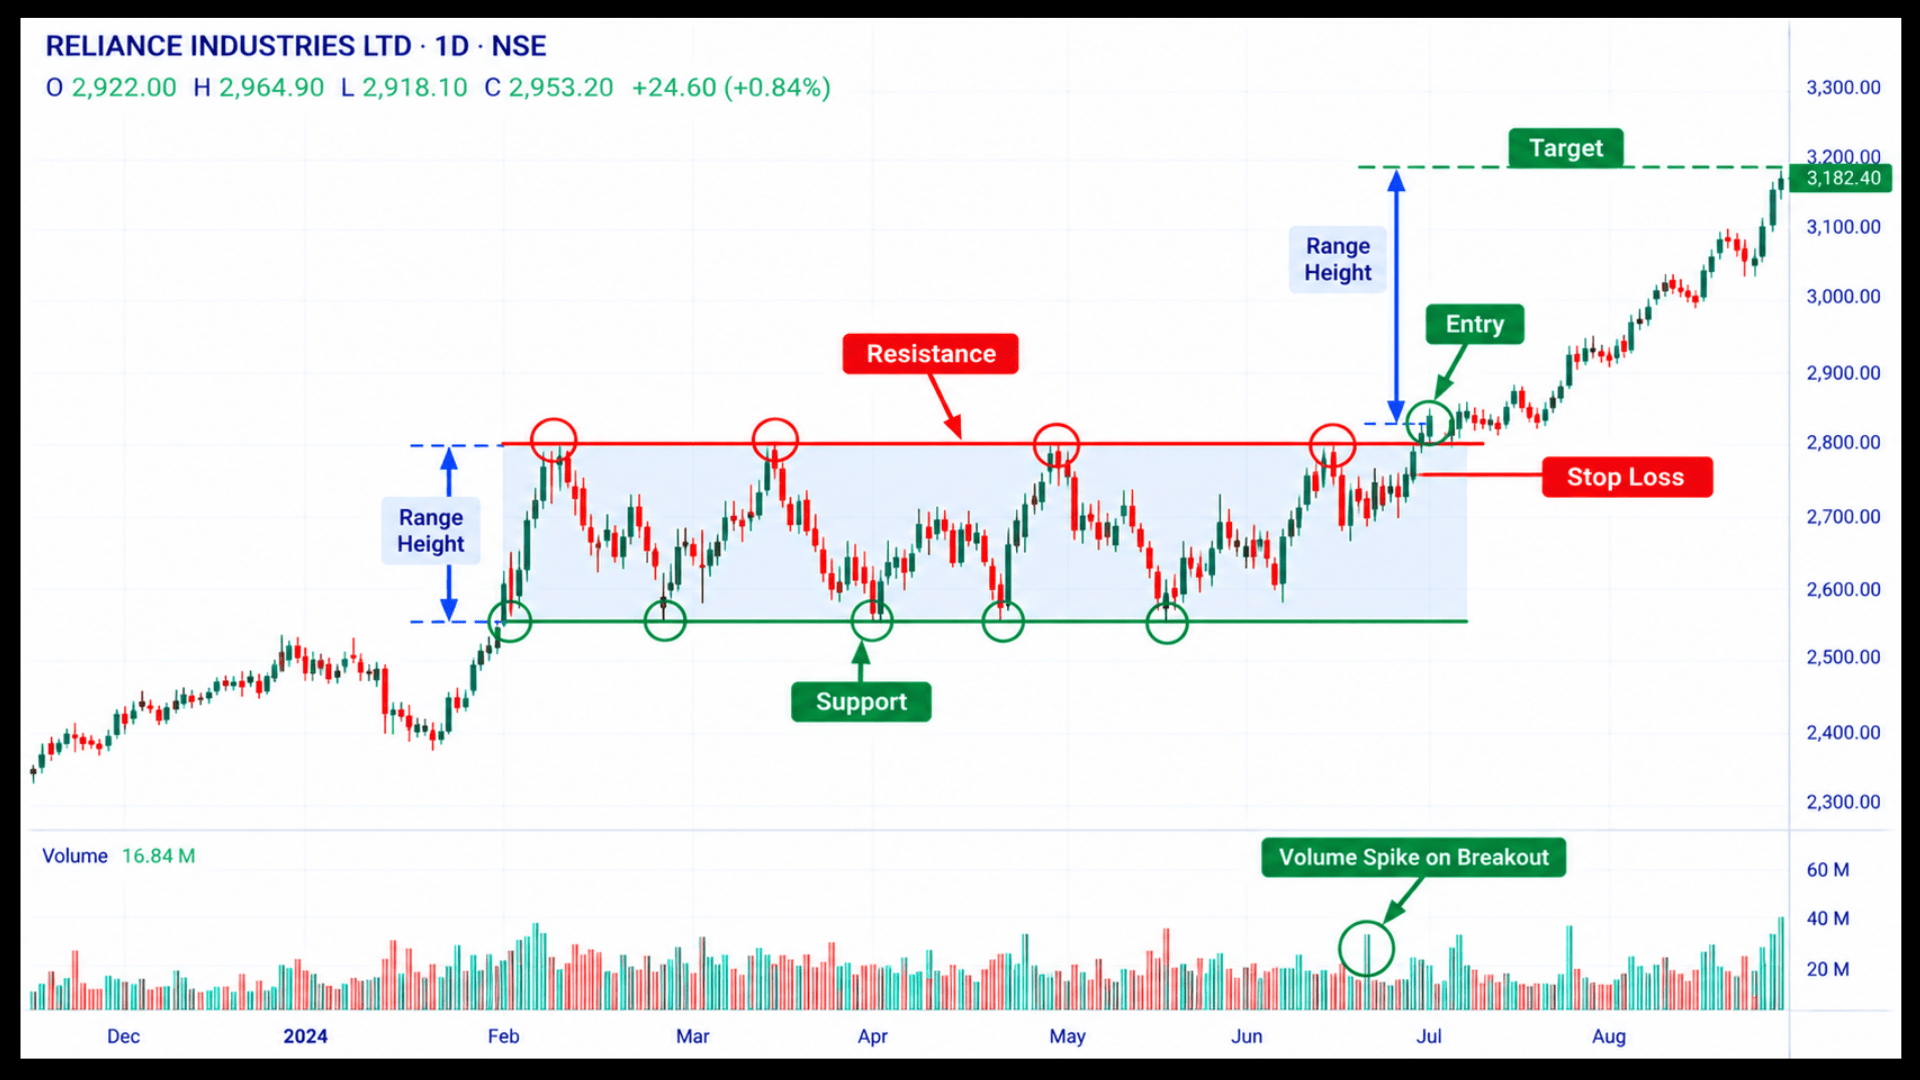
A stock trades between ₹300 and ₹340 for eleven weeks. It touches each level at least three times. The rectangle is ₹40 tall.
Price closes at ₹343 on volume nearly double the average. You buy at ₹345.
Your stop goes at ₹320, near the middle of the range. Risk is ₹25 per share.
The target is ₹345 plus ₹40, or ₹385. That is ₹40 of reward, around 1.6 times your risk.
A tighter stop below the old resistance after a retest improves the ratio, but the retest may not arrive.
Which Timeframe Works Best for Rectangle Patterns?
Rectangles work on every timeframe, but the daily and weekly charts are the most reliable.
A range that lasts several months on the weekly chart usually matters more than a range that lasts a few days on the hourly chart. More traders have watched those levels. More orders sit near them.
When the two lines slope toward each other instead of staying flat, you are looking at symmetrical triangle pattern trading.
A longer range also tends to lead to a bigger move once it breaks. That is a tendency, not a rule. Always confirm with a close and volume.
Rectangle Pattern Trading Strategy: Should You Trade Inside the Range or Wait for the Breakout?
Yes, you can trade inside the rectangle, but it needs discipline. You buy near the floor and sell near the ceiling.
The risk to reward is often poor. The range may be narrow, and a breakout can hit your stop. Many traders skip the range and wait for the break instead.
If you trade inside the range, keep stops tight and stay ready to exit the moment a line breaks.
For a wider look at how patterns, trend and volume fit together, read our guide to swing trading with technical analysis.
Why Rectangle Breakouts Fail in a Rectangle Pattern Trading Strategy?
Rectangles produce many false breakouts. Price pokes through a line, tempts buyers or sellers, then reverses. Traders call these fakeouts.
Watch for these warning signs.
- The breakout candle closes back inside the range within a few sessions.
- The breakout comes on weak volume.
- Price breaks out against a strong larger trend.
- The market as a whole is moving the other way.
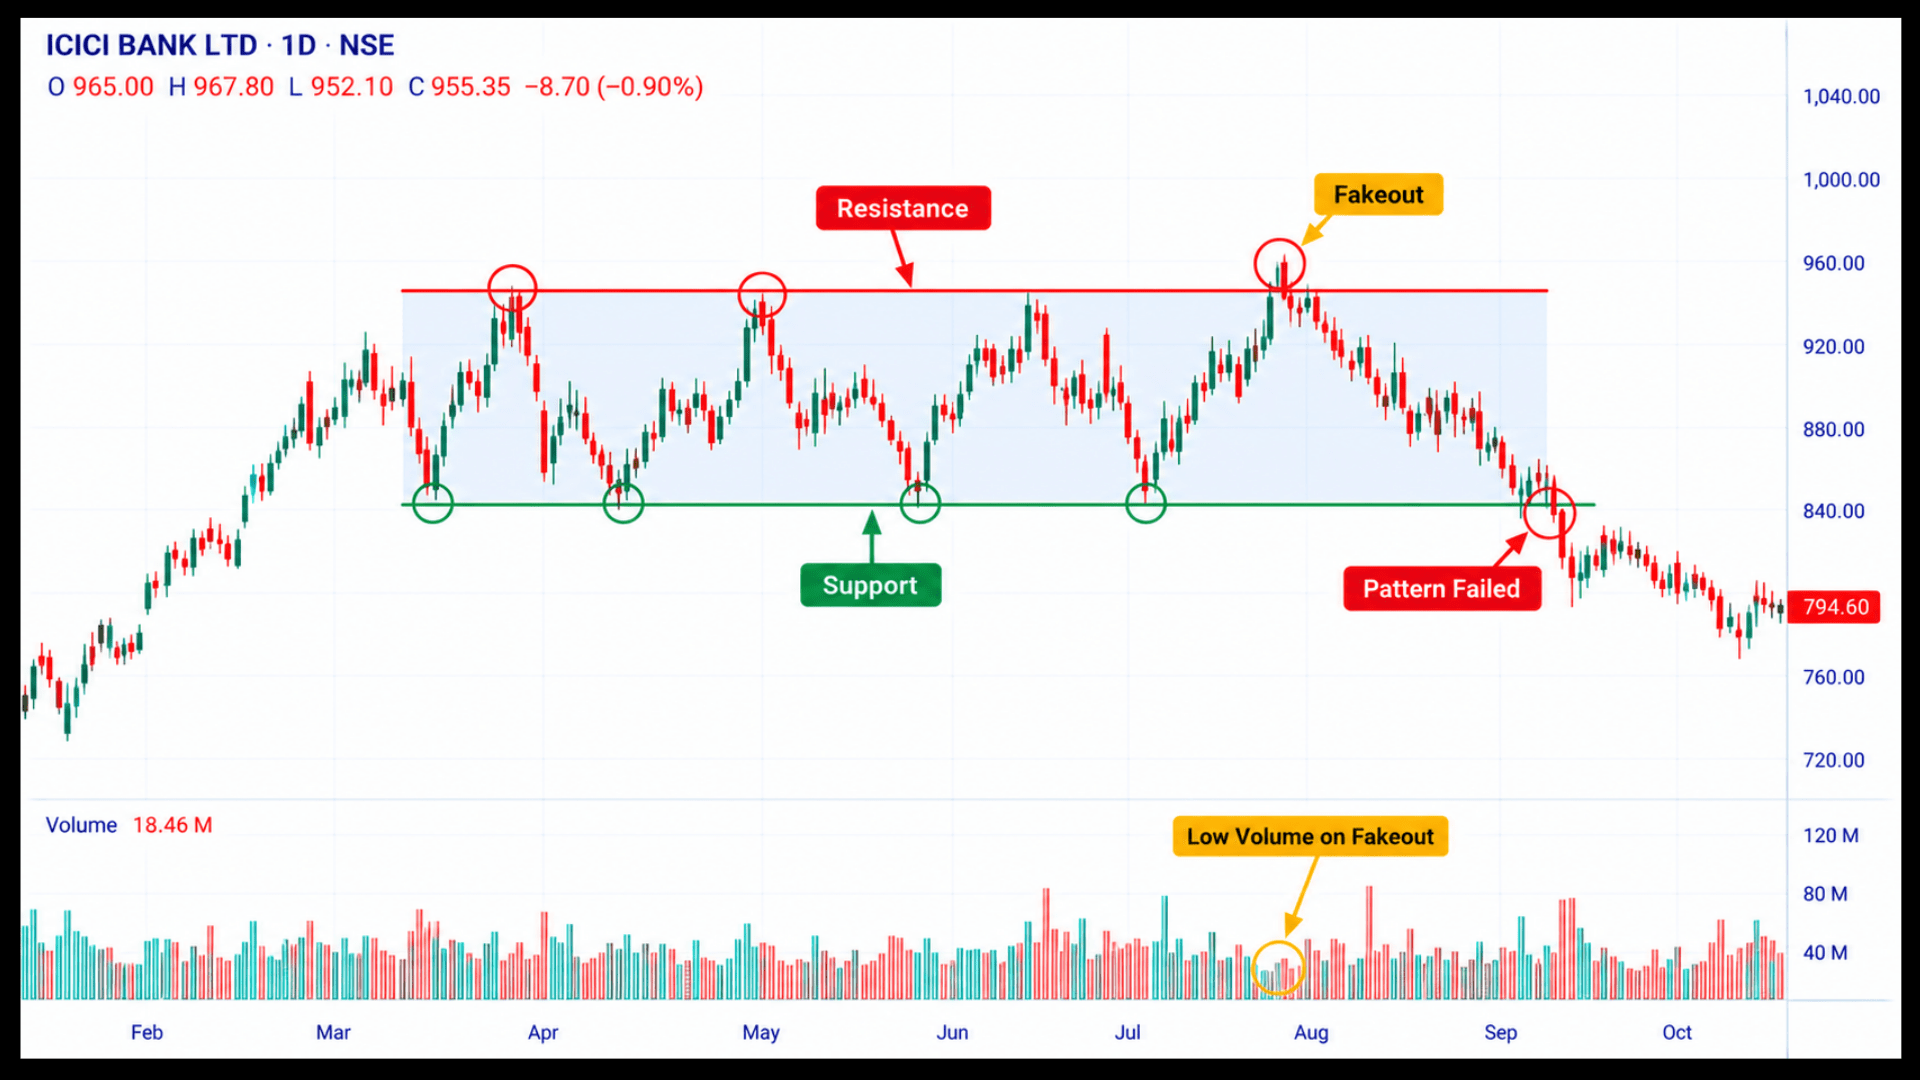
Narrowing, slanted ranges such as a wedge pattern can also trap traders in the same way, so check the slope of both lines.
Rectangle Pattern Trading Strategy: Comparing Rectangle and Flag Speed
A flag is a short, tilted pause after a sharp move. A rectangle is a wider, flatter pause. Both continue the trend, but at different speeds.
Our guide on flag and pennant pattern trading covers the faster version of this idea.
Want to Trade Range Breakouts With Live Guidance?
Drawing a rectangle on a finished chart is easy. Waiting patiently through the quiet weeks is the hard part.
Our online technical analysis classes teach this live, on real Indian stocks.
Conclusion
A rectangle shows a market in balance, with two clear lines to watch. When one breaks, the move can be clean because the levels are so obvious.
Wait for a close beyond the line, confirm with volume, and place your stop back inside the range. Measure the height for a target. Skip rectangles that break on thin volume.
Fakeouts are common, so a retest or a second confirming candle is often worth the small cost in entry price. Treat every target as a guide, not a promise.
Frequently Asked Questions
Before investing capital, invest your time in learning Stock Market.
Fill in the basic details below and a callback will be arranged for more information: