
Markets rarely move in straight lines. They stretch, hesitate, shake out weak hands, and then surge again.
One pattern that captures this messy behavior surprisingly well is the Elliott wave expanding triangle.
Unlike regular triangles, where price compresses, this one does the opposite. Each swing becomes wider than the previous one. Volatility expands. Price looks chaotic, yet it follows a clear wave structure.
Traders who understand this formation often treat it as a warning sign. The market is not trending cleanly. It is struggling with direction before the next move appears.
In Elliott Wave Theory, expanding triangles usually appear in corrective phases, especially wave B or wave 4.
Let’s understand the concept of the Elliott wave expanding triangle in detail.
What Is An Expanding Triangle?
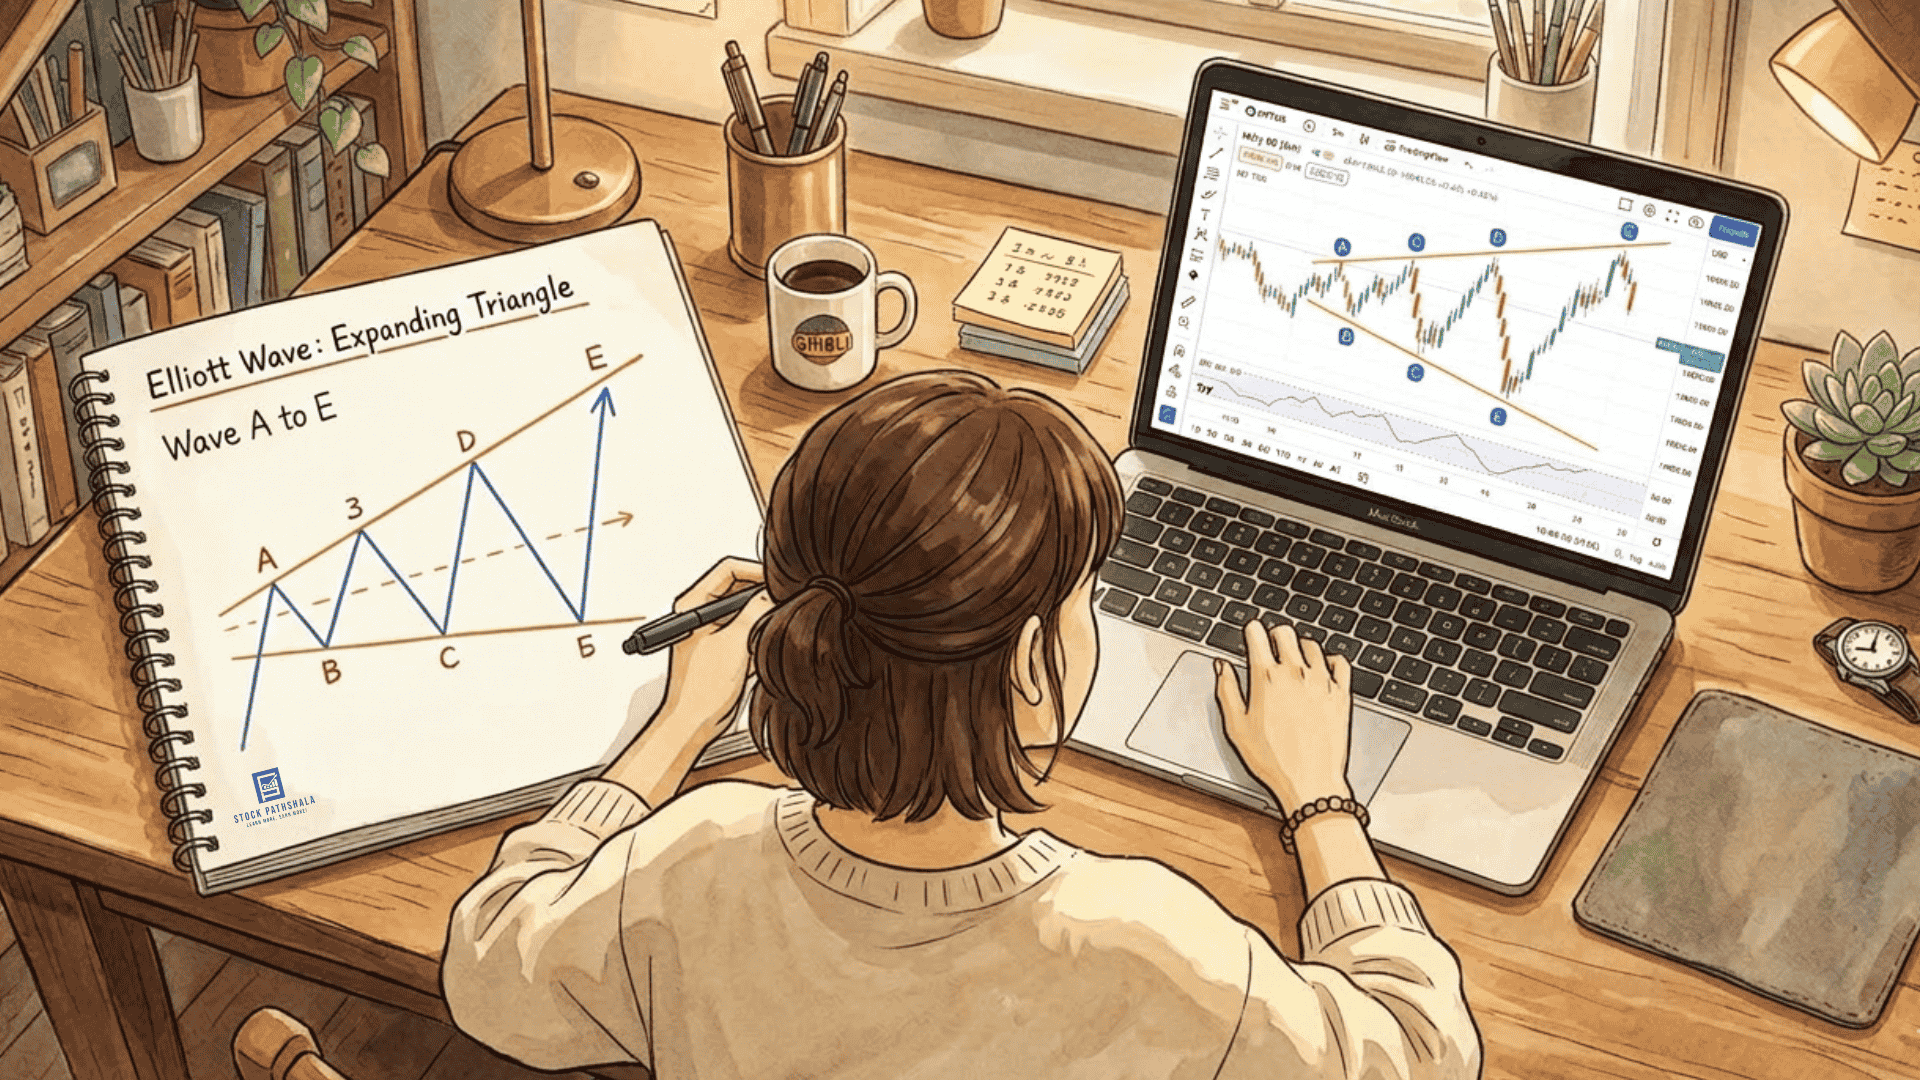
An expanding triangle is a five-wave corrective pattern where price swings increase in size rather than shrinking. Instead of converging trendlines, the pattern forms diverging trendlines.
Each swing exceeds the previous one. This widening structure reflects rising volatility and growing disagreement among market participants.
Among the different corrective wave types, this is considered one of the rarest and most volatile formations.
| Wave | Direction | Key Behavior |
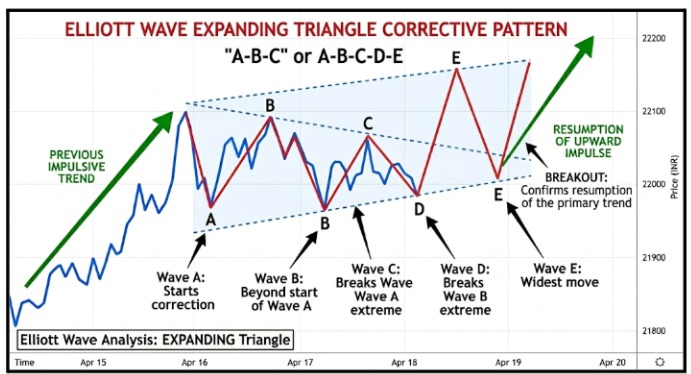
| A | First move | Starts correction |
| B | Opposite move | Goes beyond the start of wave A |
| C | Reversal | Breaks wave A extreme |
| D | Opposite move | Breaks wave B extreme |
| E | Final swing | Often the widest move |
Each wave expands the price range, making the pattern visually and structurally distinct. The result looks like a megaphone on a chart. Hence, traders sometimes call it the megaphone pattern.
To better identify and confirm this pattern on charts, traders rely on a few defining features.
Here are the key characteristics:
- Five waves labeled A B C D E
- Each wave is larger than the previous one
- Diverging trendlines
- Appears during market indecision
An Elliott wave expanding triangle has a strict internal structure of 3-3-3-3-3; each wave A, B, C, D, and E is composed of a three-wave corrective pattern, typically a zigzag.
Expanding Triangle In Elliott Wave Analysis
In Elliott Wave analysis, the expanding triangle is not just a visual pattern; it plays a specific role in the wave cycle. It most commonly appears in Wave 4 of an impulse or Wave B of a corrective phase.
Traders read this structure as a sign of growing volatility and weak trend control.
Price is not consolidating quietly; it is expanding with larger swings, which often shake out weak positions.
From a practical standpoint:
- It signals that the market is corrective, not trending strongly.
- It often precedes a final breakout or continuation move.
- The best trades usually come after Wave E completes, not during the formation.
In short, within Elliott Wave Theory, an expanding triangle reflects a correction before direction returns, making patience more valuable than early entries.
Elliott Wave Expanding Triangle Pattern Structure
The Elliott wave expanding triangle pattern is made up of five waves that keep switching direction, almost like a tug of war that keeps getting wider.
A simple structure looks like this:
| Wave | Description |
| A | First corrective move |
| B | Breaks start of wave A |
| C | Breaks wave A extreme |
| D | Breaks wave B extreme |
| E | Final widening move |
When you first spot an expanding triangle, its structure immediately feels different from typical consolidation patterns.
Two things really stand out when you look at this pattern on a chart:
- Every new wave pushes beyond the previous high or low.
- Volatility doesn’t stay steady; it keeps increasing with each swing.
Because of this, the price starts to stretch out, forming a widening structure. On a real chart, traders often notice bigger and bigger swings that resemble a megaphone shape.
Elliott Wave Expanding Triangle Rules
Patterns only make sense when they stick to certain rules. Without them, it’s just random price movement.
To keep these rules handy during live trading, many practitioners keep an Elliott Wave theory cheat sheet near their desk.
The key rules for a valid Elliott wave triangle pattern are:
- Five waves must form A B C D E.
- Waves should keep alternating direction.
- Each new wave must move beyond the previous extreme.
- Wave E usually marks the end of the pattern.
- Internal waves often form corrective structures rather than impulsive ones.
Structural Checklist Traders Use:
| Rule | Explanation |
| Diverging trendlines | Upper and lower boundaries keep expanding |
| Five wave sequence | A B C D E |
| Increasing volatility | Price swings become wider over time |
| Corrective nature | Typically not part of strong impulsive trends |
If even one of these conditions is missing, there’s a good chance the pattern isn’t a true expanding triangle.
In such cases, it’s better to reassess the wave count rather than force the pattern onto the chart.
Wave Specific Rules For Validating The Pattern
General characteristics can be used to determine the structure, but the traders use wave-specific rules to determine whether a pattern is an Elliott wave expanding triangle pattern or just a turbulent price range.
These are laws that deal with the behavior of each wave in comparison to the others.
Wave By Wave Validation Rules:
| Wave Rule | Explanation |
| Wave B Retracement | Wave B must retrace more than 70% of Wave A, but it should remain less than twice the size of Wave A. |
| Wave C Expansion | Wave C must extend beyond the price length of Wave B. |
| Wave D Expansion | Wave D must move further than Wave C, widening the pattern. |
| Wave E Expansion | Wave E typically becomes the largest wave, completing the structure. |
Another structural check involves the trendlines.
When traders draw lines between A and C and B and D, those lines have to be divergent, and this confirms the megaphone shape characteristic of the Elliott wave expanding triangle.
Elliott Wave Expanding Triangle Formula
No rigid mathematical formula is used, but traders have an Elliott wave expanding triangle formula that is based on Fibonacci relationships, which is applied practically.
Typical guidelines include:
| Wave Relationship | Fibonacci/Extension Range | Notes |
| Wave B vs Wave A | 1.236 to 1.618 × Wave A | Wave B must exceed Wave A; retracement typically >70% |
| Wave C vs Wave B | 1.236 to 1.618 × Wave B | Each wave grows progressively larger |
| Wave D vs Wave C | 1.236 to 1.618 × Wave C | Maintains an expanding structure |
| Wave E vs Wave D | Frequently the longest | Wave E often extends the most, completing the megaphone shape |
The idea is simple. Each wave stretches the structure further. Many traders confirm these projections using Fibonacci extension tools on platforms like TradingView or MetaTrader.
Elliott Wave Expanding Triangle Example
Let us understand the Elliott wave expanding triangle with the help of a chart.
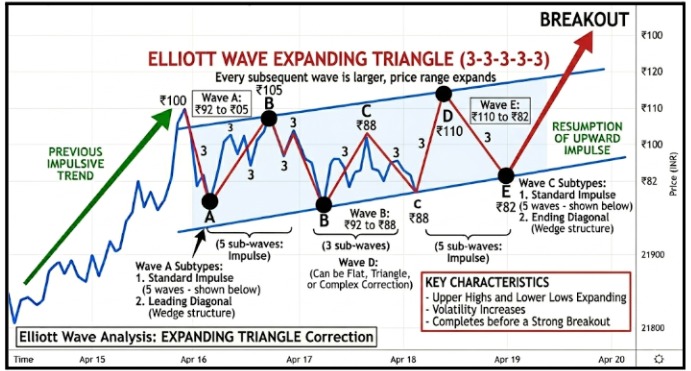
Consider the above stock trading at around ₹100. A possible Elliott wave expanding triangle example might unfold like this:
| Wave | Price Move |
| A | ₹100 to ₹92 |
| B | ₹92 to ₹105 |
| C | ₹105 to ₹88 |
| D | ₹88 to ₹110 |
| E | ₹110 to ₹82 |
You’ll notice each wave starts stretching a bit more than the last, highs push higher, lows dip lower, and the whole range expands.
Once Wave E wraps up, price usually doesn’t hang around for long; it tends to break out sharply, often continuing in the direction of the earlier trend.
Is A Triangle Bullish Or Bearish?
Many traders wonder, is a triangle bullish or bearish? The honest answer is, it can be both. A triangle is not really about direction on its own; it’s more about continuation.
What matters most is what the market was doing before the triangle showed up.
- If the trend is moving up, the triangle usually breaks out upward.
- If the trend is moving down, it often continues lower.
So instead of labeling the pattern as bullish or bearish, traders look at the bigger picture. In an expanding triangle, especially, price tends to follow the direction of the prior trend.
In simple terms, the triangle is just a pause, not a decision maker. The real clue lies in the trend that came before it.
Expanding Triangle Correction In Real Trading
An expanding triangle correction commonly appears during wave 4. The market pauses before the final wave 5 rally or drop.
Typical scenario:
- Strong impulse move
- Expanding triangle correction forms
- Final impulse wave begins
However, expanding triangles can feel uncomfortable to trade. Price swings are wide. Stop losses get tested.
Why are Expanding Triangles Difficult to Trade Mid-Pattern?
The Elliott wave expanding triangle is much rarer than the common contracting triangle, which makes early identification tricky.
When traders think they see one forming, it often turns out to be something else until the full five-wave structure appears.
Each wave grows larger, so earlier trade entries frequently get invalidated by the next wider swing.
For this reason, most experienced traders wait for wave E completion, since trading inside the pattern often leads to repeated shakeouts and misleading signals.
Practical Trading Tips For Expanding Triangles
Instead of guessing inside the pattern, many traders follow simple, rule-based tactics to stay disciplined. This approach helps reduce emotional decisions during volatile and unpredictable price swings.
Follow a structured plan instead of reacting to random price swings.
Here is a great trading approach to follow:
- Wait for wave E completion.
- Look for trend continuation breakout.
- Use conservative position size.
Always assess overall market volatility before taking any trade.
Here are some risk management strategies:
| Strategy | Reason |
| Smaller position size | High volatility |
| Wider stop loss | Large price swings |
| Confirmation signals | Avoid false breakouts |
To improve accuracy and avoid false signals, traders often add confirmation tools alongside the pattern.
Some traders combine the pattern with indicators such as:
- RSI divergence
- Volume spikes
- Fibonacci extensions
The goal is not prediction; the goal is preparation. Focus on reacting to confirmed price action rather than anticipating uncertain moves.
Conclusion
The Elliott wave expanding triangle is, in most cases, messy, emotional, and unpredictable. But there is some familiar framework under that volatility.
Understanding its rules, wave relationships, and real market behavior helps traders avoid confusion. More importantly, it prepares them for the breakout that usually follows.
Markets rarely move politely, but sometimes they shout before they move. The expanding triangle is one of those moments.
If you want to learn how to identify patterns like the Elliott wave expanding triangle in real time, then join our stock market live classes, where these structures are explained using live charts and step-by-step breakdowns.
Q1: How Reliable Is The Expanding Triangle Pattern?
Ans: It is less common than regular triangles, but still valid in Elliott Wave analysis. Reliability improves when it appears in wave 4 or wave B corrections.
Q2: When Should Traders Enter A Trade In An Expanding Triangle?
Ans: Most traders wait for wave E to finish and then enter after a confirmed breakout in the direction of the prior trend.
Q3: Can An Expanding Triangle Appear In Any Market?
Ans: Yes. The Elliott wave expanding triangle pattern can appear in stocks, forex, commodities, and crypto markets. It is not tied to a specific asset.
Before investing capital, invest your time in learning Stock Market.
Fill in the basic details below and a callback will be arranged for more information:


