

Markets don’t move randomly. They move in patterns driven by crowd psychology.
The Elliott Wave Rules help traders read these patterns and anticipate future price moves with structure, not guesswork.
At first glance, wave counting may feel confusing. However, if you understand the guidelines, charts start to make more sense.
Trends, pullbacks, and reversals begin to construct a logical series.
What Are The Rules of Elliott Wave Theory?
Before we get into the setups, let’s address the basic question: What are the rules for Elliot wave? These rules specify how waves should behave. Without them, wave counting is subjective.
Core Elliott Wave Rules:
There are three non-negotiable rules in Elliott Wave Theory:
- Rule 1: Wave 2 will never retrace more than 100% of Wave 1.
- Rule 2: Wave 3 is never the shortest of Waves 1, 3, or 5.
- Rule 3: Wave 4 does not approach the pricing range of Wave 1.
These same rules apply to every timeframe. A 5-wave structure on the daily chart contains its own 5-wave structure on the hourly chart.
This is why Elliott Wave rules work equally on short-term and long-term charts.
Why Do These Rules Matter?
Rules eliminate subjectivity. Without them, each trader would use a different label for the same chart. With rules, you minimize uncertainty and focus solely on valid setups.
Elliott Wave Guidelines
Many traders misinterpret Elliott Wave rules and guidelines, which causes difficulty in practical trading.
Understanding the distinction is critical because one defines structure and the other adds unforeseen events.
Here are some key Elliott wave guidelines to follow:
- Rule of alternation (Wave 2 and 4 differ in form)
- Equality of waves (Wave 5 often equals Wave 1)
- Channelling technique for price projection
Key Takeaways:
- Rules are strict. If broken, the wave count is invalid
- Guidelines help improve accuracy, but may fail in some cases
- Treat guidelines as supporting tools, not confirmation.
Separating rules from guidelines improves clarity and avoids misinterpretation.
It also helps traders maintain discipline and avoid applying wrong wave counts.
What are Impulse Waves in Elliott Wave?
Now that the rules have been established, let us expand on them. The trend is driven by impulse wave pattern, which are five-wave structures that move prices in the direction of a broader cycle.
This specific Elliott wave chart pattern consists of five waves that move in the same direction as the main trend.
Structure Of Impulse Waves:
- Wave 1: Initial move
- Wave 2: Pullback
- Wave 3: Strongest move
- Wave 4: Correction
- Wave 5: Final push
Key Elliott Wave Rules In Impulse:
- Wave 3 is usually the strongest and most extended
- Wave 2 often retraces deeply
- Wave 4 tends to be shallow
Example:
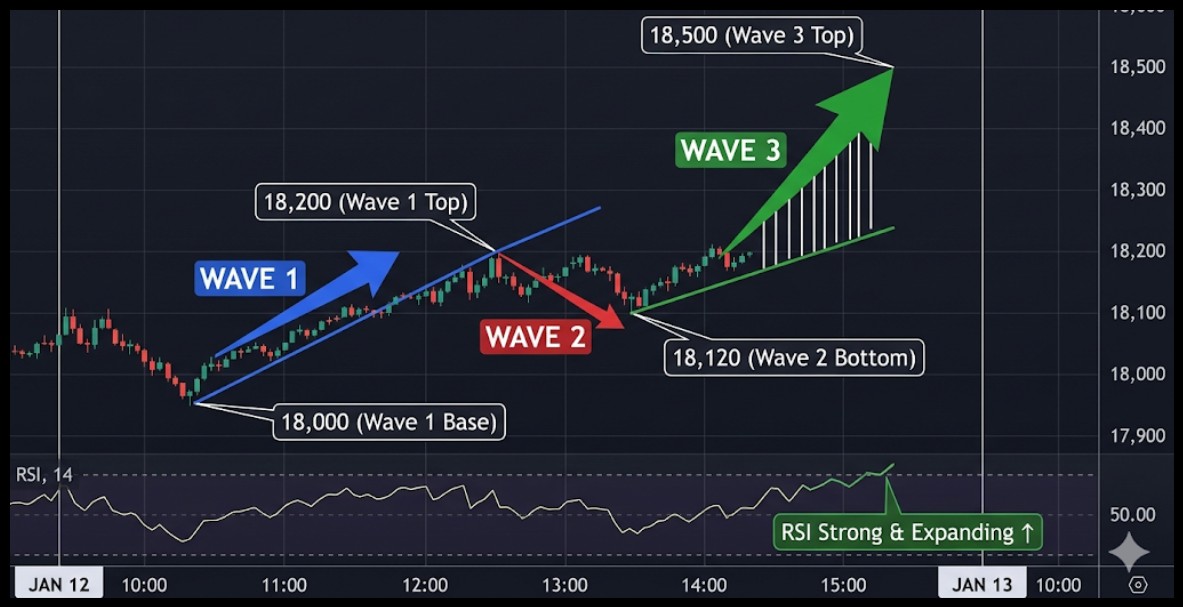
- Nifty moves from 18,000 to 18,200 (Wave 1)
- Pulls back to 18,120 (Wave 2)
- Rallies to 18,500 (Wave 3)
Wave 3 shows strong momentum. Wave 3 is where most traders look to enter. But impulse waves don’t last forever; corrections follow.
That brings us to the Fibonacci rules and corrections.
Fibonacci Rules For Each Wave
Understanding wave structure is only half of the work. To trade Elliott Waves properly, you’ll need measuring tools, which is where Fibonacci ratios come in.
These Elliott wave calculations aid in validating wave counts and projecting realistic objectives rather than guessing price movements.
Key Fibonacci Levels For Each Wave:
|
Wave |
Fibonacci Relationship |
| Wave 1 |
Base wave, no fixed ratio |
|
Wave 2 |
Retraces 50% to 61.8%, sometimes up to 76.4% of Wave 1 |
|
Wave 3 |
Extends 161.8% or more of Wave 1 |
| Wave 4 |
Retraces 23.6% to 38.2% of Wave 3 |
|
Wave 5 |
Often equals Wave 1 or reaches 61.8% of Wave 1 |
How Traders Use These Levels:
- Validate whether a wave count is correct
- Identify high-probability entry zones
- Set realistic profit targets
- Avoid entering trades at extreme levels
These Fibonacci relationships bring precision to Elliott Wave analysis. When combined with wave structure, they turn a rough idea into a structured, tradable plan.
Elliott Wave ABC Correction Rules
After a 5-wave move, markets correct in a 3-wave pattern. This is where Elliott Wave rules ABC come into play.
This phase often traps traders who mistake it for a new trend instead of a temporary pullback.
Structure Of ABC Correction:
- Wave A: Initial counter-trend move
- Wave B: Temporary pullback
- Wave C: Final correction
Elliott Wave ABC Correction Rules:
- Corrections move against the main trend
- Wave B should retrace at least 30% of Wave A
- Wave C is most likely to have a similar price length to Wave A
- The ABC correction usually targets the 61.8% retracement of the trend move
- Wave B is most likely to retrace Wave A by about 38.2%; next most likely by 50%; next most likely by 61.8%
Example:
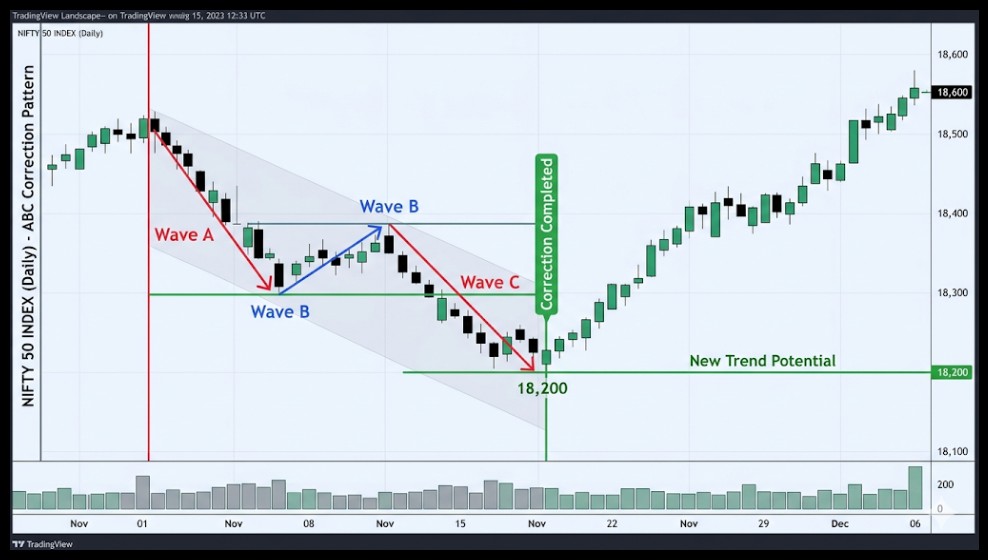
- Price drops from 18,500 to 18,300 (Wave A)
- Pulls back to 18,380 (Wave B)
- Falls again to 18,200 (Wave C)
This completes the correction. After that, a new trend may begin. Understanding corrections is critical. Many traders lose money by trading corrections like trends.
Elliott Wave Rule Of Alteration
Now comes a small yet effective guideline. The alternation guideline predicts Wave 4’s character based on what Wave 2 performed.
If Wave 2 is sharp and deep, Wave 4 will most likely be sideways and shallow. And vice versa.
Why It Matters:
- Helps anticipate the nature of corrections
- Prevents confusion between Wave 2 and Wave 4
- Improves wave counting accuracy
Example:
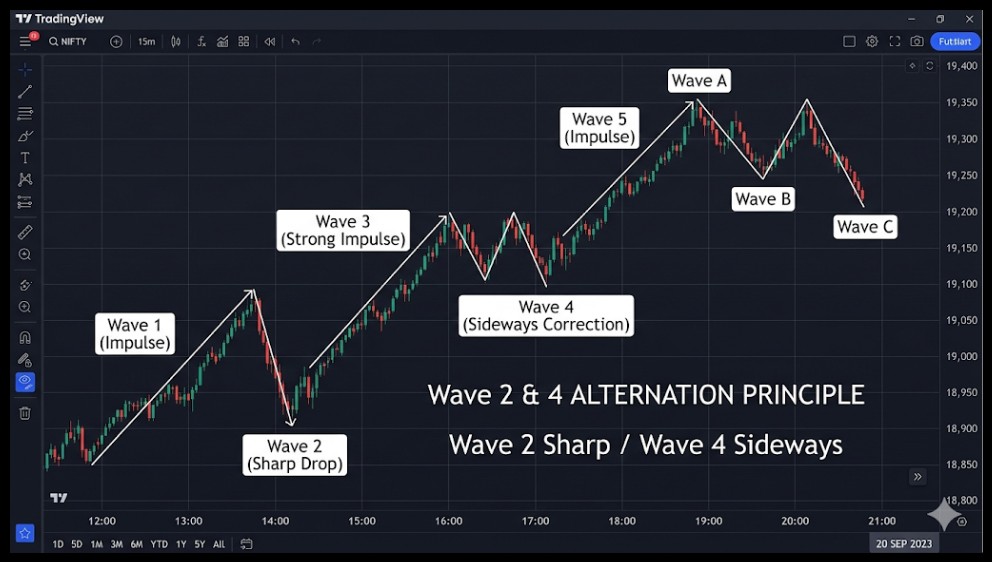
- Wave 2 drops sharply
- Wave 4 moves sideways in a range
Markets fluctuate between impulsive and sideways corrections to relieve pent-up pressure in both directions. It isn’t a rigid rule, but it’s quite dependable.
Recognizing this pattern early on will help you predict the next step rather than responding later.
Elliott Wave Rules Chart
Charts make everything clearer. A typical Elliott wave rules chart shows a 5-wave impulse followed by a 3-wave correction.
Learning how to use Elliott wave effectively starts with these visuals, as they help traders quickly identify where the market stands in the cycle and plan trades with more confidence.
What To Look For On Chart:
- Clear 5-wave upward or downward move
- Followed by ABC correction
- Strongest momentum in Wave 3
- Overlap rules respected
Chart Scenario:
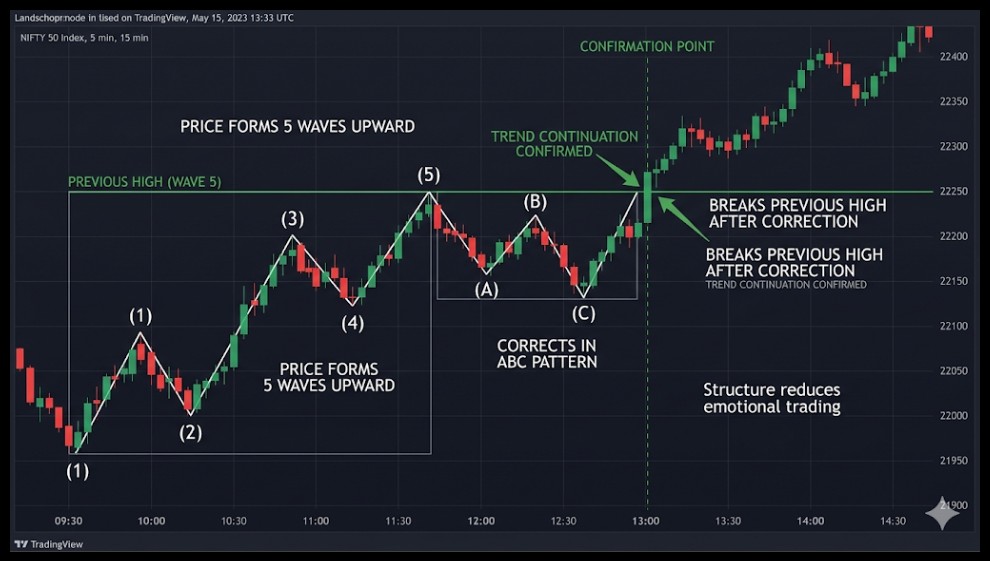
- Price forms 5 waves upward
- Then corrects in the ABC pattern
- Breaks the previous high after correction
That breakout confirms trend continuation. Charts don’t predict perfectly, but they provide structure. And structure reduces emotional trading.
Elliott Wave Rules With Examples In Real Trading
Let’s connect theory with practice. This is where traders actually apply Elliott wave rules with examples to find high-probability setups.
By using specific Elliott wave strategies for trading, such as entering at the start of a third wave or at the end of a C-wave correction, you can align your trades with the natural rhythm of the market.
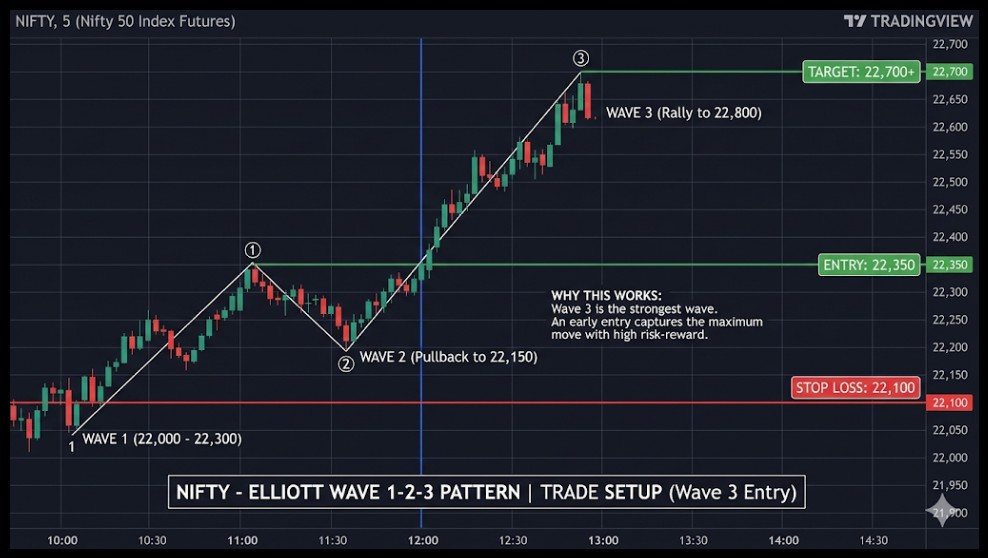
Trade Setup Example:
- Market: Bank Nifty
- Wave 1: 42,000 to 42,300
- Wave 2: Pullback to 42,150
- Wave 3: Rally to 42,800
Entry Strategy:
- Enter during early Wave 3
- Entry: 42,350
- Stop loss: 42,100
- Target: 42,700+
Why This Works: Wave three is often the strongest. Entering early in Wave 3 provides the ideal risk-reward ratio.
But here’s the truth: Not every wave count is ideal, and flexibility is essential.
Common Mistakes In Elliott Wave Guidelines
Even experienced traders make errors while applying Elliott wave guidelines. Small miscounts early in the structure can lead to completely wrong trade decisions later.
Mistakes To Avoid:
- Forcing wave counts to fit bias
- Ignoring core rules
- Trading corrections like trends
- Overcomplicating wave structure
Here is a subtle fact. Elliott Wave appears difficult, yet mistakes are generally caused by overthinking rather than a lack of information.
Keep things simple, follow the guidelines, and you’re done.
Conclusion
The Elliott Wave Rules add order to market turbulence. Traders who understand impulse waves, ABC corrections, and essential criteria such as the rule of alteration may approach charts with clarity and confidence.
No strategy is flawless, but Elliott Wave provides a foundation for properly interpreting price behavior.
When combined with risk management and patience, it becomes an effective tool for navigating trending and corrective markets.
Take your understanding further with our Elliott wave classes, where real charts and practical insights help you apply these concepts with confidence.
FAQs
Q1: How Can I Identify Wave 3 in Real Trading?
Ans: Wave 3 is often the strongest and fastest-moving wave, assisted by great volume and velocity. It often exceeds the high of Wave 1, indicating trend strength.
Q2: Can Elliott Wave Rules be Used for Intraday Trading?
Ans: Yes, Elliott Wave may be used on shorter timescales, such as 5-minute or 15-minute charts. However, shorter periods require speedier judgments and stricter risk management.
Q3: What Role Does the Alteration Rule Play in Trading?
Ans: The rule of change aids in predicting how corrections may act. If one correction is severe, the next is likely to be sideways, which increases wave counting accuracy.
Before investing capital, invest your time in learning Stock Market.
Fill in the basic details below and a callback will be arranged for more information:


