
If your trades feel random or inconsistent, the problem usually isn’t your strategy; it’s your tools. The EMA and Bollinger Band strategy gives you a clear, structured way to read the market and make more confident trading decisions.
The two indicators work well together because they do different jobs. Bollinger Bands track volatility, and EMA tracks direction.
Together, they give you a more complete picture. Bollinger Bands tell you how much the price is moving. EMA tells you which way it’s heading.
That combination helps you stay patient when the setup isn’t there and act decisively when it is. In this blog, let us discuss them in a simple way for you to understand.
Understanding Bollinger Bands With EMA
Bollinger bands consist of three parts: an upper band (middle + 2 standard deviations), a lower band (middle – 2 standard deviations), and a centre band (20-period SMA by default).
High volatility is indicated by wider bands, frequently before or during significant movements.
Narrow bands often come before a breakout, which indicates minimal volatility and consolidation.
In order to create a distinct, quicker trend signal, the EMA is stacked on top of this structure.
Because the moving average calculation for an EMA gives more weight to the most recent price data, it responds to price more quickly than the SMA middle band inside the Bollinger Bands, providing earlier directional clues.
Here’s why this combo works:
- EMA shows direction, while Bollinger Bands highlight volatility and price extremes.
- EMA reacts to price faster than a simple moving average, giving earlier signals.
- Bollinger Bands expand and contract with volatility, signalling periods of consolidation or strong moves.
For instance, a stock may offer a good purchasing opportunity if it is heading upward and the price pulls back to the EMA while hitting the lower Bollinger Band.
This context helps you avoid chasing random breakouts.
Moving Average And Bollinger Bands Strategy Basics
Volatility and trend-following are combined in the Bollinger Bands and moving average method.
Bollinger Bands draw attention to price extremes, whereas the EMA indicates the direction.
To use this effectively, you must first determine which time frame is best for trend analysis based on your goals, as a 15-minute chart might show a bullish trend while the daily chart remains bearish.
Traders often use a setup like this:
- Identify the trend with a 20-period EMA.
- Watch for Bollinger Band squeezes, which indicate low volatility.
- Trade breakouts when the price moves outside the bands in the direction of the EMA.
For instance:
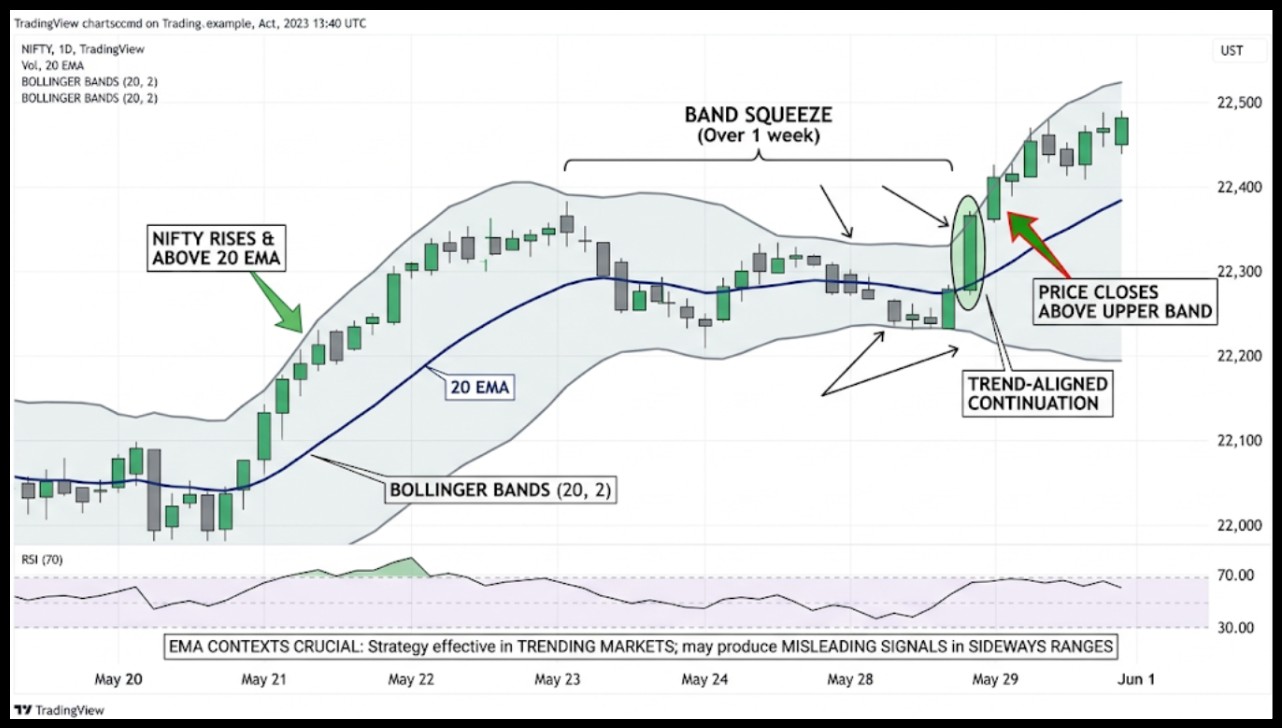
The Bank Nifty is rising, and its price is higher than the 20 EMA. Over the course of a week, the band’s contract (squeeze).
The price closes above the upper band the next day, indicating a trend-aligned trade.
This works best in trending markets. In sideways conditions, signals can be misleading.
50 EMA Crossing the Middle Bollinger Band
Many traders overlook a simple setup: the 50 EMA crossing the middle Bollinger Band.
It provides distinct entry and exit signals based on momentum by concentrating on the middle band (20-period SMA) as opposed to the upper or lower bands.
This specific EMA crossover helps you spot shifts in short-term and medium-term trends with clear risk and reward.
How the Strategy Works:
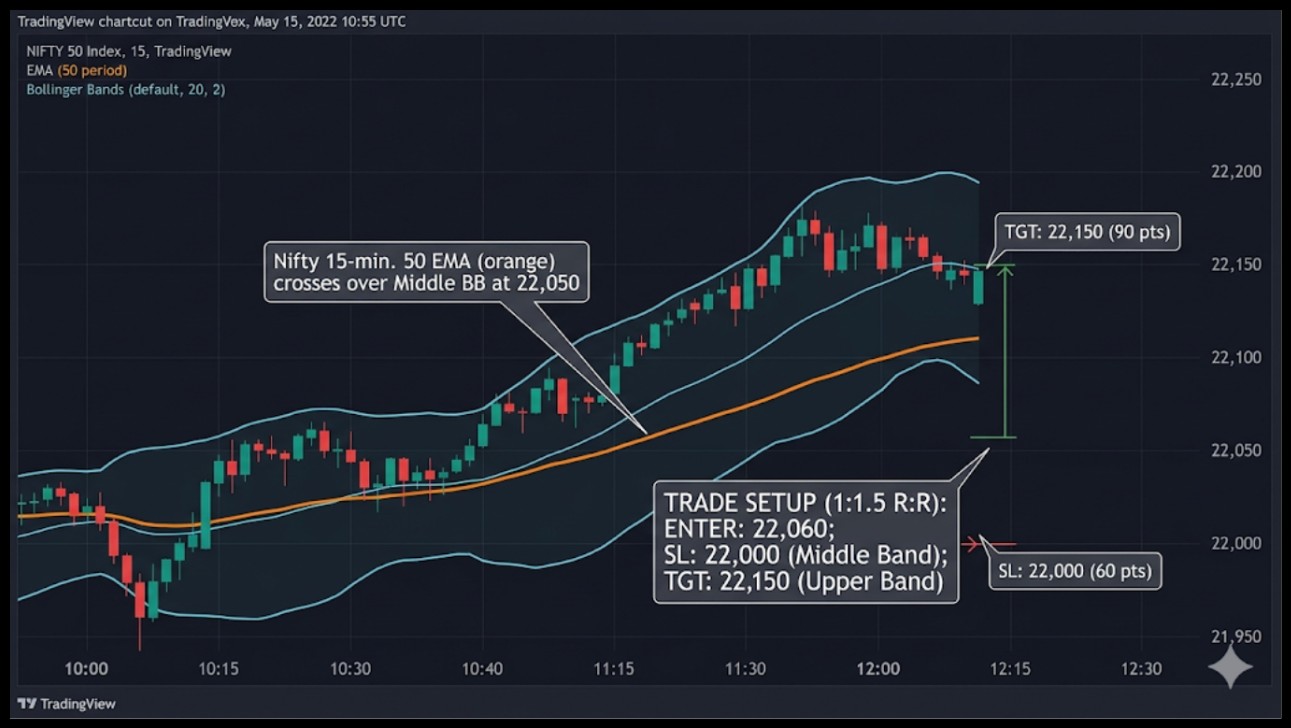
- Buy Signal: 50 EMA crosses above the middle Bollinger Band → short-term and medium-term momentum bullish.
- Sell Signal: 50 EMA crosses below the middle Bollinger Band → momentum turns bearish.
- Exit: Close the trade when the opposite crossover occurs.
Example:
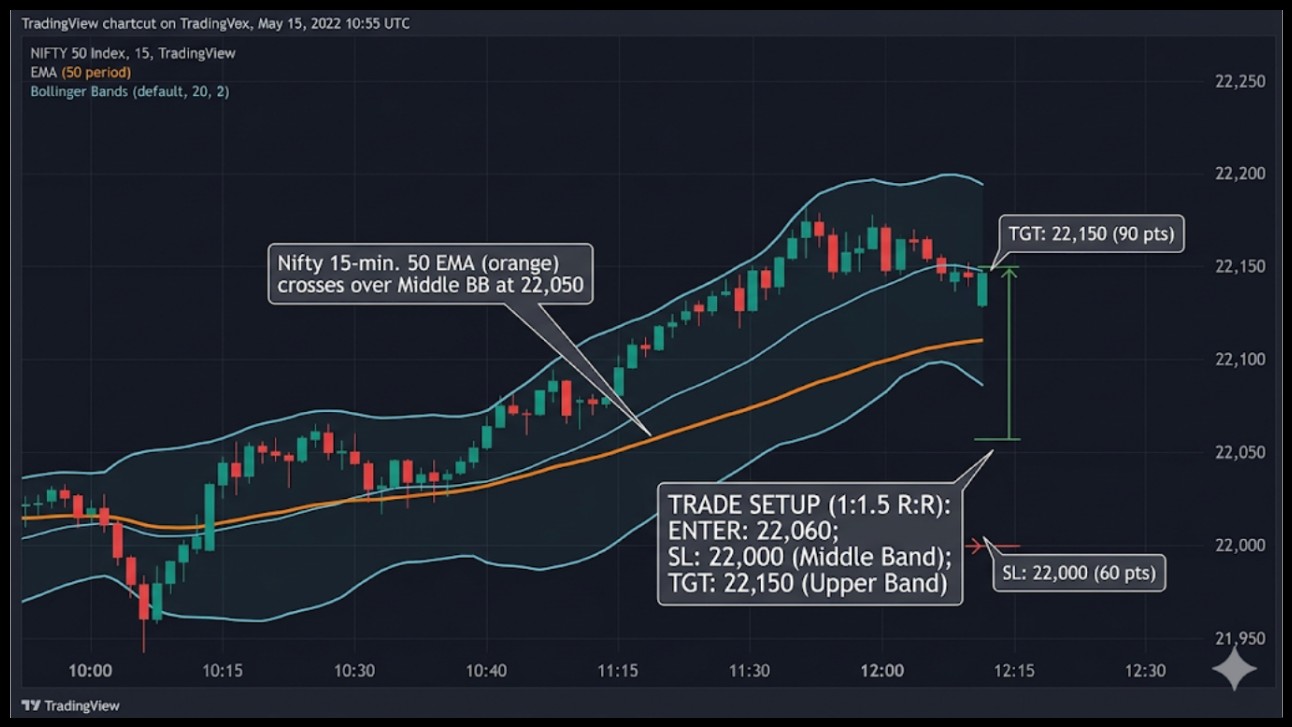
At 22,050, the 50 EMA crosses over the middle Bollinger Band. 60-point risk, 90-point return (1:1.5 ratio): enter at 22,060, stop-loss below the middle band at 22,000, and aim at the upper band at 22,150.
With this method, traders may approach EMA and Bollinger Band trades in an organised manner.
It provides high-probability entry with well-defined stop-loss and goal levels by concentrating on the middle band and 50 EMA.
EMA And BB Strategy For Short-Term Traders
Faster EMAs like the 5 EMA or 9 EMA work well with Bollinger Bands for short-term traders. Bollinger Bands with the 5 EMA method provide faster responses to intraday volatility and minor price fluctuations.
Similarly, a 9 EMA strategy is highly effective for capturing momentum in fast-moving stocks, as the 9-period average acts as a dynamic support level during a strong trend.
- Setup: 5 EMA on a 15-minute chart with standard Bollinger Bands.
- Entry: Price bounces off EMA near the lower band for a long trade.
- Exit: Price touches the upper band or shows reversal candlestick patterns.
For instance:
A stock is trading close to 500. At 498, the lower Bollinger Band is in line with the 5 EMA. With a goal of 505, the price forms a bullish pin bar, indicating entry at 500.
A stop-loss at 497 reduces the likelihood of a decline.
Scalpers and intraday traders seeking high-probability entries may find this setup particularly helpful.
EMA and Bollinger Bands Breakout Strategy
This strategy works bests during breakouts. High-momentum movements after periods of consolidation are the main emphasis of the EMA and Bollinger Bands Breakout Strategy.
- Identify the trend with EMA.
- Look for Bollinger Band squeezes (low volatility).
- Enter when the price breaks above the upper band or below the lower band in line with the EMA.
- Use prior swing highs/lows or ATR-based stops.
A volume rise above the recent average should accompany a true Bollinger Band breakthrough. If volume is low, the breakout is likely weak or fake.
Put a volume indicator beneath your chart in TradingView. The signal has institutional support if the volume bar of the breakout candle is higher than the preceding five to ten bars.
Low-volume breakouts sometimes reverse strongly within two to three candles, particularly in the Bank Nifty.
For instance:
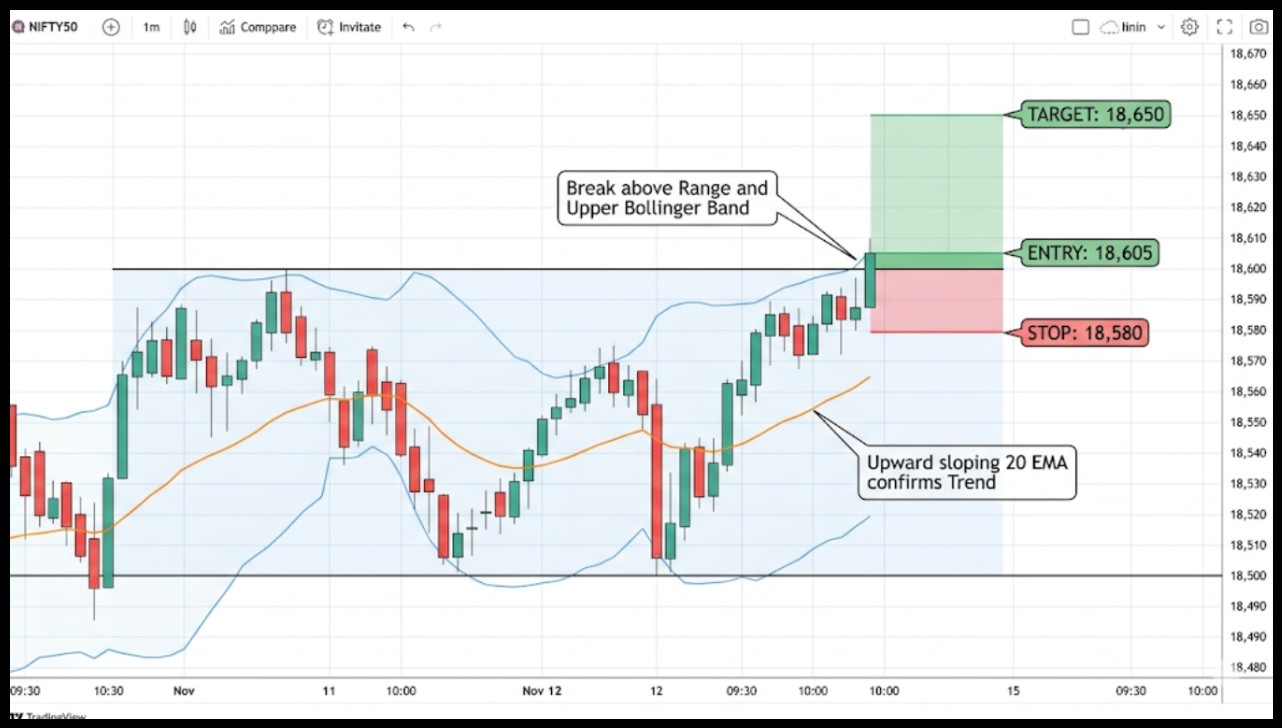
The Nifty has remained range-bound for the past three days. At 18,600, the price breaks above the upper Bollinger Band, and the 20 EMA slopes upward.
A disciplined trade with a clear risk-reward is provided by the entry at 18,605, stop at 18,580, and target at 18,650.
EMA keeps your trades aligned with the trend. Without it, breakouts can be misleading.
Can Bollinger Bands Be Good Along With EMA?
Yes. Combining EMA with Bollinger Bands helps filter noise and align trades with trend and volatility.
Price touching bands could merely be random swings in the absence of the EMA. Trades are in line with the overall direction of the market when using EMA.
- EMA confirms the trend.
- Bollinger Bands identify extremes.
- Combined, they generate disciplined entries.
Reliance Industries, for instance, is moving sideways. The EMA is flat, but the price approaches the lower Bollinger Band.
Here, a trader may decide not to make a long trade to prevent a misleading signal that may arise from depending solely on bands.
Exit Rules For EMA And Bollinger Band Strategy
Many traders forget that exiting trades are just as important as entering them. Your approach will remain disciplined and consistent if you have clear exit guidelines that assist in locking in profits and limiting losses.
- Upper/Lower Band Exit: In trending trades, get out when the price returns to the band. Take this as your initial exit signal for long bets if the price was walking the upper band and then closed below it with a bearish candle.
- EMA Cross Exit: When the price falls below the EMA, close the trade. If the price falls below the EMA and the EMA starts to flatten or slope downward, you should sell your long holdings.
- Middle Band Trail Target: Scale out or trail your stop once you’ve achieved a 1:1 risk-reward ratio. Aiming for 1:2 with your entire position is another option.
- Time-Based Exit: To prevent end-of-day volatility, exit all positions for intraday trades by 3:15 PM, even if the objective isn’t reached.
Clear exit rules keep your trading disciplined, reduce emotional decisions, and protect profits.
Your entry strategy is enhanced by clear exits, which increase the dependability of your EMA + Bollinger Band trades.
Risk Management With EMA And Bollinger Band Strategy
Even the best setups fail without proper risk management. Context is provided by using EMA and Bollinger Bands, although stops and position size are still crucial.
- Always define entry and exit levels.
- Use the EMA and band as a reference for stop placement.
- Avoid trading against the trend indicated by EMA.
For each trade, risk one to two percent of your whole trading capital. Your risk per lot is ₹1,250 if your stop-loss on the Bank Nifty is 50 points and each point is worth ₹25.
You trade fewer than one lot if your account is worth ₹1,000,000 and you are ready to risk 1% (₹1,000 every deal). This minimises big losses from single poor trades and promotes discipline.
Conclusion
The EMA and Bollinger Band strategy is one of the most reliable combinations you can add to your trading toolkit. It keeps you on the right side of the trend while helping you spot high-probability entries and exits.
When you master the 5 EMA strategy in conjunction with Bollinger Bands, you gain a significant advantage in catching quick momentum shifts that other traders might miss.
Whether you are scalping or swing trading with a 50 EMA, the core idea stays the same: let the indicators do the work.
Just remember, no strategy works without discipline and proper risk management. Stick to your levels, respect your stop-loss, and avoid overtrading.
Master the EMA and Bollinger Band Strategy. Join our technical analysis classes to learn how to apply it effectively with real market clarity.
FAQs
Q1: Are Bollinger Bands and EMA applicable in every market situation?
Ans: Yes, but in turbulent or trending circumstances, they are most dependable. Sideways markets often produce false signals.
Q2: What is the best EMA to use for Bollinger Band trades?
Ans: Longer EMAs (20, 50) are better for swing or trend-following trades, whereas shorter EMAs (5, 9) are better for intraday.
Q3: Do you need to wait for confirmation of the Bollinger Band breakout?
Ans: Indeed, confirmation lessens spurious signals, particularly when the EMA points in the direction of the breakout.
Before investing capital, invest your time in learning Stock Market.
Fill in the basic details below and a callback will be arranged for more information:


