

Most traders lose money not because they lack effort but because they lack structure. You can stare at charts for hours and still feel unsure about when to enter.
That confusion disappears when you start using the EMA and RSI strategy together. This combination does not just show you the trend but also confirms whether momentum supports it.
One indicator tells you the direction, and the other tells you the strength behind the move.
Together, they filter out weak setups and keep you focused on high probability trades only. If you want a clear and repeatable system, this strategy is exactly where you should start.
In this blog, let us understand these two strategies in simple language.
What is the EMA And RSI Strategy?
The EMA and RSI Strategy combines a moving average with a momentum indicator to filter out weak trades and highlight stronger setups.
It answers two key questions: where is the trend, and is momentum supporting it?
Often, a signal begins with an EMA crossover, where a shorter-period average moves past a longer-period one to indicate a shift in the market’s path.
Core Concept:
- EMA identifies trend direction
- RSI confirms momentum strength
- Trades are taken only when both agree
|
Timeframe |
Recommended RSI Period | Overbought/Oversold Levels |
| 1-min (scalping) | RSI 7 or 9 |
70/30 or 75/25 |
|
5-min (intraday) |
RSI 9 or 14 | 70/30 |
| 15-min (intraday) | RSI 14 |
70/30 |
|
1-hour (swing) |
RSI 14 |
70/30 |
For instance:
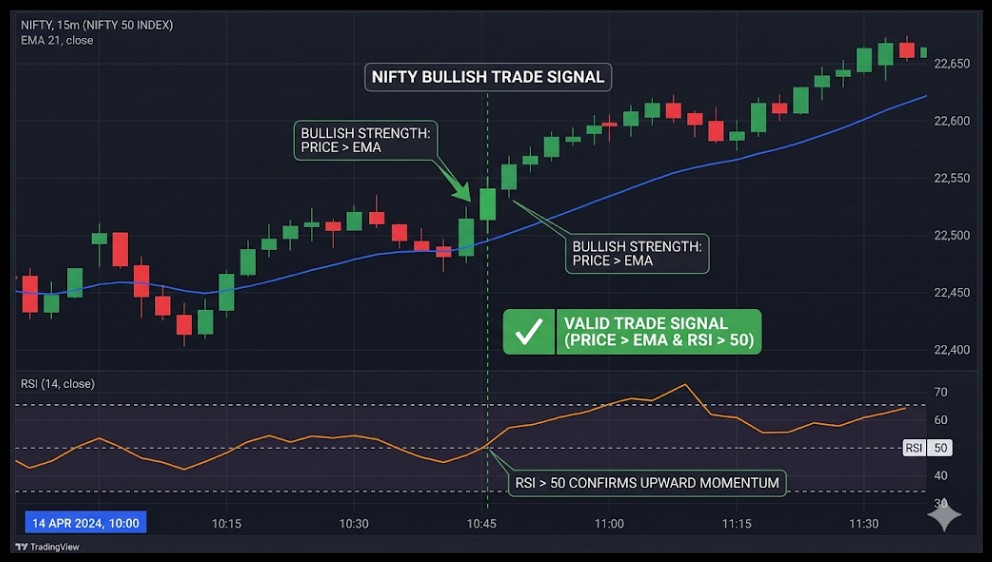
When the price is above the EMA, and the RSI is above 50, the setup shows bullish strength. This straightforward combination increases clarity and decreases random entries.
This strategy looks simple. That simplicity is exactly what makes it effective over time.
How EMA And RSI Work Together?
Once you understand how these two tools interact, the strategy becomes clear. The ema rsi indicator configuration combines two distinct market viewpoints to filter poor trades.
Role Of EMA:
- Shows trend direction
- Acts as dynamic support or resistance
- Helps avoid counter-trend trades
Role Of RSI:
- Measures momentum
- Identifies overbought and oversold zones
- Confirms strength behind moves
How To Use Them Together:
- Buy when the price is above the EMA, and the RSI crosses above 50
- Sell when the price is below the EMA and the RSI falls below 50
This creates a structured system. You are acting on alignment, not reacting to noise. Over time, this consistency builds discipline and reduces emotional decisions.
Two Types Of Trade Setups
Not every RSI and EMA signal has the same quality. Some form at the very start of a trend. Others appear after momentum has already built.
Understanding this difference improves your accuracy and confidence.
How These Setups Differ:
- New Trend Setup:
- The fast EMA crosses above the slow EMA, signaling a new trend beginning.
- RSI simultaneously crosses over 50.
- Higher potential rewards for early arrival
- To prevent false beginnings, a powerful confirmation candle is required.
- Established Trend Pullback Setup:
- EMAs are already in an upward alignment (rapid above slow).
- RSI falls close to 50 and then rises as the price retreats, approaching the EMA.
- In strong trends, RSI may only pull back to 55 or 60 before turning higher again.
Understanding the difference helps you focus on quality setups rather than chasing weak signals. Knowing whether you are entering a new trend or a mature one will noticeably improve your consistency over time.
EMA Crossover And RSI Strategy Rules
Now let’s build rules around this. A strong EMA crossover and RSI strategy focuses on both crossover signals and RSI confirmation.
Entry Rules:
- Fast EMA crosses above slow EMA
- RSI moves above 50
- Price holds above EMA
Exit Rules:
- Target exit: Use a minimum risk-reward ratio of 1:2. Aim for 0.3–0.8% movements while using the 5 EMA scalping approach. Aim for the next notable resistance level while using the 50 EMA swing approach.
- Exit indicator: When the price closes below the fast EMA and the RSI falls back below 50 on a long trade, both circumstances together, not just one, exit.
- Exit candlestick: When the RSI is getting close to 65–70, if a bearish engulfing or shooting star candle forms close to resistance, get out early rather than waiting for a complete reversal.
- Trailing stop: Move the stop to breakeven once the trade has made 1R. Next, trail stop beneath each subsequent swing low in the trend’s direction.
Clear rules are what separate consistent traders from inconsistent ones.
Risk Management Table:
|
Rule |
Explanation |
| Risk per trade |
1 to 2 percent |
|
Stop loss |
Below the recent swing |
| Target |
Minimum 1:2 ratio |
Note: The setup involves an EMA crossing plus an RSI over 50, but there’s one more thing to look for: a confirming candle.
When making long trades, watch for a bullish engulfing, hammer, or powerful green candle that closes above the EMA following the crossing.
This confirms that buyers are genuinely entering, not just indicators lining up.
Look for a bearish engulfing, shooting star, or powerful red candle closing below the EMA when making short bets.
Entering on candle confirmation rather than at the exact crossover moment eliminates many false entries.
RSI Divergence and EMA
Simple RSI signs are functional, but they don’t necessarily provide the whole picture. Divergence enters the picture here and provides depth.
Divergence functions as a filter to assist you in steering clear of poor trades and concentrating on stronger situations when paired with EMA crossovers.
How RSI Divergence Works With EMA:
- Bullish Divergence: Price makes a lower low, RSI makes a higher low
- Selling pressure is weakening
- If EMA gives a bullish crossover here, it becomes a strong buy setup
- Bearish Divergence: Price makes a higher high, RSI makes a lower high
- Momentum is fading
- If EMA confirms with a bearish crossover, it signals a high-probability sell
- Warning Signal:
- If EMA gives a bullish crossover but RSI shows bearish divergence
- It indicates a weak trend, better to skip or trade cautiously
This combination does not encourage more trading; it encourages smarter trading. Aligning divergence with EMA signals improves accuracy and filters out weak trade setups.
5 EMA And RSI Strategy: Fast And Reactive
The 5 EMA and RSI technique is effective on shorter periods for traders who like speed.
Often referred to as a high-momentum 5 EMA strategy, it captures brief bursts of velocity and responds fast.
Setup:
- Timeframe: 1-minute or 5-minute
- Indicator: 5 EMA + RSI 14
Entry Logic:
- Price above 5 EMA
- RSI crosses above 50
- Strong bullish candle
Example:
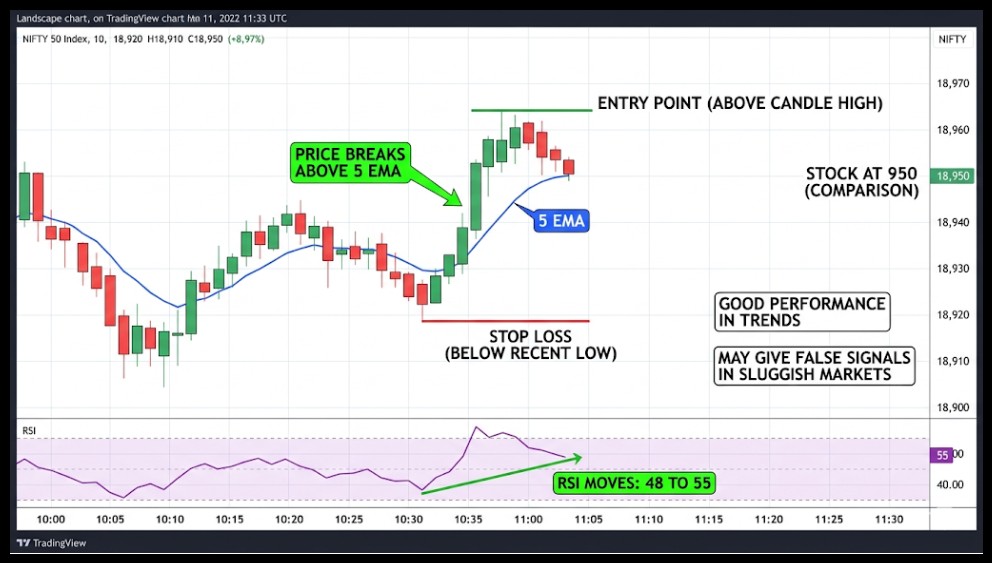
- Stock at 950
- Price breaks above the 5 EMA
- RSI moves from 48 to 55
Enter above the candle high. Place the stop below the most recent low. This setup works well in trending conditions. In slow, sideways markets, it generates false signals.
Understanding 50 EMA And RSI Strategy
Changing gears now, the 50 EMA and RSI approach is more dependable but slower. The goal is to capture larger, multi-session moves.
Mastering a 50 EMA trading strategy helps traders stay aligned with the trend while filtering out short-term noise.
Setup:
- Timeframe: 15-minute or 1-hour
- Indicator: 50 EMA + RSI 14
Entry Logic:
- Price above 50 EMA
- RSI stays above 50
- Pullback to EMA
Example:
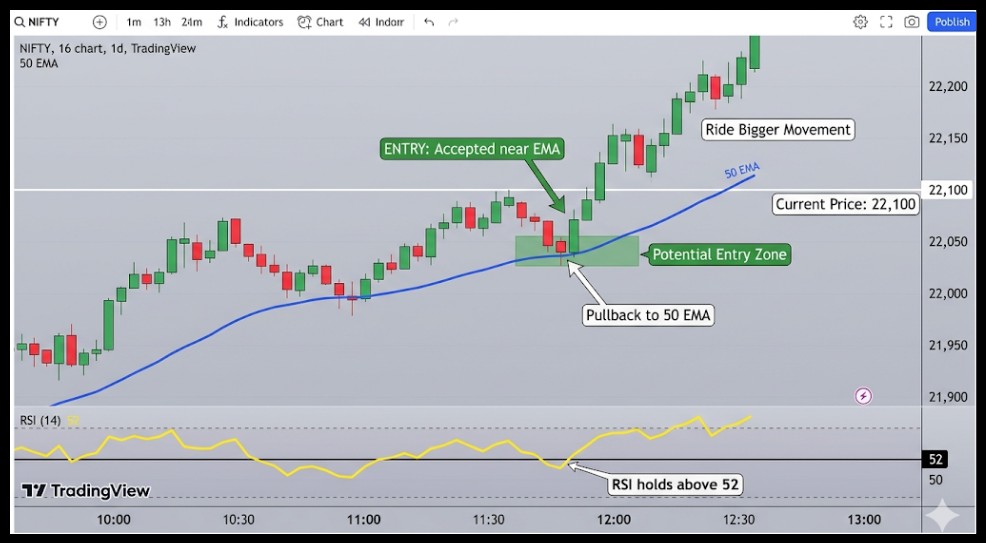
- Nifty trading at 22,100
- Price pulls back to the 50 EMA
- RSI holds above 52
Entry is accepted close to the EMA. Traders ride larger moves with less noise. This approach produces fewer trades but generally higher quality ones.
EMA And RSI Scalping Strategy
Scalping demands accuracy. Traders may make rapid swings with reduced risk by using the EMA and RSI scalping method.
It targets quick momentum bursts where timing matters more than how long you hold the trade.
Setup:
- Timeframe: 1-minute
- Indicator: 5 EMA + RSI
Rules:
- Enter buy when the price touches the EMA and the RSI rebounds from 40 to 50
- Enter sell when price rejects EMA and RSI drops from 60 to 50
Key Points:
- Target small moves, 0.3% to 0.8%
- Exit quickly if momentum fades
- Avoid trading during low volume
Scalping is quick. Focus is rewarded, while hesitancy is penalised. A few seconds of hesitation can turn a good setup into a missed trade or a loss.
Trade Example
Let’s use this RSI EMA crossover strategy to bring everything together in a realistic situation.
This illustration demonstrates how momentum and trend work together to provide a well-organised, high-probability trade setup.
Trade Setup:
- Asset: Bank Nifty
- Price: 48,500
- 20 EMA: 48,450
- RSI: 48 moving to 52
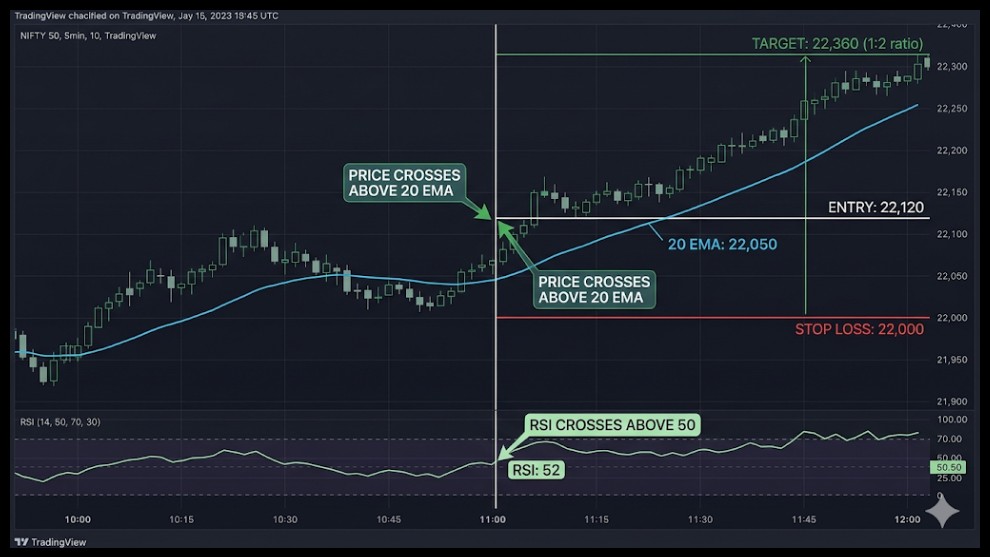
Entry Conditions:
- Price crosses above 20 EMA
- RSI crosses above 50
- Entry at: 48,520
Stop And Target:
- Stop loss: 48,400
- Risk: 120 points
- Target: 48,760 (1:2 ratio)
Outcome:
- Price continues upward
- RSI remains above 55
- Target achieved
This is how EMA and RSI are applied in real markets. Clearly stated risk, organised execution, and a clear setting. When every trade follows a plan, consistency replaces guesswork.
Best EMA And RSI Strategy Tips
Even a solid EMA and RSI strategy can be refined. Over time, minor changes lead to better outcomes.
Adapting to market conditions and sticking to your rules consistently is what builds long-term results.
Practical Tips:
- Trade in trending markets, not sideways
- Use a higher timeframe as a filter
- Avoid late entries after big moves
- Combine with support and resistance
Check the 15-minute or 1-hour chart before trading on the 5-minute chart. Is the EMA sloping in the direction of your intended trade on the longer timeframe? Is the RSI for longs higher than 50?
You would be trading directly against the dominating trend if the 15-min chart displays a bearish EMA alignment and an RSI below 50, in which case you should ignore any 5-min buy signals.
Common Mistakes Traders Make
When simple systems are used improperly, they fail. Here, the same holds. Forcing trades in poor conditions and ignoring market context leads directly to unnecessary losses.
Mistakes To Avoid:
- Disregarding the direction of trends
- Overtrading each and every indication
- Ignoring stop loss
- Relying only on indications in the absence of price movement
- Do NOT exit a long trade just because RSI hits 70 in a trending market; that’s not the strategy
- RSI can remain over 70 for several candles when the price is much above the EMA and the EMA is sharply trending higher; this is an indication of strength rather than a sell signal.
- RSI crossing back below 50 and a price closing below the EMA, rather than RSI reaching 70, is the sell/exit signal in this approach.
- In a trending market, using RSI overbought (70) as a sell signal
- Considering any RSI 50 cross to be a trade
Here is the honest truth. Although the strategy is straightforward, the implementation is not. Often, discipline is more important than the actual arrangement.
Conclusion
The EMA and RSI strategy is not complicated, but it does demand consistency from you. Every trade you take should have both trend alignment and momentum confirmation behind it.
Without that alignment, you are simply guessing, and markets do not reward guesswork for long.
Start with one timeframe, master the rules, and only then consider adding more complexity. The traders who win consistently are not smarter, but they are more disciplined and more patient.
This strategy gives you the structure you need, but execution is always your responsibility. Apply it with focus, manage your risk on every trade, and let the results speak over time.
Ready to sharpen your edge further? Join our technical analysis classes, where we turn simple strategies into consistent, real-market execution.
FAQs
Q1: Which EMA Is Most Effective With RSI?
Ans: Depending on the timescale, swing traders choose 20 or 50 EMA, while short-term traders use 5 or 9 EMA.
Q2: Is the EMA and RSI Strategy Suitable for Beginners?
Ans: Yes, it’s simple to understand. Beginners should steer clear of volatile markets and concentrate on risk management.Q3
Q3: Which RSI Level Is Ideal for Confirming an EMA Strategy?
Ans: As a confirmation point, RSI level 50 is frequently used. Bullish trades are supported by values over 50, and bearish setups are supported by values below 50.
Before investing capital, invest your time in learning Stock Market.
Fill in the basic details below and a callback will be arranged for more information:


