



Few chart patterns have a name as easy to remember. This guide has the head and shoulders pattern in plain steps.
The shape really does look like a head between two shoulders. In fact, it is also one of the best-known warnings that an uptrend is tiring. Here, you will learn how it forms, how to trade it, how to calculate a target, and how to handle the inverse version.
What Is a Head and Shoulders Pattern?
It is a reversal pattern. Specifically, it appears after an uptrend and warns that the trend may be ending.
The pattern has three peaks. Here, the middle peak, the head, is the highest. Meanwhile, the two outer peaks, the shoulders, are lower and roughly equal.
A line connecting the two lows between the peaks is the neckline. Therefore, a close below it confirms the pattern.
Difference Between Head and Shoulders vs Inverse Head and Shoulders
The pattern has a mirror image that signals the opposite. For clarity, here is a quick comparison.
| Feature | Head and shoulders | Inverse head and shoulders |
|---|---|---|
| Prior trend | Uptrend | Downtrend |
| Shape | Three peaks, middle highest | Three lows, middle lowest |
| Signal | Bearish reversal | Bullish reversal |
| Confirmation | Close below the neckline | Close above the neckline |
| Stop loss | Above the right shoulder | Below the right shoulder |
| Target | Head to neckline height, projected down | Head to neckline height, projected up |
How Does a Head and Shoulders Pattern Form?
Each peak tells a story about buyers losing strength. So, watch how the highs and volume change.
Here are the stages.
- First, price rallies to a high and pulls back. This is the left shoulder.
- Then, price rallies higher and pulls back to a similar low. This is the head.
- Next, price rallies again but stops below the head. This is the right shoulder.
- After that, price falls to the neckline.
- Finally, price closes below the neckline. This confirms the pattern.
A short pause inside a trend is different from a reversal. For instance, a flag and pennant pattern strategy treats such pauses as continuation, not a top.
Why Does Volume Fade Through the Right Shoulder?
Volume is the clue most beginners skip. For this reason, the next lines explain what it should look like at each stage.
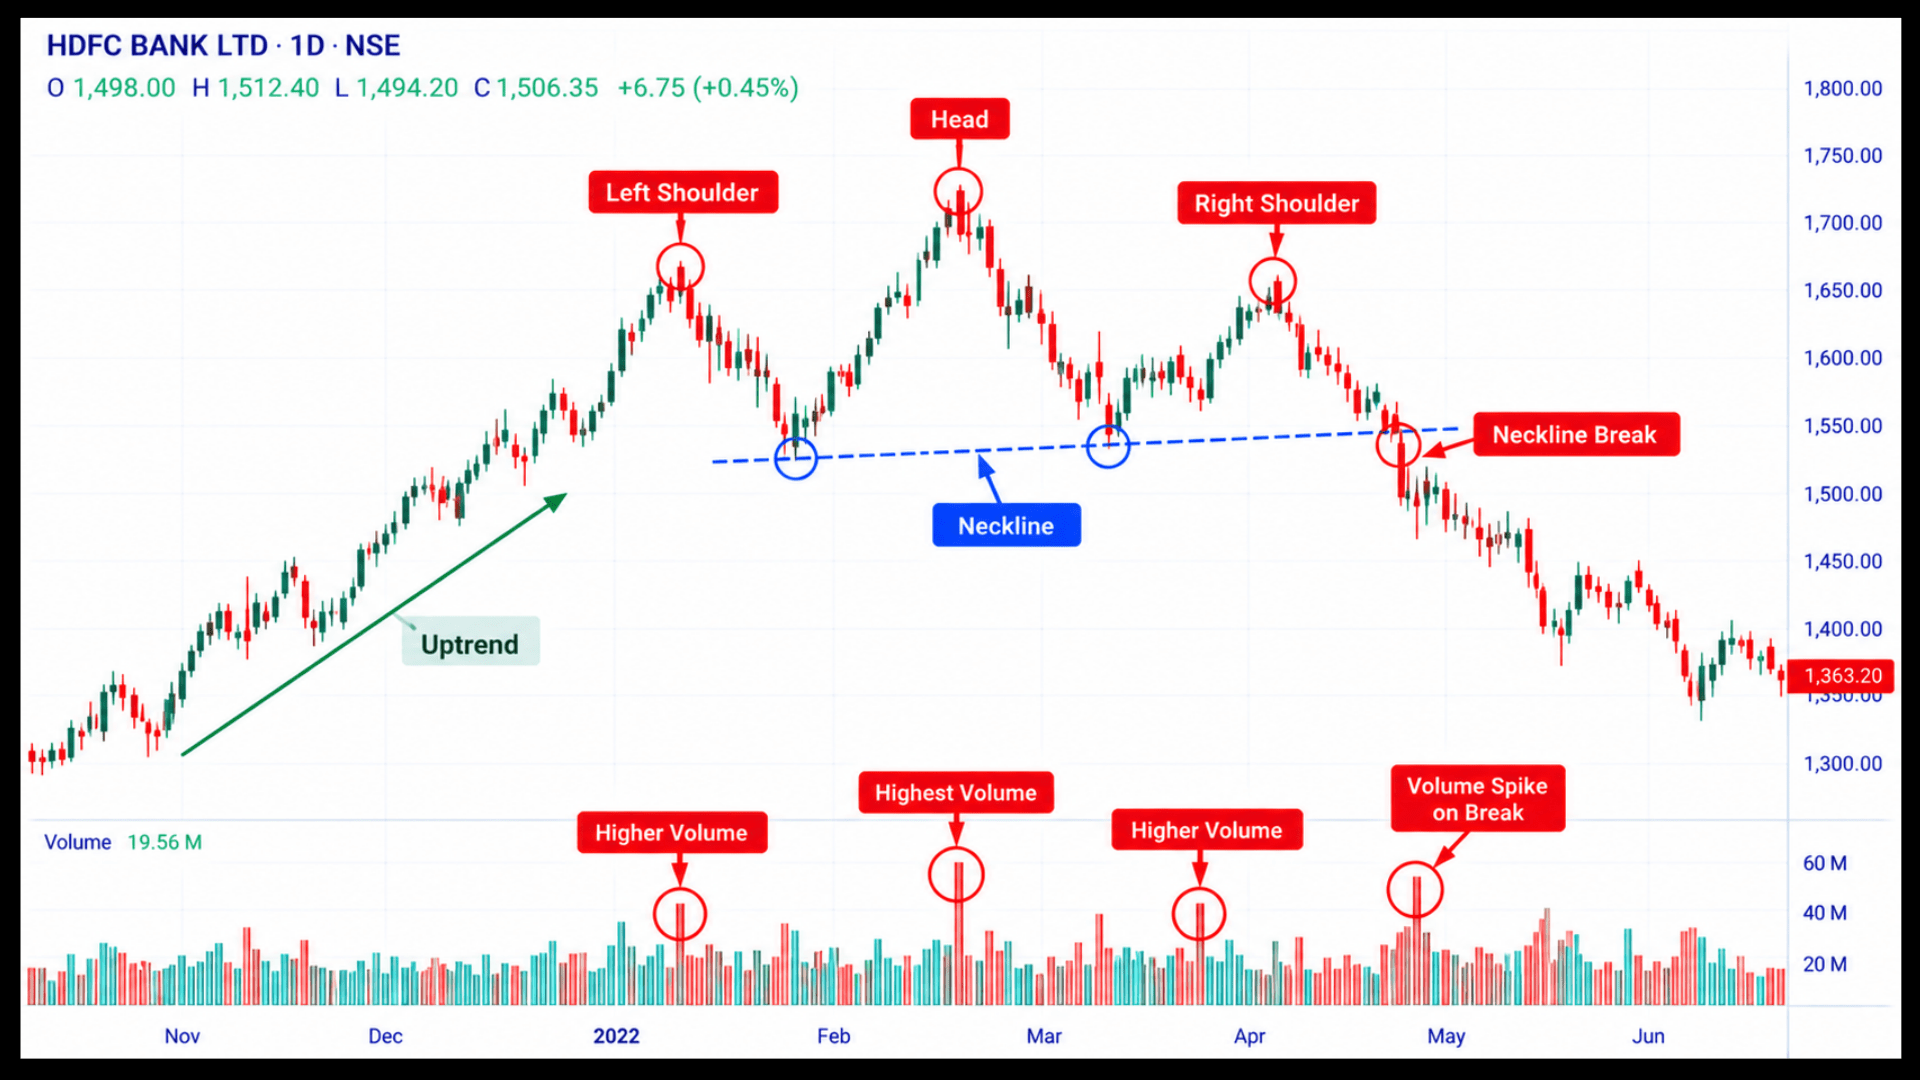
Volume often peaks on the left shoulder and fades through the head and right shoulder. After that, it rises on the neckline break. As a result, the pattern shows buying power draining away.
How to Identify a Head and Shoulders Pattern?
Do not call every three-peak shape a head and shoulders. Instead, real patterns follow clear rules.
Use this checklist:
- First, a clear uptrend came before the pattern.
- Second, the head is the highest peak, clearly above both shoulders.
- Third, the shoulders are roughly similar in height.
- Also, the neckline connects the two lows. It can slope slightly.
- Finally, price closes below the neckline to confirm.
Clean levels are the foundation. Therefore, if you need practice drawing necklines and trendlines
Head and Shoulders Target: How to Measure Potential Downside?
The target comes from the size of the pattern. So, measure first, then project.
Follow these steps:
- First, find the highest point of the head.
- Next, find the neckline level directly below the head.
- Then, subtract the neckline from the head. This is the pattern height.
- Finally, subtract that height from the neckline break point.
The result is a measured target. However, it is a guide, not a promise. Price may stop short of it or go past it.
How to Trade a Head and Shoulders: Entry, Stop Loss and Target
Wait for the neckline break. After all, selling the right shoulder is guessing, because the pattern is not complete yet.
Here is a simple rule set:
- Entry: sell when a candle closes below the neckline. Alternatively, a safer option is a retest of the neckline from below.
- Stop loss: place it above the right shoulder. Meanwhile, a tighter stop sits just above the neckline after a retest.
- Target: use the measured height from the head to the neckline, projected down from the break.
In the Indian cash market you cannot carry a short position overnight. Therefore, a multi-day trade on the downside needs futures or put options.
Head and Shoulders Example
Numbers make the rules easier to remember. Therefore, the example below applies entry, stop loss and target to one setup.
However, these figures are illustrative and are not a recommendation.
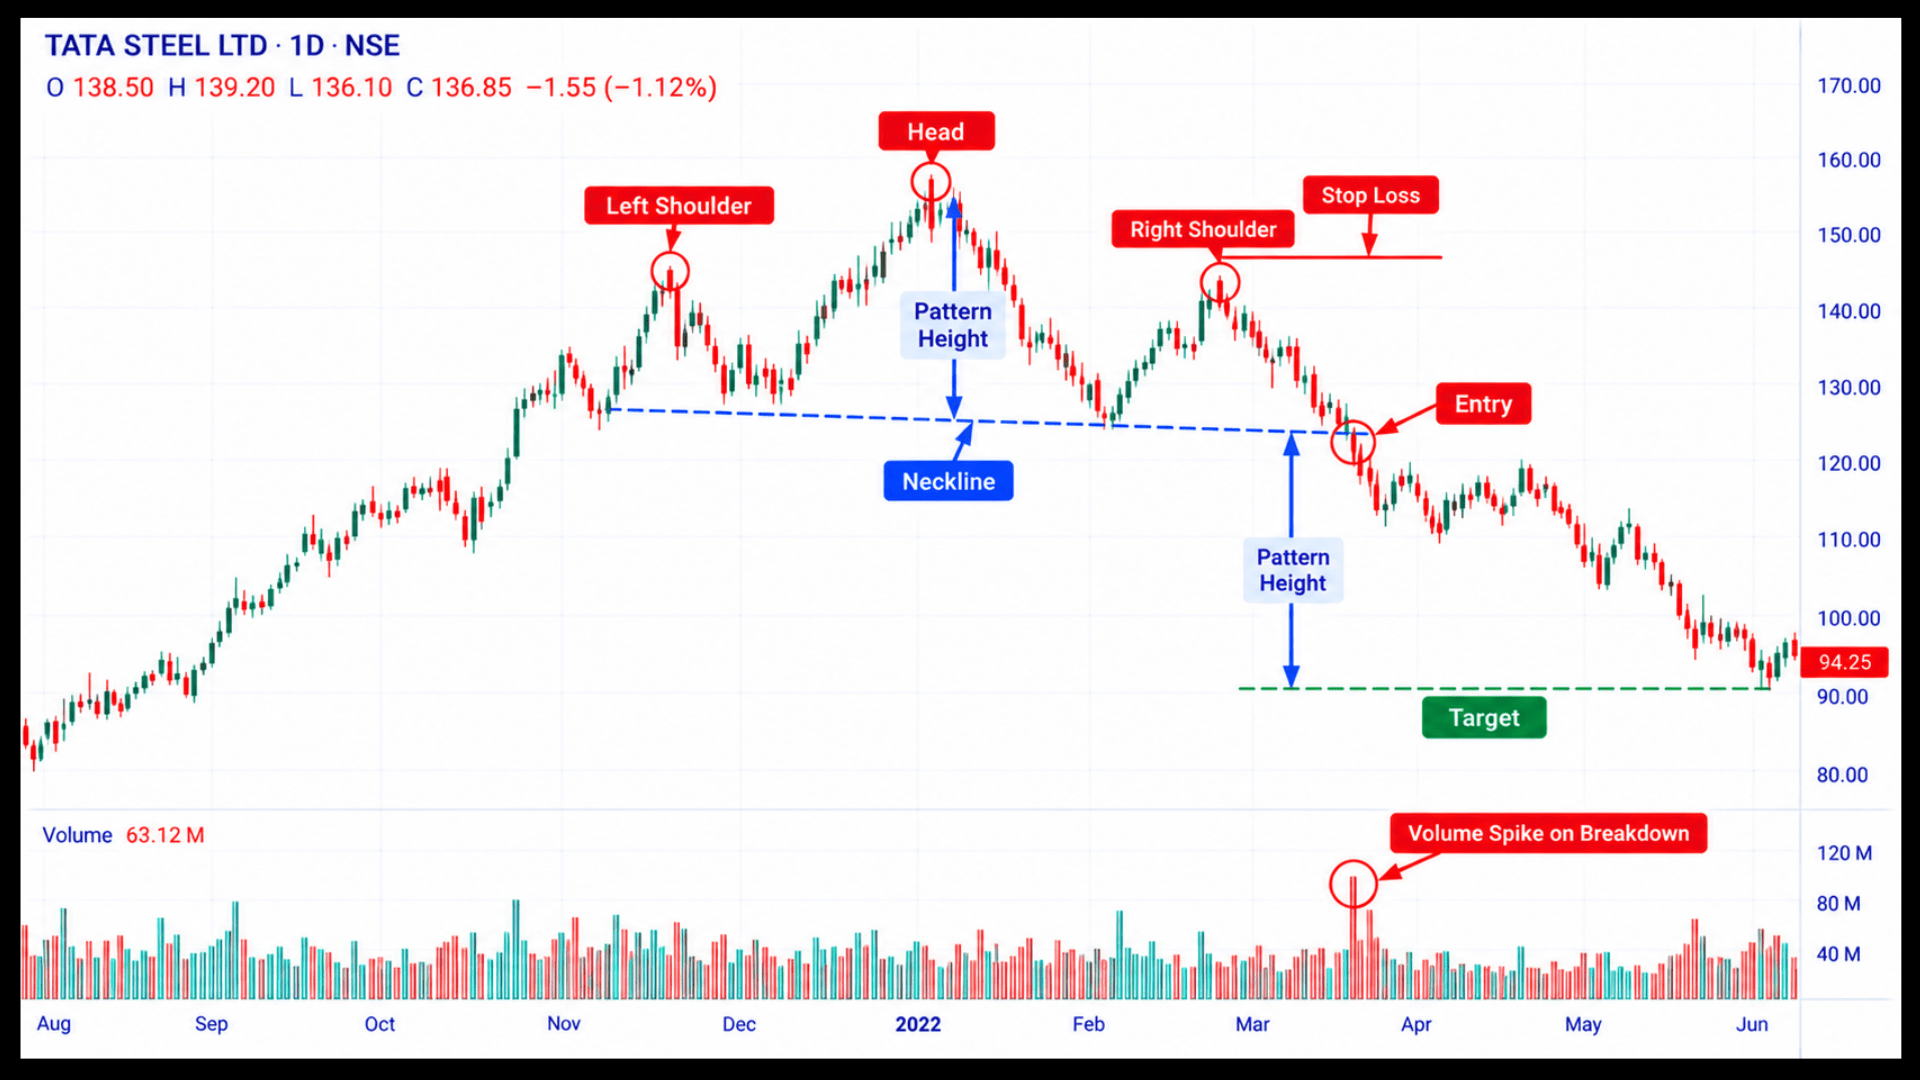
A stock rallies to ₹700 (left shoulder) and falls to ₹640. Then it rallies to ₹760 (head) and falls to ₹642. Next it rallies to ₹705 (right shoulder).
The neckline sits near ₹641. Later, price closes at ₹634 on rising volume. As a result, you take a bearish position at about ₹633.
Your stop goes above the right shoulder at ₹708. Thus, risk is ₹75 per share.
The pattern height is ₹119 (₹760 minus ₹641). Therefore, the target is ₹641 minus ₹119, or ₹522. The break point gives a target near ₹522.
That is around ₹111 of reward against ₹75 of risk, roughly 1.5 times. However, a retest entry with a tighter stop can improve this.
Likewise, bearish breaks of flat support follow a similar risk logic in descending triangle pattern trading.
What About the Inverse Head and Shoulders Pattern?
The inverse pattern is the same shape upside down. It forms after a downtrend and signals a bullish reversal. Also, you can trade it in the cash market, which makes it easier to use.
Volume matters even more here. In fact, a bullish breakout above the neckline needs a clear volume surge. Without it, the move often fades.
Use the same three-level plan. Specifically, buy on a close above the neckline, place your stop below the right shoulder, and project the pattern height upward.
Similarly, breakout buyers can compare this with ascending triangle pattern trading, which also relies on a clean level and a volume surge.
For a wider look at combining patterns with trend and volume
Why Does the Head and Shoulders Pattern Fail?
No reversal pattern works every time. So, know how this one goes wrong.
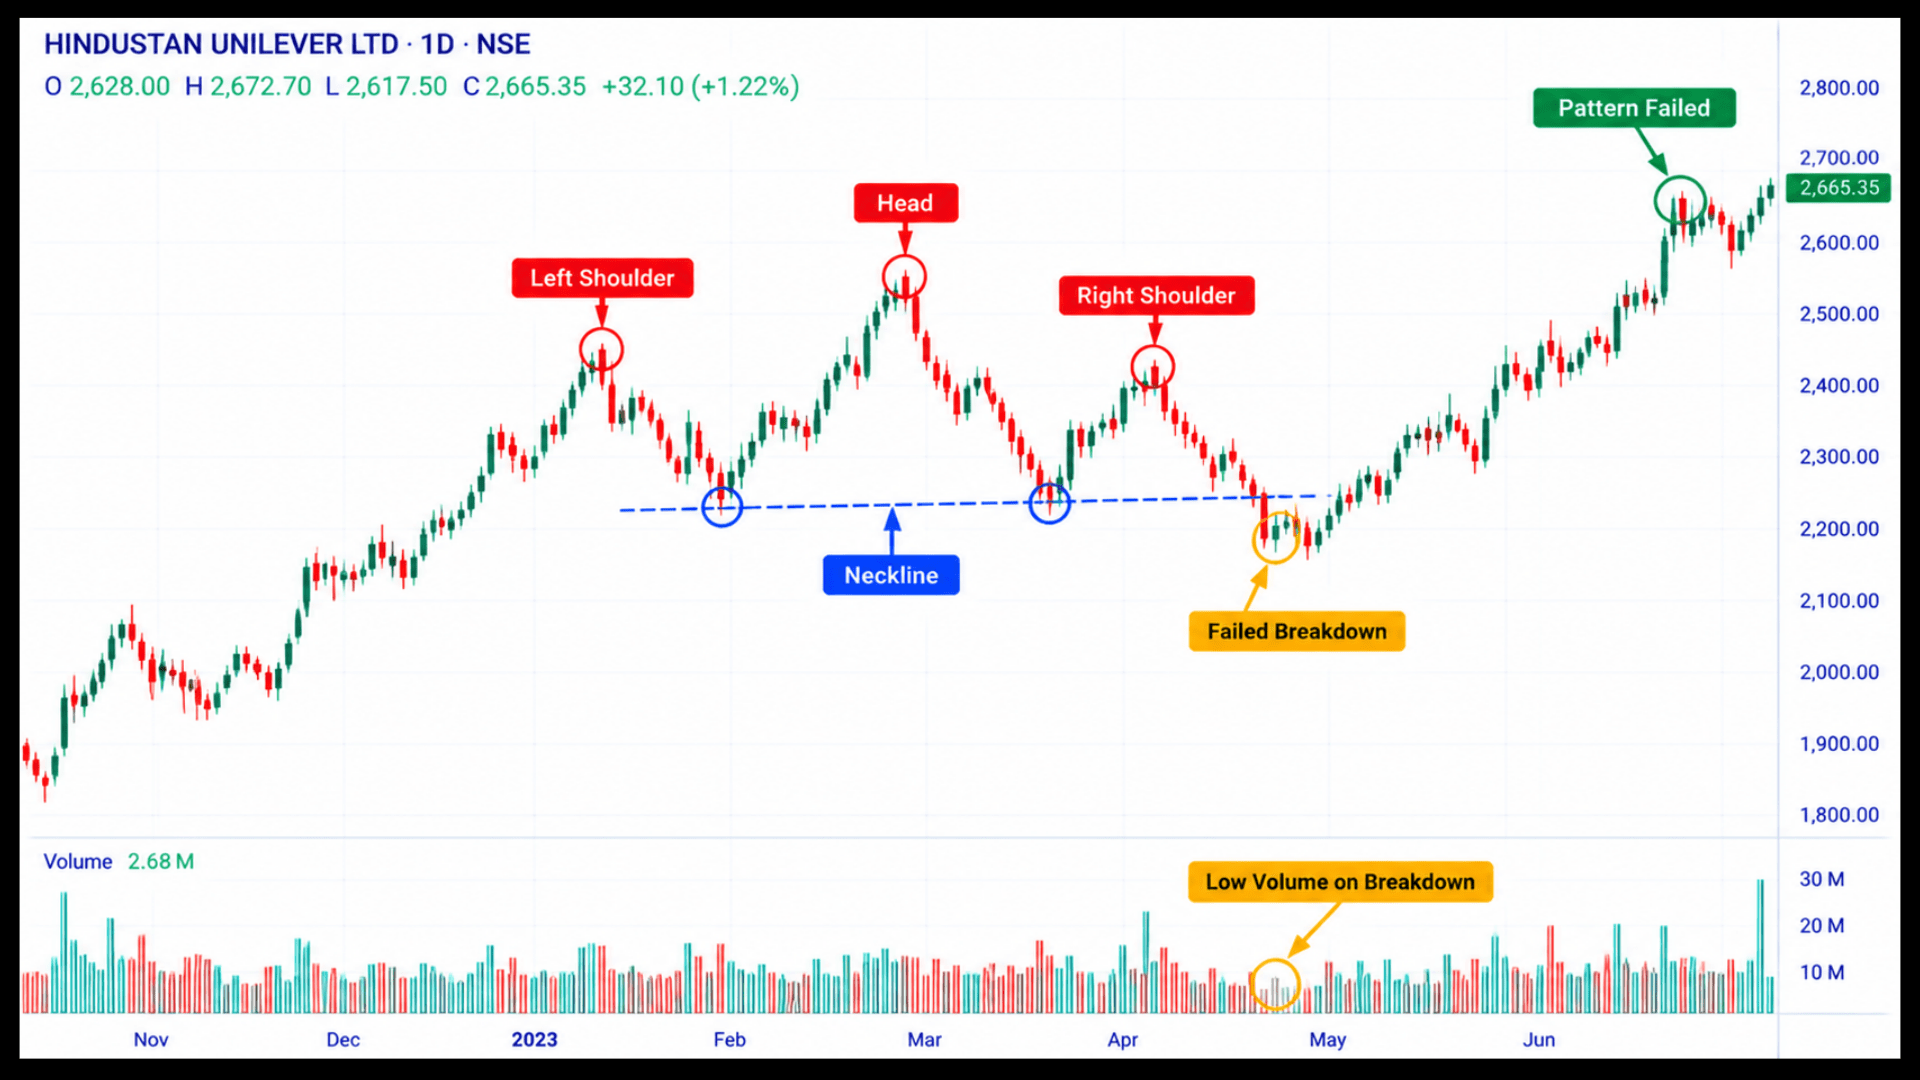
Watch for these warning signs.
- First, price breaks the neckline, then closes back above it within a few sessions.
- Second, the right shoulder climbs above the head. As a result, the pattern is invalid.
- Third, the neckline break comes on weak volume.
- Finally, the pattern forms in a strong market that keeps lifting the stock.
Besides, a rising wedge can mimic a right shoulder. Therefore, learning a wedge pattern trading strategy helps you avoid that mistake.
Comparing the Head and Shoulders to Other Chart Patterns
Reversal patterns are easier to judge when you see their neighbours. Therefore, the next two sections compare this shape with two-peak and range-bound setups.
Is a Double Top Easier Than a Head and Shoulders?
A head and shoulders has three peaks. In contrast, a double top has two. Both warn that an uptrend is struggling, and both use a neckline for confirmation.
Our guide on the double top and double bottom pattern explained covers the two-peak version.
How Are Triangle and Rectangle Patterns Different in Trading?
Not every sideways phase ends in a reversal. In fact, triangles and rectangles often break in the direction of the earlier trend.
For example, a Symmetrical Triangle Pattern squeezes price between falling highs and rising lows.
However, the breakout can go either way, so wait for the close.
Similarly, a rectangle pattern holds price between flat support and resistance. Here, a close outside the box gives the signal, much like a neckline break.
Want to Read Reversal Patterns on Live Charts?
Finding a head and shoulders on a finished chart is easy. Judging the right shoulder while it is forming is the real skill.
Our technical analysis classes teach this live, on real Indian stocks.
Conclusion
The head and shoulders pattern shows buyers pushing to a final high and then running out of strength. The right shoulder fails to match the head, and the neckline gives you a clear line to watch.
Wait for the close below the neckline, check volume, and place your stop above the right shoulder.
Measure the head height for a target. If price reclaims the neckline, accept the loss. The inverse pattern works the same way for bullish reversals, and it is easier to trade in the cash market.
Frequently Asked Questions
Before investing capital, invest your time in learning Stock Market.
Fill in the basic details below and a callback will be arranged for more information: