

A market rally feels great. Candles are green. Momentum is strong. Then comes the drop. Not a gentle pause, but a sharp three-wave move that shakes confidence.
Many traders panic here. Experienced ones look for structure. Very often, that structure is a zigzag correction pattern.
This pattern is part of Elliott Wave theory. It is not random. It follows clear rules, ratios, and internal wave counts.
When you understand it, pullbacks stop feeling chaotic and start feeling planned.
Let’s walk through it practically.
What Is A Zigzag Correction?
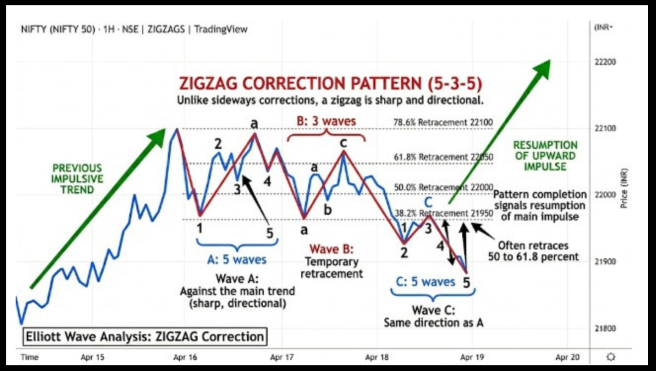
A zigzag correction is a three-wave counter-trend move labeled A B C. It appears after a five-wave impulse and corrects a portion of that move.
The internal structure is important. Wave A unfolds in five waves. Wave B forms three waves. Wave C forms five waves again.
That is why traders ask, What zigzag correction has a 5 3 5 structure? The answer is simple.
Every standard zigzag does.
This structural difference is what separates it from other corrective wave types like flats or triangles.
Core Structure Of The Zigzag Correction Pattern:
| Wave | Internal Count | Direction |
| A | 5 waves | Against the main trend |
| B | 3 waves | Temporary retracement |
| C | 5 waves | Same direction as A |
Unlike sideways corrections, a zigzag is sharp and directional. It often retraces between 38.2% and 78.6% of the previous impulse. Sometimes slightly more, but rarely beyond 78.6 percent in a simple case.
Types of ZigZag Patterns

Understanding the internal structure of Waves A and C helps traders identify a zigzag early on a chart.
- Wave A always forms either a standard impulse (five waves) or a leading diagonal of Elliot wave. This is the first strong move against the main trend and often surprises traders who assume the trend will continue.
- Wave B can take the form of almost any corrective pattern, such as a flat, triangle, or complex correction, because it represents a temporary pause before the final leg.
Wave B must retrace a minimum of 20 percent of Wave A. A Wave B that moves less than this is too shallow to qualify as a valid corrective leg in a zigzag structure. - Wave C must also unfold in five waves, typically as a standard impulse or sometimes an Elliot wave ending diagonal. There is an important structural rule that traders watch closely. If Wave A develops as a leading diagonal, Wave C must form as a standard impulse. Keeping an Elliott wave cheat sheet nearby can help you quickly verify these specific sub-wave rules during live market hours.
There is an important structural rule that traders watch closely. If Wave A develops as a leading diagonal, Wave C must form as a standard impulse as an ending diagonal.
In that situation, Wave C must develop as a standard impulse pattern.
Double Zigzag And Triple Zigzag Patterns

There are times when the market needs more than one zigzag correction before it bounces back to its usual retracement range.
The correction, in these circumstances, is carried out to a double, or, infrequently, a triple, zigzag.
Each zigzag formation has its own A B C pattern, and is linked by another Wave X.
An effective indication occurs when Wave B pulls back over 61.8 percent of Wave A as the correction continues to expand.
This is usually an indication of an emergent double zigzag as opposed to a simple correction.
| Structure | Pattern | Internal Waves |
| Simple Zigzag | A B C | 7 waves |
| Double Zigzag | W X Y | 15 waves |
| Triple Zigzag | W X Y XX Z | 23 waves |
Principles And Guidelines Of Zigzag Correction Pattern
Let’s get practical. A zigzag is not guessed. It follows guidelines.
Structural Principles:
- Wave A must subdivide into five waves.
- Wave B must subdivide into three waves.
- Wave C must subdivide into five waves.
- Wave B should not retrace beyond the start of Wave A.
- Wave C usually travels at least as far as Wave A.
If these conditions are not met, it may not be a zigzag.
Zigzags tend to:
- Be sharp and steep.
- Retrace deeply compared to flats.
- Have low overlap in Wave A and C.
- Show strong momentum in Wave C.
If price action feels overlapping, you may be looking at a flat, not a zigzag.
Key Invalidation Rules Traders Must Watch:
Knowing when a zigzag breaks down is just as valuable as knowing when one is forming. These invalidation rules act as guardrails.
They stop you from holding onto a bias that the market has already moved away from.
Watch for these three situations:
- Wave B retraces more than 100 percent of Wave A. This is the clearest signal that something is off. A standard zigzag simply does not allow Wave B to climb back above where Wave A began. If that happens, you are most likely looking at a flat correction, not a zigzag. Relabel and move on.
- Wave C extends well beyond 261.8 percent of Wave A. Do not treat this as an automatic disqualification. Elliott Wave theory sets no hard ceiling on Wave C. What this level is telling you is, slow down and reassess. Look at the bigger picture. There is a real possibility that what you labeled as A, B, C is actually Wave 1, Wave 2, and the early stages of a powerful Wave 3 in a fresh impulse. That changes everything about how you should be positioned.
- Wave A subdivides into only three waves, not five. A zigzag requires Wave A to unfold in five waves. If you count only three, the pattern is not a zigzag. It is more likely a flat or another corrective structure entirely.
In the case of traders, they serve as guardrails.
The presence of any of these conditions on the chart is a clear indication of a need to reconsider the number of waves and not to force the zigzag interpretation.
Fibonacci Measurements & Zigzag Correction Pattern
Fibonacci ratios help confirm whether a move is truly a zigzag correction pattern.
If you are learning how to read Elliott wave structures, these measurements are your best tool for separating a true correction from a trend reversal.
These ratios provide the structural confirmation required to use Elliott wave for defining high-probability price targets and risk levels.
Wave B usually retraces:
- 38.2 percent of Wave A
- 50 percent of Wave A
- 61.8 percent of Wave A
If Wave B retraces more than 78.6 percent, the structure may not be a simple zigzag.
Wave C often measures:
- 100 percent of Wave A
- 161.8 percent of Wave A in extended cases
Example:
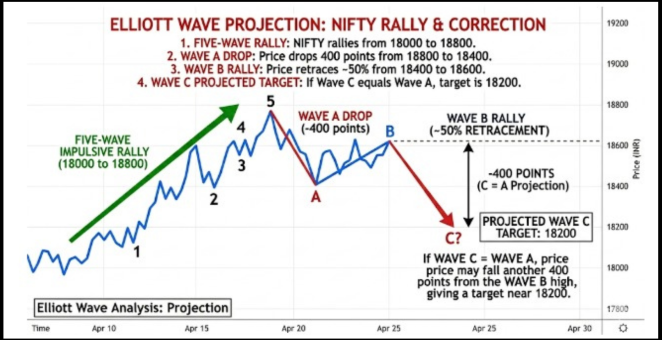
Nifty rallies from 18000 to 18800 in five waves. Then Wave A drops from 18800 to 18400, a 400-point move.
Wave B rallies to around 18600, near 50 percent retracement.
Now project Wave C.
If Wave C equals Wave A, the price may fall another 400 points from the Wave B high. That gives a target near 18200.
Spotting A Zigzag Correction Pattern Early
Let’s take a look at a RELIANCE stock breakout.
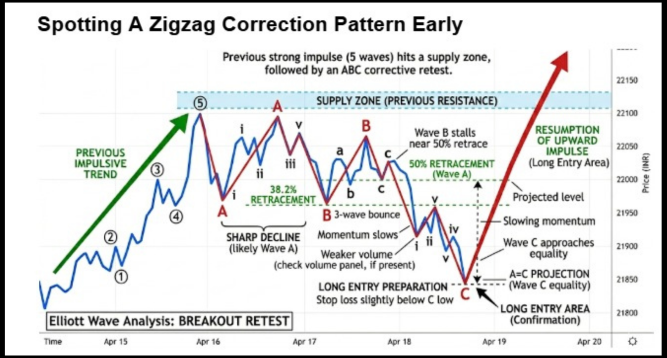
- Price rallies in a clean five-wave impulse.
- RSI shows minor divergence.
- Price hits a supply zone.
Then comes a sharp decline in five smaller waves. That is likely Wave A.
Instead of shorting blindly, you wait. Wave B forms a three-wave bounce. Volume is weaker. Momentum slows.
You measure Fibonacci levels of Wave A. Wave B stalls near 50 percent retracement.
Now, project Wave C using equality to Wave A.
When Wave C approaches the projected level and momentum slows, that is when experienced traders prepare for long entries. The stop-loss is set slightly below the Wave C low.
Common Mistakes Traders Make While Trading ZigZag Pattern
Even experienced traders slip.
- Labeling every three-wave move as a zigzag.
- Ignoring internal wave count.
- Entering before Wave C completes.
- Forgetting the higher time frame context.
A zigzag inside a larger downtrend may not lead to continuation upward. Context matters.
Always check the larger trend.
Zigzag Vs Flat Correction
Many traders mix these two.
| Feature | Zigzag | Flat |
| Internal Structure | 5 3 5 | 3 3 5 |
| Shape | Sharp and steep | Sideways and overlapping |
| Wave B Depth | Moderate | Often deep or equal to start |
| Emotion | Panic | Frustration |
If the correction feels fast and directional, think zigzag. If it drifts sideways with heavy overlap, it is likely a flat.
Conclusion
The zigzag correction pattern teaches patience. It forces you to wait for structure instead of reacting emotionally.
When you see a 5 3 5 form clearly, you know the market is correcting, not collapsing. That clarity changes how you trade.
You stop chasing. You start measuring. You manage risk logically.
Markets move in waves. They breathe. And zigzags are one of the most honest expressions of that rhythm.
Want to master the zigzag correction pattern with real chart examples and live breakdowns?
We offer specialized Elliott wave classes that focus on practical application and pattern recognition to help you trade with confidence.
FAQs
Q1: What zigzag correction has a 5-3-5 structure?
Ans: Every standard zigzag correction in Elliott Wave follows a 5 3 5 internal wave count for Waves A, B, and C.
Q2: How Important Are Fibonacci Measurements In Zigzags?
Ans: Fibonacci retracements and projections help estimate Wave B pullbacks and Wave C targets, improving entry timing and risk control.
Q3: How Can You Confirm A Zigzag Correction Is Complete?
Ans: Traders look for a finished 5-wave Wave C structure near key Fibonacci projection levels, along with slowing momentum or reversal signals before entering.
Before investing capital, invest your time in learning Stock Market.
Fill in the basic details below and a callback will be arranged for more information:


