
Most traders stare at charts and see chaos. Lines going up, lines going down, and no clear reason why.
But what if those movements were actually telling a story, one you just needed the right language to read?
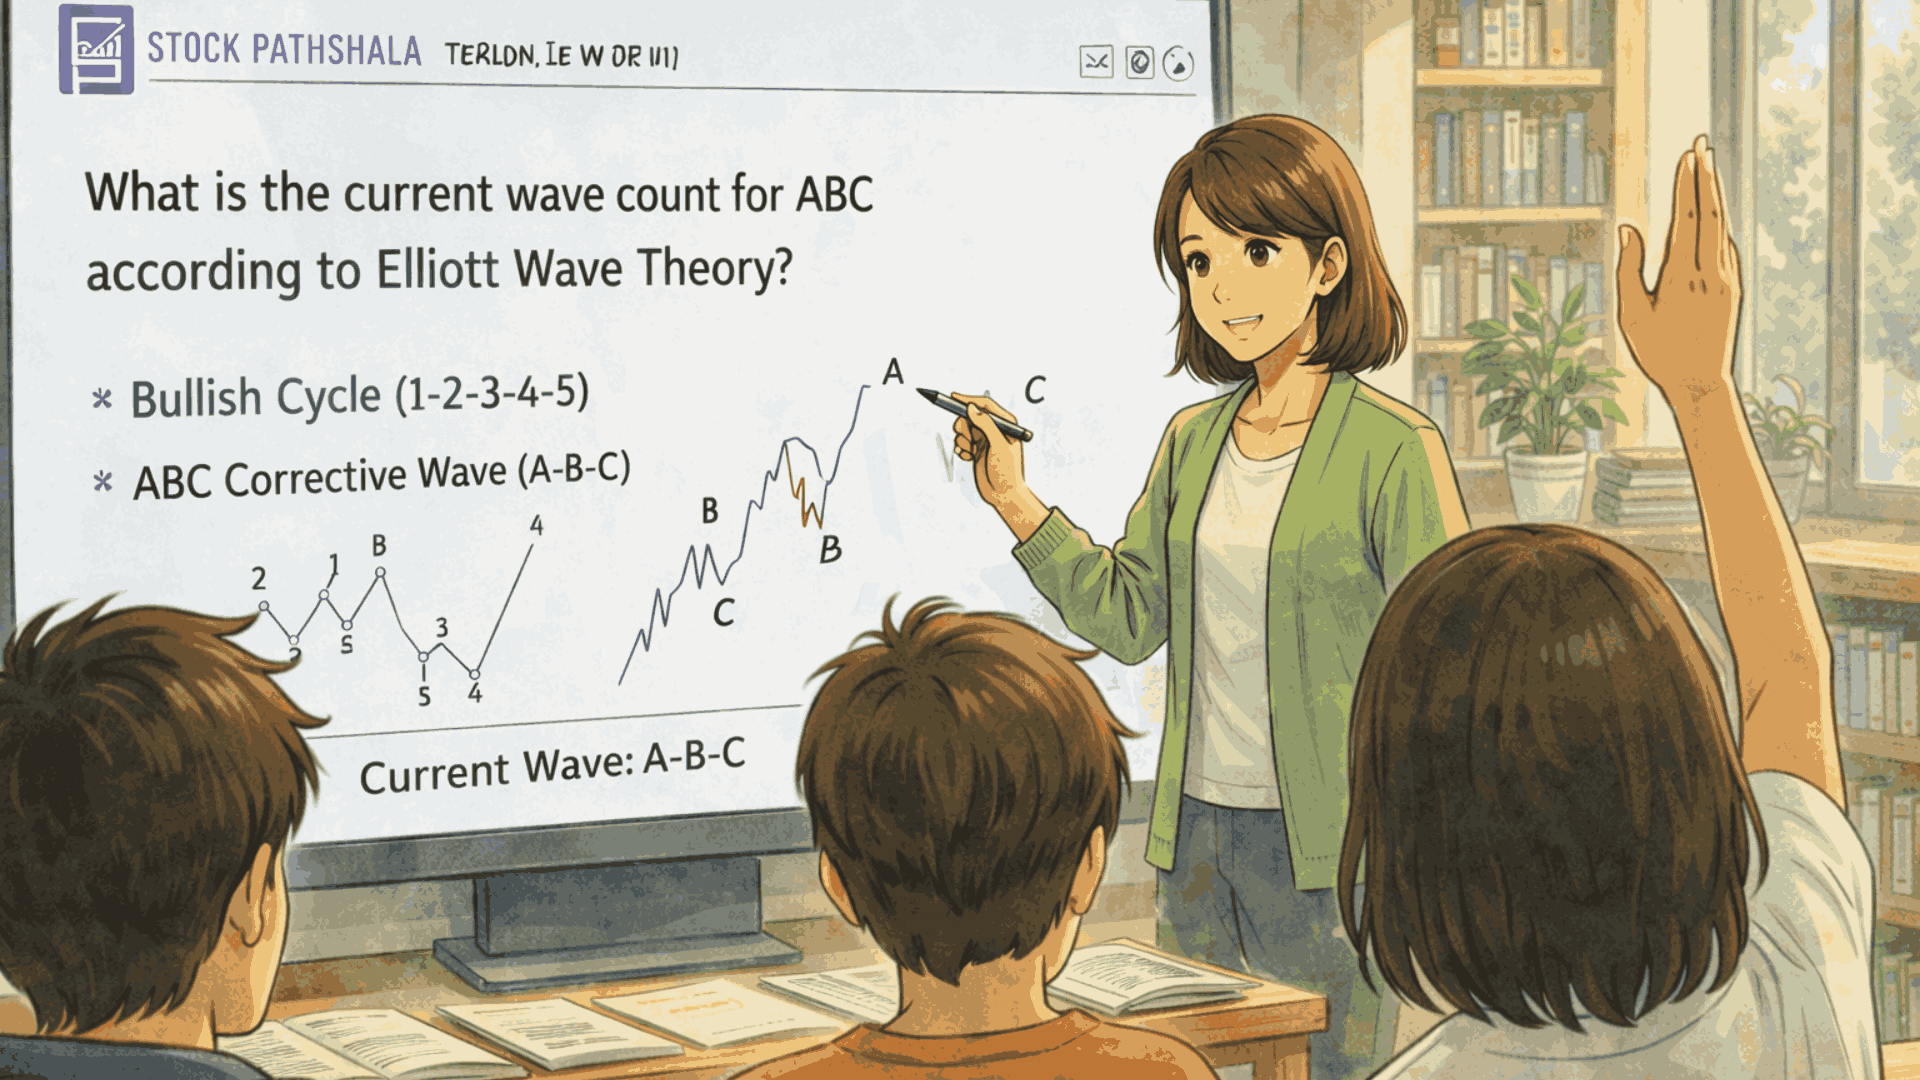
That language is Elliott Wave Theory, and one of its most powerful chapters is the ABC corrective structure.
So what is the current wave count for ABC according to Elliott Wave Theory, and why does it matter so much to traders?
In this blog, we break down exactly how the ABC correction works, how to spot it in real time, and how you can use it to anticipate the market’s next move before it happens.
Let’s get into it.
Basics of Elliott Wave
To understand the ABC pattern, you must first know how markets move between impulsive and corrective phases.
Elliott Wave theory suggests price moves in patterns based on crowd psychology, not randomness.
An impulse phase has five waves in the main trend direction, while a correction has three (A, B, and C) that retrace against that trend.
- Impulse wave pattern: Move with the prevailing trend and have strong, directed velocity.
- Corrective waves: Move against the trend and retrace some of the earlier move.
- Wave structure: Impulse (5 waves) followed by correction (3 waves) produces a full cycle.
During a correction, the Elliott Wave count typically follows an ABC pattern. Wave A initiates the retreat, Wave B partially retraces it, and Wave C completes the correction by extending farther in the countertrend direction.
This pattern is not always the same and can take many different shapes, including zigzag, flat, and triangular, indicating variations in power and duration.
What Is The ABC Correction In Elliott Wave?
To answer What Is the Current Wave Count (ABC) according to Elliott Wave Theory, we must break down the three waves.
It represents the most common corrective wave structure, helping traders identify when a pullback may be nearing completion.
Wave A: First Leg Of The Correction
Wave A often triggers what looks like a new trend against the prior one. If we’re in an uptrend, this is where selling begins. Most traders miss this early move because it still looks like a pullback rather than a genuine correction.
Wave B: Partial Retracement
Wave B brings the market back towards the original impulse direction. It is a countertrend move that often traps traders on the wrong side before Wave C resumes the corrective move.
Wave C: Completion Of Correction
Wave C continues after B and often reaches or goes beyond Wave A’s endpoint. It’s a faster, clearer move than B, especially in zigzag corrections where both A and C subdivide into their own five-wave sequences.
In terms of count, a classic zigzag ABC looks like this:
|
Wave |
Structure | Direction |
| A | 5 waves |
Countertrend |
|
B |
3 waves | Retrace |
| C | 5 waves |
Countertrend returns |
Note: In a flat correction, Wave A subdivides into 3 waves instead of 5.
This pattern helps spot the correction’s end before the next trend begins. It also gives traders a clearer idea of when momentum is likely to shift back in favor of the main trend.
Common Forms Of ABC Corrections
ABC corrections vary; they take different shapes depending on market conditions and trend strength.
Understanding these common variations allows traders to more precisely detect patterns and avoid false signals.
Zigzag Correction pattern
- Structure: 5-3-5
- Sharp directional correction
- Wave C often mirrors wave A in length
This is the most common form and often the easiest to count in real time.
Flat Correction pattern
- Structure: 3-3-5
- Wave B retraces nearly all of A
- Wave C finishes near the start of A
This type often happens in sideways markets.
Triangle And Complex Patterns:
- Five overlapping waves labeled A, B, C, D, and E.
- An Elliott wave triangle pattern typically forms as Wave B within a larger ABC correction, appearing in prolonged consolidation phases.
- Triangles signal a continuation of the broader trend once the pattern completes.
Triangles and complex patterns are rarer; they tend to form in volatile or choppy conditions, which makes them harder for beginners to spot.
Fibonacci Levels In ABC Wave Count
Traders use Fibonacci levels to estimate how far each wave in an ABC correction might travel.
They provide structure and precision to wave counting, making it easier to detect probable reversal zones.
- Wave B retracement: Typically retraces 38.2% to 78.6% of Wave A, signaling a brief pullback in the correction.
- Wave C extension (100%): Often equals the length of Wave A, creating a balanced and common correction.
- Wave C extension (161.8%): It indicates a greater correction where Wave C extends far beyond Wave A.
Fibonacci ratios combined with wave counts improve accuracy and help estimate when a correction might end. This makes the ABC count more reliable in actual trading.
How The Current Wave Count For ABC Unfolds?
In real markets, ABC corrections often stray from textbook shapes. They can be shallow, deep, or even sideways.
But the Current Wave Count For ABC According To Elliott Wave Theory generally follows these guiding traits:
- Wave A starts after the end of the impulse
- Wave B retraces less than the entire wave A
- Wave C often matches or exceeds Wave A’s length and lines up with Fibonacci ratios.
For example:
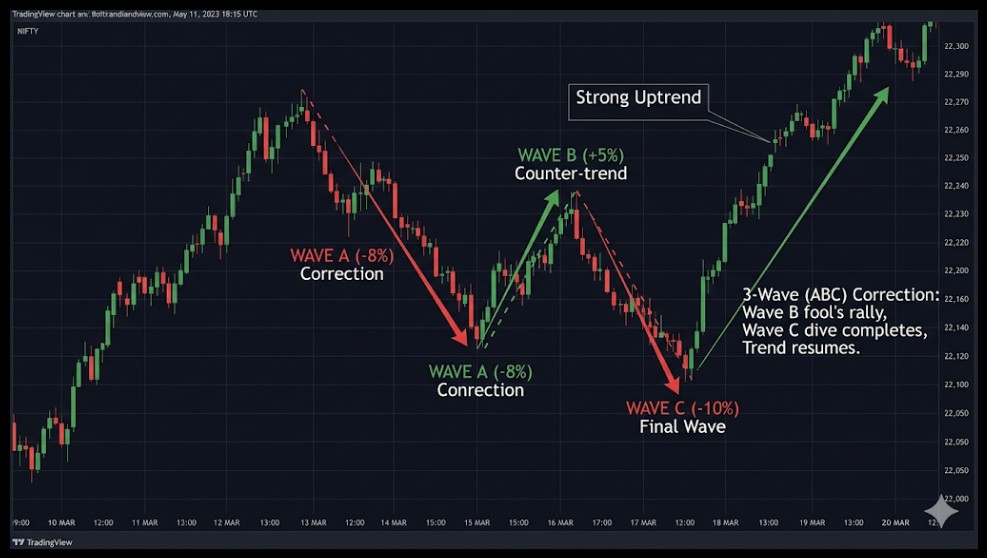
More sellers appear during a strong upswing that has just peaked. Wave A declines by 8% and Wave B recovers 5% of the dip, tricking some traders.
Wave C then sinks 10% to complete the correction before the trend restarts.
In practice, this count helps traders pinpoint a zone where the trend is likely to resume, useful in both swing and intraday setups.
How To Identify The Current ABC Wave Count In Real Time?
Finding the current ABC wave count helps traders turn theory into actionable decisions.
A step-by-step method removes the guesswork and tells you exactly where the market likely stands.
- Step 1: Determine the final finished 5-wave impulse: Identify a clear five‑wave directional move first. This signals the end of the trend phase and the commencement of a probable ABC correction.
- Step 2: Find the initial counter-trend move (Wave A): Wave A is the first move against the trend. It frequently seems like a simple pullback, but it marks the start of a correction.
- Step 3: Check the retracement for Wave B (38%-78%): Wave B retraces a portion of Wave A, usually in the 38% to 78% Fibonacci range. This step has the potential to provide the impression that the trend will continue.
- Step 4: Measure Wave C using Fibonacci extensions (1.0-1.618 of A): Wave C often stretches to match or go beyond Wave A. Common goals range from 100% to 161.8% of Wave A, which helps predict the correction’s endpoint.
- Step 5: Confirm the structure and momentum: Validate the wave count with price structure, trendlines, and indicators such as RSI or MACD. Momentum divergence frequently indicates that Wave C is nearing the end.
Following these strategies will help traders identify the current wave position with better precision and certainty.
This organized strategy optimizes timing and aligns trade with the overall market trend.
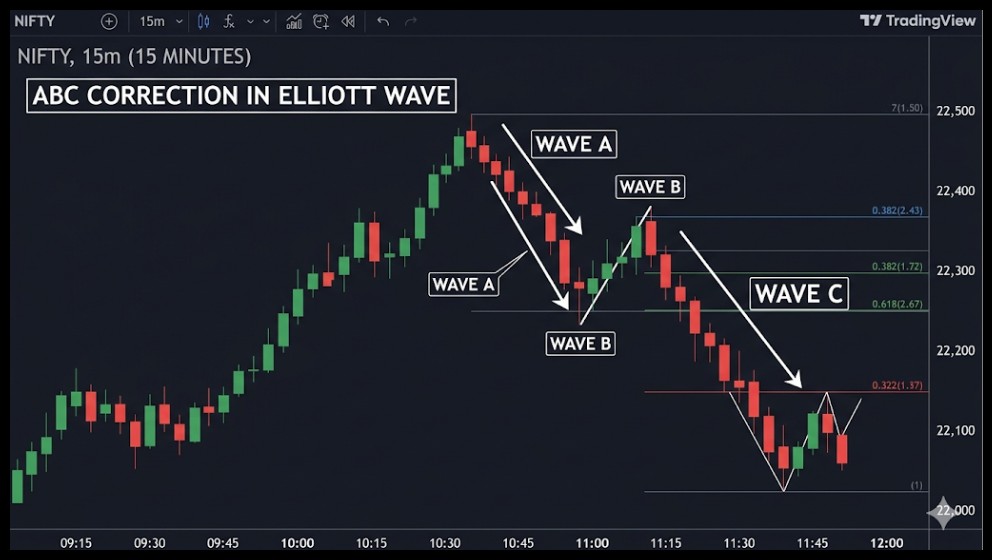
Identifying Current ABC Wave On A Chart
On a chart labeled with Elliott Waves, an ABC correction shows three clear moves.
Visualising them helps lock in potential entry zones for trend continuation trades.
Here’s an example on a daily chart:
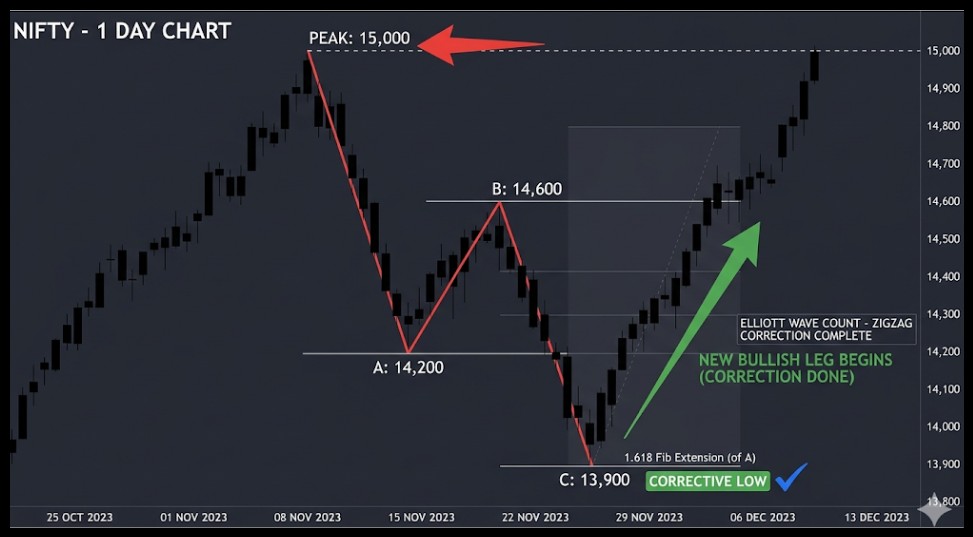
- Price peaked at 15,000
- Wave A dropped to 14,200
- Wave B retraced to 14,600
- Wave C dropped to 13,900
Once C is complete, it becomes the corrective low. If the price begins to rise after C, it indicates that the correction is complete and that the next leg of the broader cycle has begun.
Traders frequently use Fibonacci extension or retracement tools to improve count precision.
Identifying the current wave count properly requires validating moves with instruments such as trendlines and oscillators, as wave form alone can be confusing.
Multi-Timeframe Wave Count In ABC Analysis
Elliott Wave patterns unfold across multiple timeframes at once. On a lower timescale, what looks to be a complete ABC correction may be just a small part of a greater wave on a higher timeframe.
To increase accuracy, traders must align their wave count across several timeframes:
- ABC on a lower period (e.g., 1-hour): This might be a sub-wave within a broader corrective or impulse on the daily chart.
- Higher period (daily/weekly): Determines the major trend and overall wave orientation.
- Lower periods (like intraday charts): Help refine entries and exits within the broader trend.
- Avoid confusion: A bullish ABC on a lesser period might still be a temporary move inside a bigger negative trend.
Combining various periods provides traders with additional perspective and prevents them from misinterpreting short-term corrections as big reversals.
This method results in better-informed decisions and stronger trade setups that follow the dominating trend.
Wave Count Invalidation Rules
Good wave counting means spotting patterns and spotting when they’re wrong. In Elliott Wave analysis, invalidation rules help traders avoid costly mistakes and quickly reassess market structure.
Adhering to the core Elliott wave ABC correction rules ensures that your analysis remains mathematically sound and consistent with market geometry.
- Wave B exceeds the beginning of Wave A
If Wave B passes the start of Wave A in a zigzag correction, the count is invalid and needs reassessment.
However, in an expanded flat, Wave B naturally moves beyond Wave A’s origin, which is completely normal and does not invalidate the structure.
- Wave C is abnormally short
While Wave C typically equals or extends beyond Wave A, a shorter Wave C can occasionally occur in strongly trending markets, known as a truncated Wave C.
In such cases, look for additional confirmation signals before concluding that the correction is complete.
By applying these invalidation rules, traders can filter out weak setups and maintain discipline in their analysis.
The result: fewer bad counts and more confidence in your setups.
Practical Use of the ABC Count For Trading
Understanding the current wave count helps traders find an actionable signal. Once wave C completes, it marks a potential trend continuation zone.
A practical rule many traders follow is:
- Wait for the completion of wave C
- Validate with bullish reversal patterns or indicators like RSI showing divergence
- Place a clear stop‑loss below the correction low before entering
- Target at least the previous high or a Fibonacci-projected extension
These rules make the concept real. It’s not about guessing a pattern; it’s about corroborating price behaviour with measurable signals.
Challenges In Identifying The Current Wave Count
Counting waves is subjective. Even experienced analysts frequently interpret and label waves differently.
Unlike fixed indicators, Elliott Wave analysis needs context, patience, and ongoing adjustments as fresh price activity emerges.
- A pattern that looks to be a simple ABC correction may be a WXY complicated structure on closer examination.
- Misidentifying the wave structure might result in improper trade entries or exits.
- Spot invalid counts quickly to avoid wrong trades.
To make more trustworthy trading decisions, traders can combine wave counting with confirmation tools like volume, trendlines, and momentum indicators.
Final Thoughts
Understanding what is the current wave count for ABC according to Elliott Wave Theory is not just an academic exercise.
It is a practical skill that can genuinely change how you read markets and time your trades.
The ABC correction tells you where the market is resting before its next big move, and once you learn to spot it, you will start seeing it everywhere.
Like any skill, it takes practice, patience, and a willingness to keep reassessing when the market surprises you.
The more you combine wave counting with tools like Fibonacci levels and momentum indicators, the sharper your analysis will get. Start small, stay consistent, and trust the process.
The market always leaves clues, and now you know how to read them.
Take the next step and join our Elliott wave classes, where you learn to identify real-time wave counts with clarity and confidence.
FAQs
Q1: Can ABC correction signals predict specific price targets?
Ans: No, ABC patterns indicate possible locations of the trend’s end but do not guarantee specific price levels. Fibonacci tools assist in improving these zones.
Q2: How can I know when wave C is complete?
Ans: A wave C completion is frequently verified when price reverses direction and breaks above the B wave high (in bullish corrections); confirmation rises with divergence on indicators.
Q3: Is Elliott Wave Theory reliable on all timeframes?
Ans: It may be used on a variety of periods, from intraday to weekly charts, although shorter timeframes sometimes contain more noise, making accurate counts difficult without additional confirmation techniques.
Before investing capital, invest your time in learning Stock Market.
Fill in the basic details below and a callback will be arranged for more information:


