

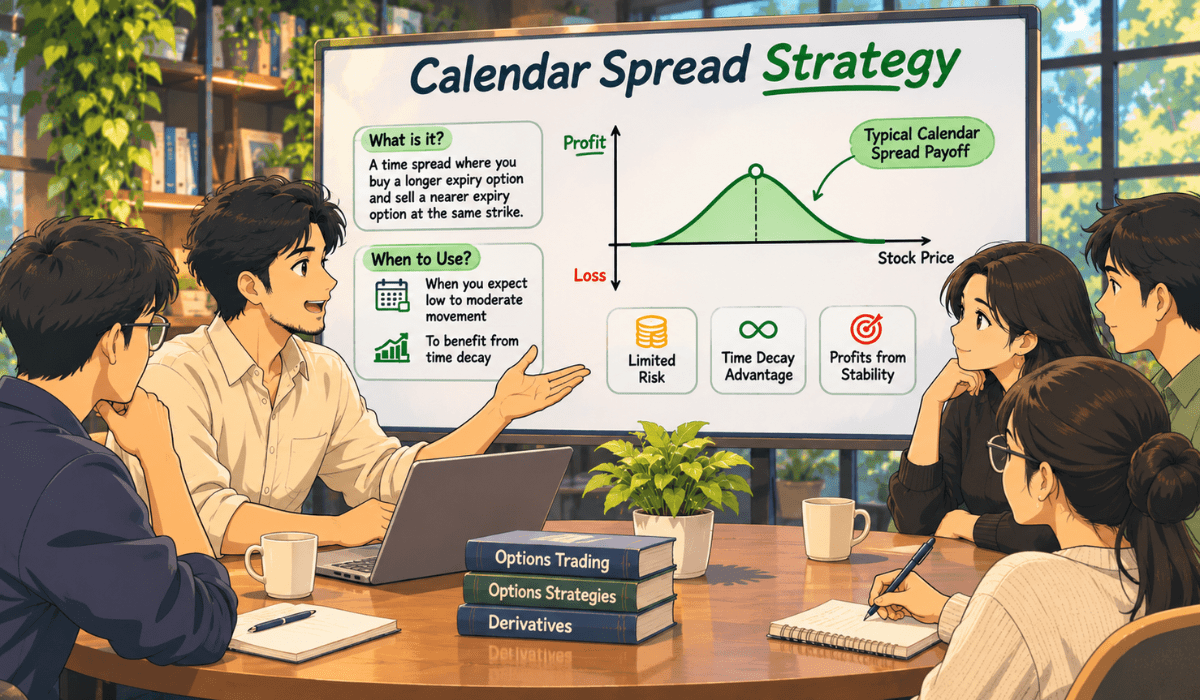
Every option loses value as expiry comes closer, but not at the same speed. The calendar spread strategy is built around that gap.
You sell a near-month option, buy a far-month option at the same strike, and hope the near one fades faster.
This page explains the legs, a worked payoff table, maximum profit and loss, breakevens, risks and common mistakes. Every number is hypothetical and for illustration only, and nothing here is a trade recommendation.
What Is a Calendar Spread Strategy?
First, let us settle the meaning. In fact, every number later on this page rests on it.
A calendar spread (also called a time spread) uses two options of the same type and strike, with different expiries.
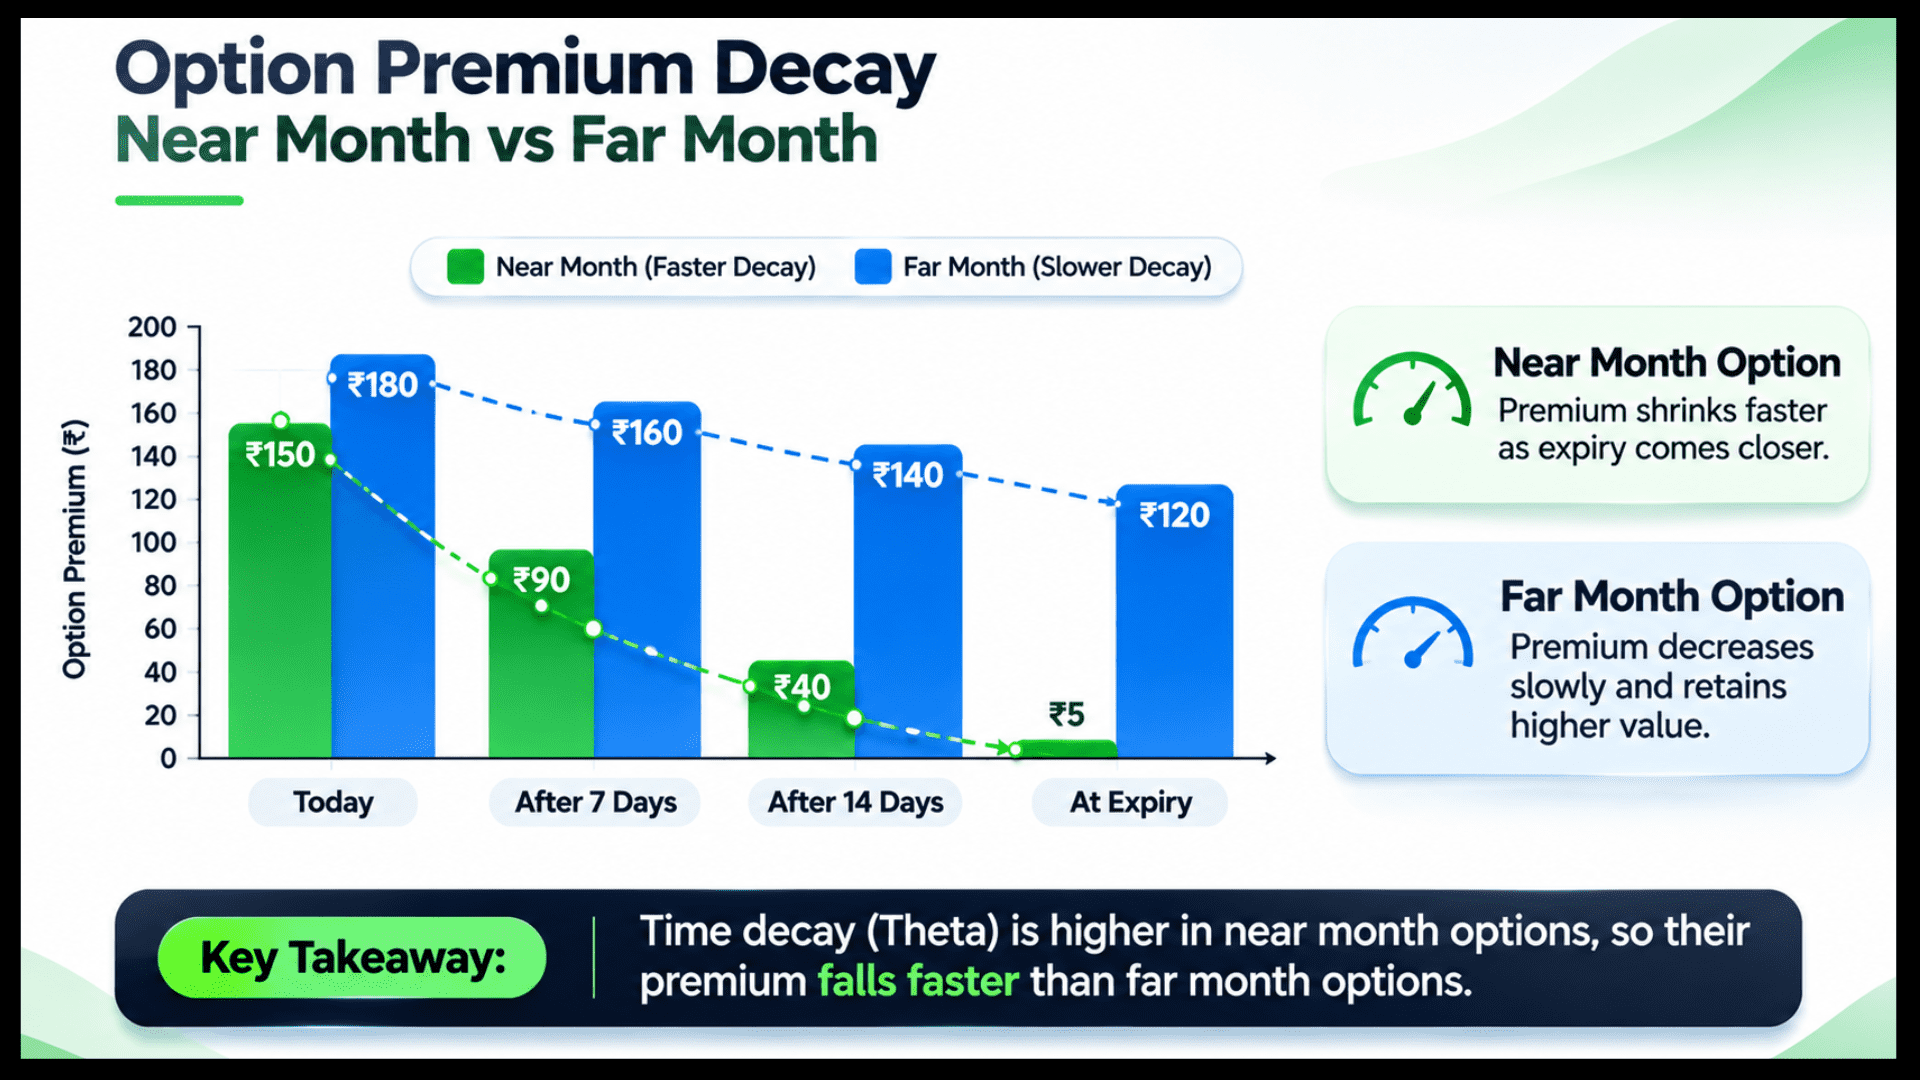
You sell the near expiry and buy the far expiry. Because the far option has more time value, you pay a net amount, called the net debit.
New to option structures? See how to learn option strategies and where a time spread fits.
How to Build a Long Calendar Spread?
Next, let us look at the structure. It has only two legs, and both sit on one strike.
The most common version uses calls, but the same idea works with puts. Think of it as two bets on one strike. You sell the option that fades quickly and buy the one that fades slowly.
The next section turns this into real numbers. Meanwhile, using the same strike keeps it a pure time play.
Using different strikes makes it a diagonal spread, which is a separate structure.
Using two strikes in the same expiry gives a vertical spread instead, and the Bull Call Spread Strategy is the most common example.
Selling the near leg means margin and risk rules apply to that leg. Margin and charges differ by broker and exchange, so verify them before any real trade.
Therefore, learn how option trading margin is calculated before you sell the near leg.
Which Market Condition Fits a Calendar Spread?
Before any trade, match the strategy with your view. Here we see what kind of market a calendar spread likes.
This strategy suits a trader who expects the underlying to stay near the strike until near expiry. It is a mildly neutral view, unlike the Bear Put Spread Strategy, which needs a moderate fall to pay off.
However, it also carries a view on volatility. The far option has more vega, so a rise in implied volatility helps and a fall hurts.
For a refresher on that sensitivity, read about vega in options trading before going further.
Calendar Spread Example
Now, let us put numbers on it. Take a hypothetical index at 20,000.
We use Black-Scholes with a 0% interest rate and 15% volatility. One lot is 50 units, for illustration only, and real lot sizes are revised by the exchange, so verify.
Calendar Spread Net Debit: What Does It Cost?
First, price both legs with the same model. The gap between them is what you pay to enter.
The near call (30 days, strike 20,000) is worth 343.09. Likewise, the far call (60 days, strike 20,000) is worth 485.17.
Net debit = 485.17 – 343.09 = 142.08 points, or 7,104 per lot. That debit is the most you can lose here.
Calendar Spread Payoff Table at Near Expiry
Next, see what happens when the near leg expires. The result changes with every index level.
The table below lists the result at nine index levels. The far call is valued by Black-Scholes with 30 days left and the same 15% volatility. The short call is valued at intrinsic value only.
| Index at near expiry | Far call value | Short call payoff | P&L per unit | P&L per lot (50) |
|---|---|---|---|---|
| 19,000 | 47.73 | 0.00 | -94.35 | -4,718 |
| 19,250 | 86.49 | 0.00 | -55.59 | -2,780 |
| 19,500 | 145.87 | 0.00 | 3.79 | 190 |
| 19,750 | 230.43 | 0.00 | 88.35 | 4,418 |
| 20,000 | 343.09 | 0.00 | 201.02 | 10,051 |
| 20,250 | 484.54 | -250.00 | 92.46 | 4,623 |
| 20,500 | 653.11 | -500.00 | 11.04 | 552 |
| 20,750 | 845.28 | -750.00 | -46.79 | -2,340 |
| 21,000 | 1,056.45 | -1,000.00 | -85.63 | -4,281 |
Here, P&L per unit = far call value – short call intrinsic value – net debit of 142.08.
Notice the shape. Profit peaks when the index sits exactly at the strike and fades on both sides.
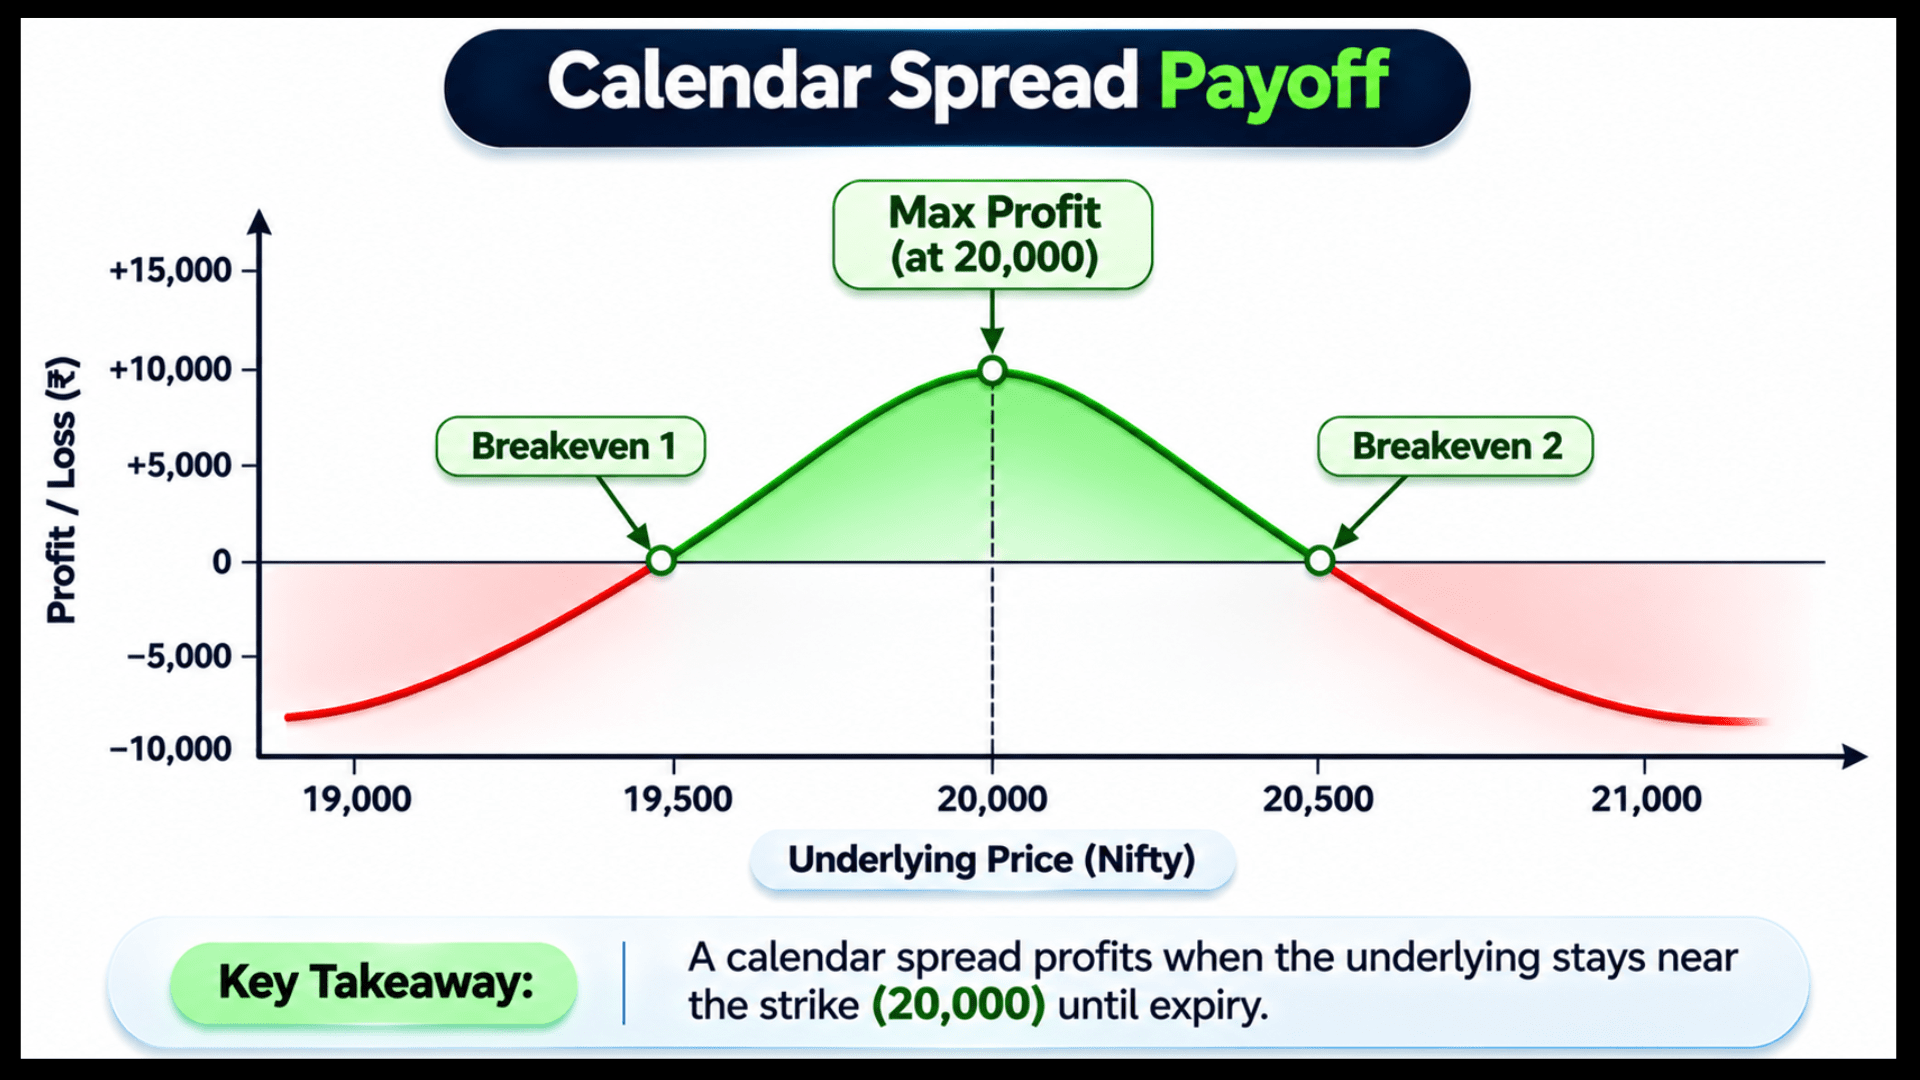
The curve uses a model value for the far leg, so it shifts if volatility changes.
Calendar Spread Max Profit, Max Loss and Breakeven Formulas
Use these ideas as a guide, not a fixed rule. The table below puts the example numbers next to the general idea.
| Item | Result in this example | General idea |
|---|---|---|
| Maximum profit | About 201 per unit (10,051 per lot) at 20,000 | Occurs near the strike at near expiry; not fixed, depends on volatility |
| Maximum loss | 142.08 per unit (7,104 per lot) | Net debit paid, under the assumptions above |
| Lower breakeven | About 19,487 | Where far call value equals the debit |
| Upper breakeven | About 20,541 | Same logic on the upside |
Breakevens were found by scanning index levels in steps of 0.5 with the same model. A different volatility or interest rate shifts them.
The maximum loss equals the debit only when the far leg is still valued by the model. Treat these as estimates, because the far option keeps changing in price after near expiry.
So, verify the numbers with your own calculator.
How Time Decay and Volatility Impact a Calendar Spread?
Time and volatility decide this trade. Here is how each one changes the payoff.
Why Time Decay Is the Engine of a Calendar Spread?
Time decay is the engine of this trade. Here is why the near leg does most of the work.
The near option decays faster. So, the short leg gains more from time passing than the long leg loses. That is the core edge of the structure.
The Role of Volatility in Calendar Spread Returns
Time is only half the story. Volatility can lift or cut the same payoff.
Volatility matters too. With the index at 20,000 and the near leg expired, the result changes with the far option’s volatility.
At 12% volatility on the far call, P&L is 132.41 per unit (6,620 per lot). At 15% it is 201.02 (10,051 per lot), and at 18% it is 269.62 (13,481 per lot).
These figures come from the same model at 0% rate, with the index at the strike. A drop in volatility cuts the result sharply, so a calendar is not just a time trade.
Calendar Spread Gamma Risk: Why Sharp Moves Hurt
One more factor sits in the background. It explains why sudden moves feel so painful.
Gamma also shapes the ride. The short near leg has higher gamma, so sharp moves hurt faster.
This note on option gamma meaning explains why.
How Gamma Risk Can Hurt Your Calendar Spread During Sharp Moves?
The strategy looks gentle, but it has real ways to go wrong. Here are the risks and mistakes to watch.
- Big moves in either direction push the index away from the strike and shrink or erase profit.
- Falling implied volatility reduces the value of the far leg, even if the index stays still.
- Early assignment risk on the short leg exists for American-style options; check contract rules.
- Poor liquidity in the far month can mean wide bid-ask gaps and slippage.
- Ignoring costs such as brokerage and taxes, which eat into small spreads.
Beginners often forget that the short call gains intrinsic value above the strike. Read up on intrinsic value of options to see how.
How to Exit or Adjust a Calendar Spread?
Traders commonly think about exits before entering, not after. These are general ideas, not instructions.
- Close the whole spread before near expiry instead of letting the short leg expire.
- Decide a maximum loss in advance, such as a fraction of the debit.
- Roll the short leg to the next month if the view remains the same, as some traders do.
- Close the spread if the index drifts far from the strike, rather than hoping for a return.
However, any adjustment adds costs and new risk. So, test the idea before using money.
When the Calendar Spread Fails?
It tends to struggle in three situations. First, a sharp trending move such as a result-day gap.
Second, a volatility collapse after an event, since the far leg loses value. Third, thin far-month trading where you cannot exit at a fair price.
Backtests can show these cases, though they cannot promise future results. A primer on backtesting options trading strategies explains how to test fairly.
Calendar Spread vs Long Strangle: Which One Fits Your View?
Both structures involve volatility, but they ask for opposite market views. The table below compares them side by side.
| Feature | Calendar spread | Long strangle |
|---|---|---|
| Main view | Index stays near strike | Large move in either direction |
| Legs | Sell near, buy far (same strike) | Buy out-of-the-money call and put |
| Cost | Net debit | Net debit |
| Helped by | Time decay of near leg | Big move or rising volatility |
| Hurt by | Big move, falling volatility | Time decay, quiet market |
Because their views are opposite, comparing them side by side helps beginners see what each really bets on. For a related big-move structure, see how to create a long straddle.
How to Practise the Calendar Spread Strategy Before Real Money
Spreads with a short leg need margin and attention. So, practise with virtual money first, track every leg, and note how the payoff changed as expiry approached.
Many beginners skip this stage. That is one reason why option buyers lose money.
Quick Checklist Before You Try a Calendar Spread
Run through these questions on paper first. They take five minutes and can save a costly mistake.
- What is my view: quiet index or big move?
- What is the net debit, and can I afford to lose all of it?
- Which expiry is the near leg, and when will I exit?
- What happens to my payoff if volatility falls five points?
- What are the brokerage, tax and margin costs for both legs?
Two expiries, one strike, and you still freeze before choosing which leg to sell?
Reading about spreads helps, but live charts and a mentor who answers your doubts make it click.
Join our live classes from your mobile, ask your doubts and learn step by step.
Conclusion
In short, a calendar spread sells a near-month option and buys a far-month option at the same strike.
It pays when the index stays near that strike as the near leg fades. However, big moves and falling volatility work against it.
To manage these risks, always monitor time decay closely against sudden price shifts. Finally, practise virtually first, and remember that this is learning, not a buy or sell call.
Disclaimer: This page is for education only and is not investment advice. All prices, strikes, and lot sizes are hypothetical, and lot sizes are set by the exchange.
Options carry risk, and selling legs can require large margin. Past results do not guarantee future results, and there is no profit guarantee.
Frequently Asked Questions
Before investing capital, invest your time in learning Stock Market.
Fill in the basic details below and a callback will be arranged for more information: