

Markets don’t move in straight lines. They surge, then pause. They run, then catch their breath.
And if you trade long enough, you’ll notice something frustrating yet fascinating: most of your confusion happens during corrections, not trends.
That’s where understanding corrective wave types becomes powerful.
When you use Elliott wave analysis, you realize trends are driven by motive waves.
Corrections? They’re the market’s reset button. Messy. Emotional. Often misleading. But predictable in structure.
Let us explain the corrective wave types.
What Is Corrective Wave Elliott Wave Theory?
According to the corrective wave Elliott wave theory, corrections occur against the trend and typically have three waves: A, B, and C.
When you identify an Elliott Wave Chart Pattern on your screen, you are essentially looking for the transition between these corrective phases and the impulsive ones.
Corrective wave patterns are slower and more multifaceted, unlike impulse waves, which have five distinct legs.
- Motive waves move with the trend in 5 waves.
- Corrective waves move against the trend in 3 waves.
That sounds simple. It is. But trading them? That’s where it gets interesting.
Corrections serve one key function. They relieve overbought or oversold conditions. Think of them as market digestion.
After a strong rally in Nifty or Bank Nifty, the price often pulls back in a structured way before continuing higher.
And no, not all pullbacks are the same. That’s why knowing the types of corrective waves matters.
Types Of Corrective Waves
There are three primary corrective wave types in Elliott Wave theory:
- Zigzag
- Flat
- Triangle
Each has a distinct personality. Yes, personality. Traders who watch charts daily can feel the difference.
1. Zigzag Correction: Sharp And Direct
A zigzag is a strong countertrend move. It follows a 5 3 5 structure.
This zigzag correction pattern consists of:
- Wave A has 5 waves
- Wave B has 3 waves
- Wave C has 5 waves
Zigzags are aggressive. They correct deeply, often 50 percent to 61.8 percent of the previous impulse.
Real Trading Scenario:
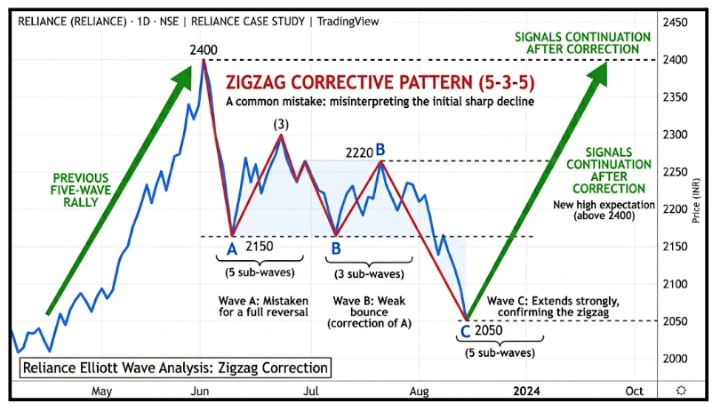
Suppose Reliance rallies from 2000 to 2400 in five waves. Then it drops sharply to 2150, bounces slightly to 2220, and falls again to 2050.
That sharp decline? Likely a zigzag.
Traders often mistake Wave A for a full trend reversal. But when Wave B is weak, and Wave C extends strongly, it signals continuation after correction.
Risk Tip: Never assume the trend is over after the first sharp drop. Wait for full A B C completion before entering.
Types Of Zigzag Corrections In Elliott Wave
There are three different kinds of zigzag corrections: single, double, and triple zigzags.
- Single zigzag (5-3-5): The simplest type of zigzag using Wave A and C as five and Wave B as a three-wave retracement.
- Double Zigzag (W-X-Y): This is a longer correction that uses seven waves that are organized in 5-3-5-X-5-3-5. The two zigzags are connected by Wave X, which usually moves up and down less than half of Wave W, whereas Wave Y runs past the terminus of Wave W.
- Triple Zigzag (W-X-Y-XX-Z): This is a difficult-to-find hybrid correction made up of three zigzags with two connector waves between them (X and XX).
The double and triple zigzags occur particularly often in the corrections of Waves 2 and Wave 4, when the market will require a longer time to make a further pullback and then continue on with the trend.
2. Flat Correction: Sideways Frustration
Flats are slower and more sideways. In a flat corrective pattern, the structure is 3-3-5.
- Wave A has 3 waves
- Wave B has 3 waves
- Wave C has 5 waves
Wave B often retraces close to the start of Wave A. Sometimes it even exceeds it. That’s called an expanded flat.
Chart Example:
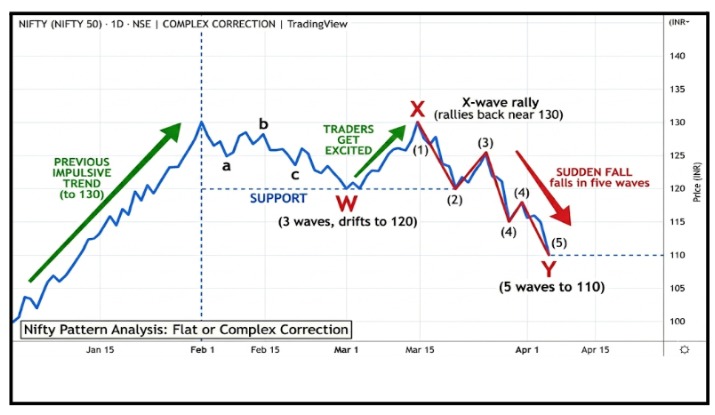
Price moves from 100 to 130 impulsively. Then it drifts down to 120 in three waves. It rallies back near 130. Traders get excited. Then suddenly it falls in five waves to 110.
That is classic flat behavior.
Emotionally, flats are exhausting. They trap both bulls and bears. Many traders overtrade here.
Risk Tip: During flat corrections, reduce position size. Sideways markets increase whipsaws.
Types Of Flat Corrections In Elliott Wave
Flat corrections appear in three variations. Each has a slightly different behavior in Wave B and Wave C.
- Regular Flat: Wave B retraces close to the start of Wave A but does not exceed it. Wave C usually ends near the end of Wave A. This creates a balanced sideways correction.
- Expanded Flat: The most common type in real markets. Wave B moves beyond the start of Wave A, creating a false breakout. Wave C then drops sharply and typically extends well past Wave A.
- Running Flat: The rarest form. Wave B exceeds the start of Wave A, but Wave C fails to travel far and ends before reaching the end of Wave A. This usually happens in very strong trending markets.
3. Triangle Correction: Coiling Energy
Triangles are five-wave sideways patterns labeled A B C D E. Each wave subdivides into three waves.
They form in contracting ranges.
You’ll often see:
- Lower highs
- Higher lows
- Tightening volatility
Triangles usually appear before the final move of a larger pattern.
Real Market Scenario:
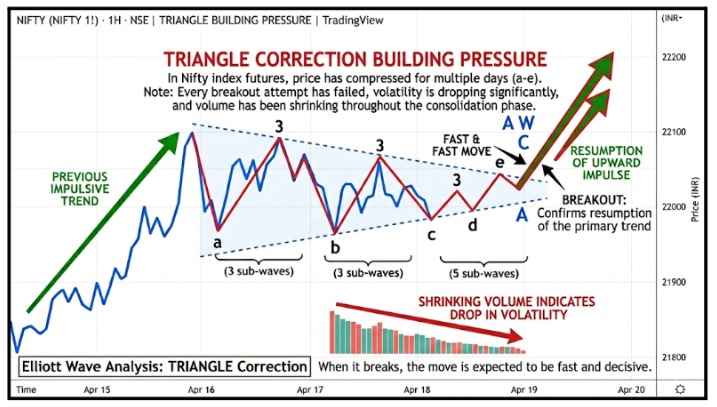
In index futures, you might see price compression for days. Every breakout fails. Volatility drops. Volume shrinks.
That’s a triangle building pressure. When it breaks, the move is fast.
Risk Tip: Avoid predicting direction inside a triangle. Trade the breakout, not the noise.
Types Of Elliott Wave Triangles
Elliott Wave theory identifies four triangle types, not just the commonly discussed contracting triangle. Every pattern represents another type of market structure and/or trader behavior.
- Contracting triangular: This is the most widely occurring type in that the highs are becoming lower and the lows are becoming higher, resulting in a tightening range before a breakout.
- Ascending Triangle: This is one in which the resistance level is flat and the lows are increasing. The buyers are slowly becoming more powerful, and a breakout is normally towards the upside.
- Descending Triangle: Shows falling highs with a flat support level. Sellers apply pressure, increasing the probability of a downside breakout.
- Expanding Triangle: This occurs when the highs and lows start to expand, and the volatility and uncertainty increase.
Note: Expanding triangles are extremely rare in corrective structures and are more commonly observed in specific wave positions like Wave B
Since the different types of triangles are formed in different ways, traders tend to change the time they enter the market, their prospects of breaking out, and their risk based on the type of triangle pattern that is being formed on the chart.
Complex Corrective Wave Patterns
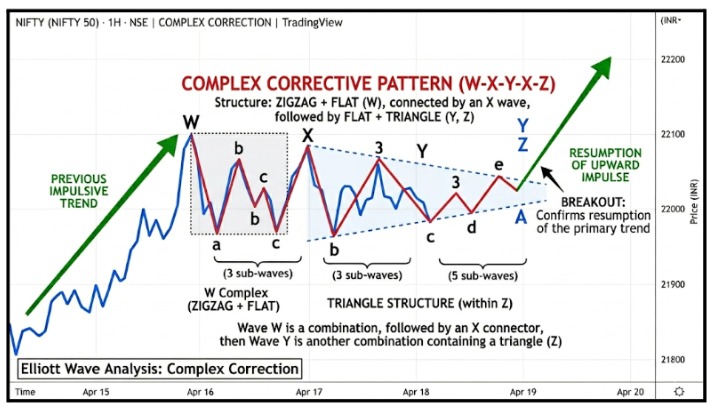
Here’s where things get tricky. Sometimes corrections combine.
These are called double or triple threes.
Structure looks like:
- Zigzag plus Flat
- Flat plus Triangle
Connected by an X wave.
A double corrective pattern often emerges here to stretch the correction sideways, keeping the market in a range for longer than expected.
Because complex patterns like the WXY corrective pattern consume more time than price, they tend to drift horizontally, testing your patience far more than a simple pullback would.
If your stop loss keeps getting hit in a range, you might be inside a complex correction.
Professionally, this is when many traders step aside. Capital preservation is also a strategy.
Quick Comparison Table
Have a look at the comparison table of corrective wave types:
| Pattern Type | Basic Structure | Market Behavior | Typical Depth Using Fibonacci Retracement Levels |
| Zigzag | 5 3 5 | Strong and quick countertrend move, price corrects sharply before the trend resumes | Often retraces 50% to 61.8% Fibonacci retracement levels of the previous impulse move |
| Flat | 3 3 5 | Price moves sideways with overlapping candles, correction takes more time | Usually retraces around 38.2% to 50% Fibonacci retracement levels |
| Triangle | 3 3 3 3 3 | Tight consolidation where price compresses before a breakout | Typically shallow, around 23.6% to 38.2% Fibonacci retracement levels |
| Double Three (WXY) | A combination of two corrections connected by an X wave | An extended sideways correction where the market struggles to choose a direction | Retracement varies widely, often 38.2% to 61.8% Fibonacci retracement levels, depending on the structure |
How Traders Actually Use Corrective Wave Types?
Let’s keep this real.
Professional traders do three things with corrective wave types:
- They wait for correction completion before entering trend trades.
- They avoid aggressive trading inside sideways flats or triangles.
- They use Fibonacci retracements to estimate likely termination zones.
For example:
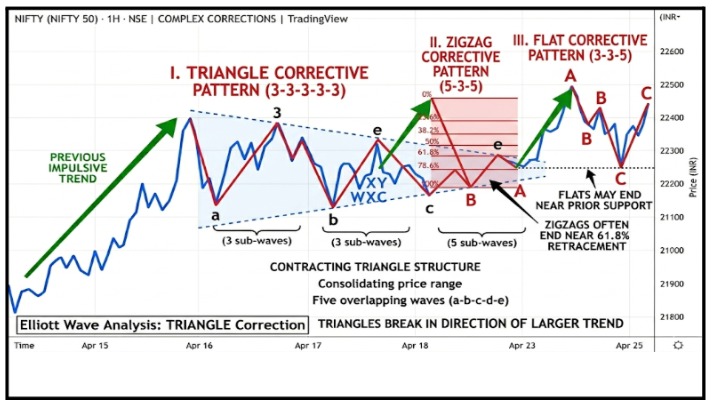
- Zigzags often end near 61.8 percent retracement.
- Flats may end near prior support.
- Triangles break in the direction of the larger trend.
But here’s the catch. Elliott Wave is a guideline, not a guarantee.
Sometimes what looks like a zigzag morphs into a complex correction. That’s normal. Flexibility matters more than prediction.
If you trade options, corrections are even more critical. Time decay eats premium during sideways corrections. Understanding this can save money.
Common Mistakes Traders Make With Corrective Wave Types
Even experienced traders misread corrective wave types. Corrections are deceptive by nature. They look like reversals. They feel like breakouts. But they often aren’t.
Here are common mistakes that are seen repeatedly:
- Assuming every sharp fall is a trend reversal instead of a zigzag correction.
- Trading aggressively inside flat corrective wave patterns where the price is clearly sideways.
- Forcing wave counts when the structure is still incomplete.
- Ignoring Fibonacci retracement levels during the corrective wave in Elliott wave theory analysis.
- Overleveraging during triangle consolidation phases.
Simple fix?
Wait for structure confirmation. Corrections reward patience, not prediction.
Conclusion
Corrections are where discipline is tested. Trends feel easy. Corrections feel confusing. But once you truly understand corrective wave types, you stop reacting emotionally.
You wait. You measure. You plan.
The market will always offer another opportunity, but only to those who respect its structure and trade with clarity. Master the corrections, and the trends will take care of themselves.
And sometimes, not trading is the best trade.
Want to master corrective wave types with real chart breakdowns and live examples?
Join our stock market classes today and start trading with clarity.
FAQs
Q1: How Many Corrective Wave Types Exist In Elliott Wave Theory?
Ans: There are three main types: zigzag, flat, and triangle. Complex corrections combine these into double or triple patterns.
Q2: Are Corrective Waves Always Three Waves?
Ans: Basic corrections follow A B C structure. Triangles have five segments, but each subdivides into three waves.
Q3: Can Corrective Wave Patterns Predict Trend Reversal?
Ans: Not directly. Corrections usually pause a trend, not reverse it. A full five-wave impulse in the opposite direction signals reversal.
Before investing capital, invest your time in learning Stock Market.
Fill in the basic details below and a callback will be arranged for more information:


