

Markets never move in a straight line, and if you have ever tried to make sense of a messy price chart, you already know how overwhelming it can feel.
Every trader, at some point, looks for a way to cut through the noise and find the actual trend. That is exactly where the merits and demerits of moving average method become important to understand.
The moving average method is one of the most widely used tools in both trading and statistics because it simplifies complex data and makes trends easier to read.
But like any tool, it works well in some situations and struggles in others.
Knowing both sides helps you use it smarter and avoid the common mistakes most traders make. In this blog, let us break it all down in a simple and straightforward way.
What is the Moving Average Method?
Let’s start with the basics before talking about advantages and disadvantages. To find patterns, the moving average approach averages data points over a certain time period.
In trading, it tracks price direction. In statistics, it smooths data, particularly time series.
Many beginners ask is moving average a good indicator for their specific strategy, and the answer depends on the market condition.
Types Of Moving Averages:
- Simple Moving Average (SMA)
- Exponential Moving Average (EMA)
- Weighted Moving Average
When deciding which exponential moving average to use, short-term traders often prefer the 9 or 21 EMA for quick reactions, while long-term investors stick to the 50 EMA or 200 EMA for trend strength.
Simple Example:
If a stock closes at 100, 102, 104, 106, and 108 over 5 days:
- 5-day moving average = 104
This smooths short-term fluctuations and highlights the trend. It’s simple, which is both its biggest strength and its biggest weakness.
The same ease of use might cause traders to ignore important market background, which is where errors frequently start.
Step-By-Step Moving Average Calculation Example
Theory makes sense, but an example makes it clearer. To illustrate how the moving average approach truly functions in practice, let’s examine a straightforward time series example.
Understanding the moving average calculation is essential because it shows you exactly how the data is smoothed over time.
This will help us understand the merits and demerits of moving average method as well.
3-Year Moving Average Example:
|
Year |
Sales (₹ Lakhs) | 3-Year Moving Total | 3-Year Moving Average |
|
2018 |
100 | – | – |
| 2019 | 110 | 330 |
110 |
|
2020 |
120 | 345 | 115 |
| 2021 | 115 | 355 |
118.3 |
|
2022 |
120 | – |
– |
- For 2019: (100 + 110 + 120) ÷ 3 = 110
- For 2020: (110 + 120 + 115) ÷ 3 = 115
- For 2021: (120 + 115 + 120) ÷ 3 = 118.3
Notice that the first and last years have no values. This happens because there isn’t enough data to form a full three-year group.
This example shows both the strengths and the limitations of the method.
One of its main disadvantages is that, although it efficiently smooths trends, it also results in data loss at the end.
Merits of Moving Average Method
Let’s start with why so many traders and analysts swear by this method. The biggest advantage is simplicity, but there are several other advantages of moving average that make it a staple in any toolkit.
You do not need complex formulas or advanced software to use it.
The calculation is straightforward, and the result is a clean line that tells you where the trend is heading.
It smooths out short-term price fluctuations, so you are not reacting to every small candle on the chart. Instead of getting distracted by noise, you stay focused on the bigger picture.
This alone saves traders from a lot of unnecessary and costly mistakes.
It also works as dynamic support and resistance. When Nifty is in an uptrend and pulls back to its 50-day moving average, traders treat that level as a buying opportunity.
It is not a coincidence. It works because thousands of traders are watching the same level at the same time.
Other key advantages include:
- Works across all timeframes and markets
- Easy to update as new data comes in
- Helps separate trend, seasonal, and cyclical patterns in time series data
- Removes the impact of sudden price spikes
- Gives consistent and objective results every time
Demerits of Moving Average Method
Now for the honest part. The moving average method has some real limitations that you need to know before relying on it.
The biggest problem is that it is a lagging indicator. It is always based on past data, which means by the time a signal appears, a good portion of the move is already done.
If a stock jumps from 500 to 550, the moving average crossover might only show up at 540. You have already missed the early entry.
It also struggles in sideways markets. When the price is just moving back and forth without a clear direction, moving averages generate a lot of false signals.
Traders who blindly follow every crossover in a choppy market often end up taking losses repeatedly.
Other limitations worth knowing:
- Loses data points at the beginning and end of a dataset
- Different time periods give different results, making period selection confusing
- Cannot predict future price movements, only reflects past behaviour
- Not suitable for short datasets, as very few usable data points remain
- Irregular or sudden market events often get smoothed out and ignored
The moving average method is reliable but not complete on its own. Always combine it with price action, volume, or other indicators for better accuracy.
Moving Average Method Advantages and Disadvantages
The moving average method is widely used to simplify data and identify trends, but like any tool, it comes with both strengths and limitations.
Understanding its merits and demerits helps traders and analysts use it more effectively and avoid common pitfalls.
|
Aspect |
Advantages Of Moving Average Method | Disadvantages Of Moving Average Method |
| Data Handling | Smoothes data by removing short-term fluctuations and highlighting the overall trend |
Ignores sudden price changes and may hide important market movements |
|
Ease Of Use |
Simple to calculate and easy to understand, suitable for beginners | Oversimplification can lead to missing deeper insights |
| Trend Identification | Clearly identifies bullish or bearish trends |
Lagging nature delays trend recognition |
|
Market Application |
Widely used in stock markets, economics, and time series forecasting |
Not effective in sideways or low-volatility markets |
|
Signal Reliability |
Works well in strong trending conditions and captures major price moves |
Generates frequent false signals in choppy markets |
|
Objectivity |
The same data and time period always give consistent results, removing subjectivity |
Results depend heavily on the chosen time period, which can vary between traders |
|
Flexibility |
Easy to update with new data by dropping the oldest values and adding the latest ones |
Frequent adjustments in period settings can create confusion |
|
Impact Of Extreme Values |
Reduces the effect of sudden spikes or abnormal data points |
Important extreme events may get smoothed out and ignored |
|
Time Series Analysis |
Helps separate trend, seasonal, and cyclical components | Cannot fully isolate irregular or random fluctuations accurately |
| Forecasting Ability | Useful for understanding past and current trend direction |
Cannot predict future prices, only reflects past behavior |
|
Data Requirements |
Works well with large datasets for clearer trends | Not suitable for short datasets, as it reduces usable data points |
| Edge Data Limitation | Provides stable average values within the dataset range |
Loses initial and final data points, leaving gaps at both ends |
|
Strategy Use In Trading |
Acts as dynamic support and resistance in trending markets | Delayed signals may cause late entry and reduced profit potential |
| Period Selection | Flexible choice of time periods for different strategies |
No fixed rule for selecting the best period, making it subjective |
The moving average method offers clarity and structure, especially in trending markets.
However, its lagging nature and dependence on past data mean it should always be combined with other tools for better accuracy.
Practical Example:
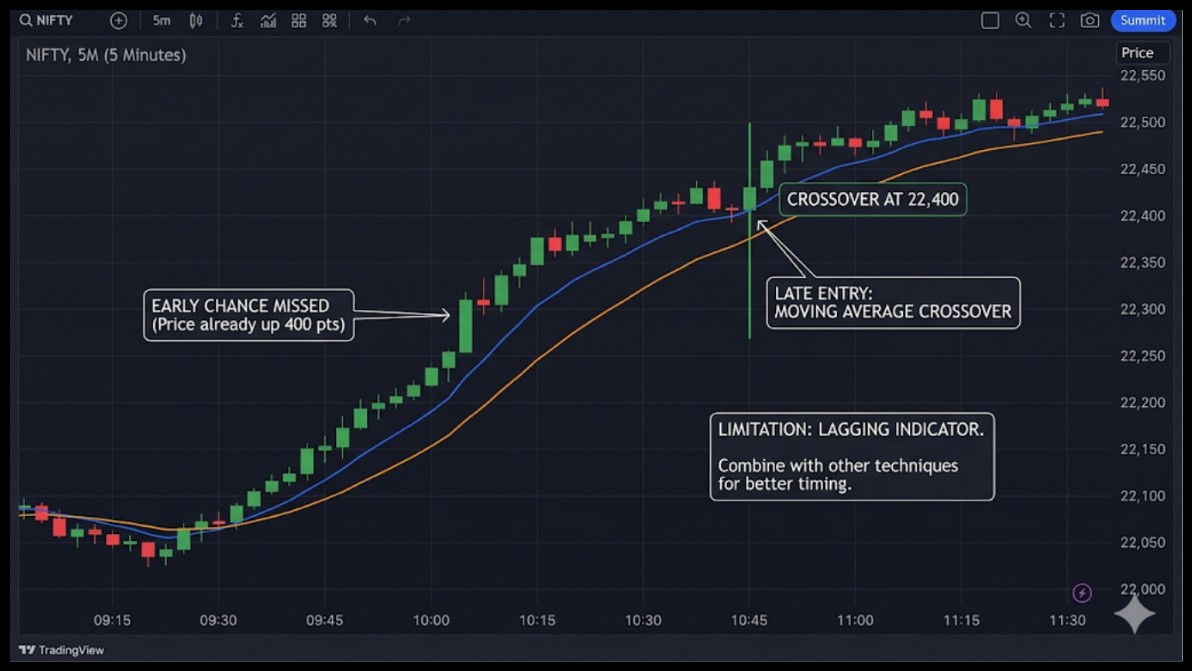
A stock climbs swiftly from 500 to 550. At 540, the moving average crossover occurs. The early chance has already been lost.
The approach is dependable but not flawless. Because of its lagging nature, traders need to use it in conjunction with other techniques to enhance timing.
Merits And Demerits of Moving Average Method In Time Series
Data analysis and trading both depend on the benefits and drawbacks of the moving average technique in time series.
It is important for simplifying complex data and making long-term trend interpretation easier for decision-making.
Where It Helps:
- Removes seasonal fluctuations
- Highlights long-term trends
- Simplifies complex datasets
Where It Falls Short:
- Cannot capture sudden changes
- Ignores extreme values
- Not suitable for irregular data patterns
Example In Time Series:
Moving averages are useful for identifying growth trends across months in sales data. On the other hand, sudden spikes caused by festivals or other events could be smoothed out and missed.
Although it is an effective tool for trend analysis, it should not be used alone when precise forecasting is needed.
Merits And Demerits of the Ratio to Moving Average Method
The merits and demerits of ratio to moving average method are particularly relevant in seasonal analysis. It helps separate trend and seasonal effects, giving a clearer view of underlying data patterns.
Now, what is the ratio of the moving average method? It is used to calculate seasonal indices by comparing actual data with moving averages.
This helps separate seasonal effects from the overall trend in the data.
As a result, analysts can better understand recurring patterns like festive demand or quarterly sales cycles.
Advantages:
- Helps identify seasonal patterns
- Useful for business forecasting
- Removes trend effects from data
Disadvantages:
- Time-consuming calculations
- Requires consistent data
- Errors in moving averages affect the final results
Example:
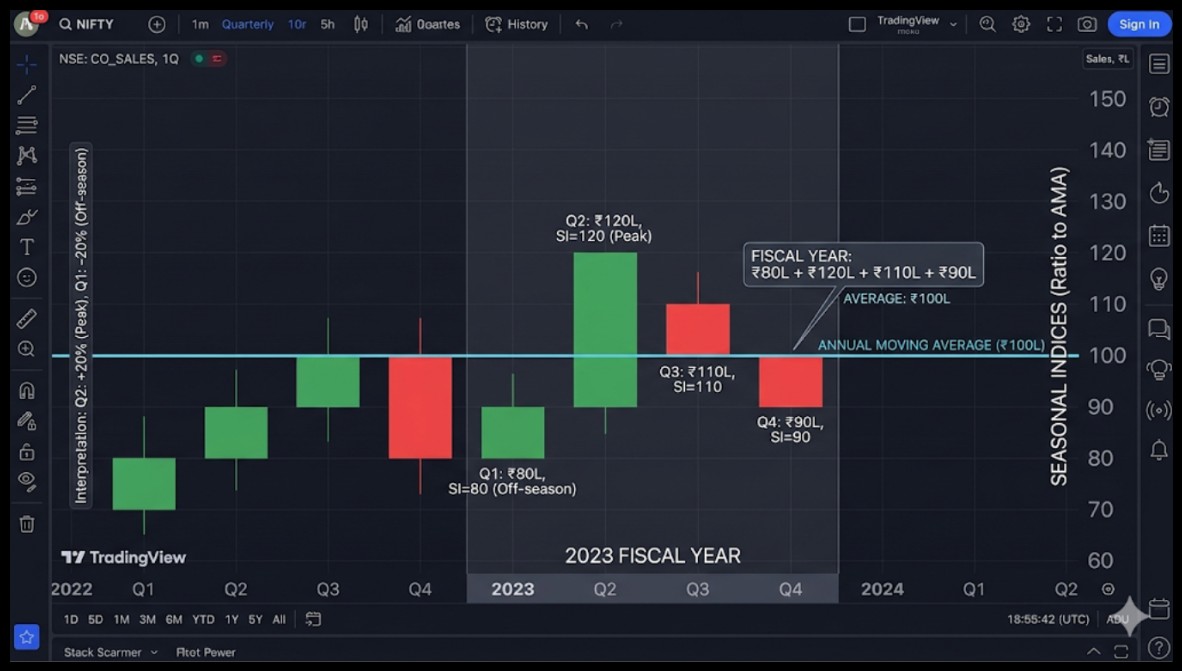
A company’s quarterly sales in a year are: Q1 = ₹80L, Q2 = ₹120L, Q3 = ₹110L, Q4 = ₹90L. The annual moving average = (80+120+110+90) ÷ 4 = ₹100L
Seasonal indices (ratio to moving average): Q1 = 80/100 × 100 = 80, Q2 = 120/100 × 100 = 120, Q3 = 110, Q4 = 90.
Interpretation: Q2 is 20% above the annual average (peak season). Q1 is 20% below (off-season). This seasonal pattern can now be used to adjust future forecasts.
Conclusion
The merits and demerits of moving average method tell you one simple thing: it is a powerful tool, but not a complete system on its own.
It works beautifully in trending markets, simplifies complex data, and helps you stay focused on the bigger picture. But in choppy or sideways conditions, it can mislead you if you rely on it blindly.
The smartest traders do not just use moving averages; they combine them with price action, volume, and proper risk management.
Think of it as a guide that keeps you on the right track, not a guarantee that every trade will work out.
Use it wisely, stay disciplined, and the results will follow.
Understand the merits and demerits clearly before you trade. Join our technical analysis classes to learn how to use these tools correctly with real market examples.
FAQs
Q1: Is the Moving Average Method Suitable for Beginners?
Ans: Yes, it is simple and easy to understand. Before moving on to more complex strategies, beginners can use it to spot trends.
Q2: Why Do Moving Averages Give Late Signals?
Ans: Entry and exit points are delayed since it responds after the price has changed due to its reliance on historical data.
Q3: Is It Possible to Use Moving Average on Its Own?
Ans: It may be used on its own, but it increases accuracy and decreases false signals when combined with indicators like RSI or volume.
Before investing capital, invest your time in learning Stock Market.
Fill in the basic details below and a callback will be arranged for more information:


