

You have probably seen traders talk about the 9 EMA, the 50 EMA, the 200 EMA, and wondered which one actually matters for your trades.
Here is the truth: There is no single best EMA. The right one depends entirely on how you trade, what timeframe you use, and what you are trying to achieve from each setup.
Use the wrong EMA, and you will either get signals too late to act on or get pulled into trades that reverse the moment you enter.
Use the right one, and the market suddenly starts making a lot more sense.
That is exactly what this blog is about.
We break down which exponential moving average to use based on your trading style, with clear examples and practical guidance so you can stop guessing and start applying.
What Is Exponential Moving Average?
Before picking the right EMA, it’s important to understand what it does. The Exponential Moving Average gives more weight to recent prices, making it faster than a simple moving average.
This speed is what makes EMA popular among active traders.
The core advantages of moving average include their ability to smooth out “noise” and provide a clear visual of the trend, helping you see the market’s direction without getting distracted by every small price tick.
Unlike a basic moving average calculation that treats all days the same, the EMA focuses on current market reality to provide quicker signals.
What Is the Exponential Moving Average Formula?
- EMA = Price × Multiplier + Previous EMA × (1 − Multiplier)
- Multiplier = 2 ÷ (Period + 1)
While the formula explains how EMA updates, one key detail often missed is the starting point.
The first EMA value is calculated as a simple average (SMA) of the first N price points, and only after that is the standard formula applied.
For example: If you’re calculating a 9 EMA, the multiplier is 2 ÷ (9+1) = 0.20. If yesterday’s EMA was 100 and today’s price is 105, then today’s EMA = 105 × 0.20 + 100 × 0.80 = 101.
Why Traders Prefer EMA:
- Faster response to price movement
- Better for trend-following strategies
- Works well in volatile markets
So, if markets move quickly, EMA keeps up. That’s its biggest strength. It helps traders react faster to trend changes without waiting for delayed signals.
But speed is only one part of what makes EMA useful. The way price interacts around EMA levels is where the real trading edge starts to show up.
EMA As Dynamic Support And Resistance
EMA crossovers get attention, but the real strength of EMAs lies in how the price reacts around them.
Levels like 20, 50, and 200 act as dynamic support and resistance, where price either bounces, breaks, or pauses before continuing the trend.
These shifting levels change with price and are therefore more flexible than fixed zones.
For example:
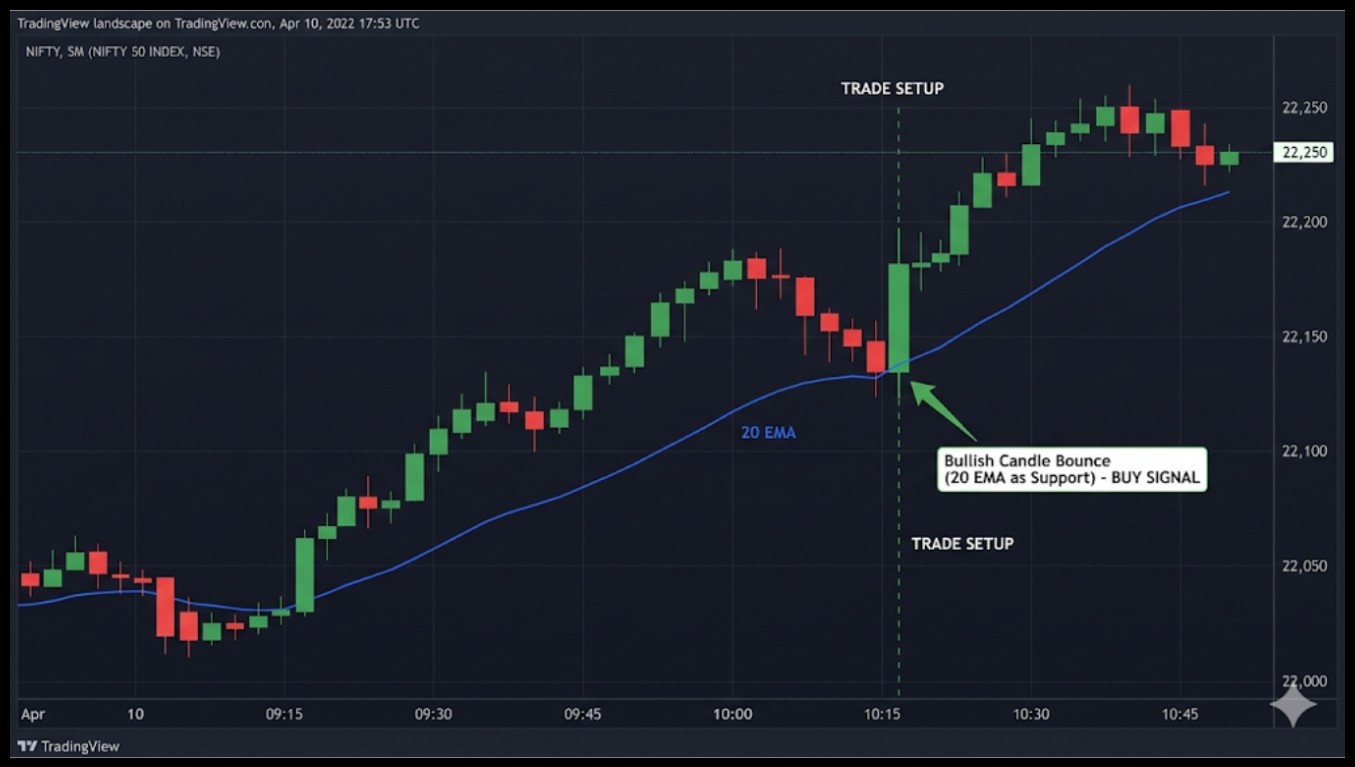
When price pulls back to the 20 EMA in an uptrend and forms a bullish candle, that bounce is often a high-probability buy signal.
Here, the EMA acts as support, giving traders a clear reason to stay with the trend rather than fight it.
Difference Between Moving Average And Exponential Moving Average
Now comes a common confusion. Many traders ask, what is the difference between a moving average and an exponential moving average?
While there are many types of technical indicators used to analyze the market, moving averages are the most fundamental.
Choosing between a Simple Moving Average (SMA) and an Exponential Moving Average (EMA) depends on how much “lag” you are willing to accept in your strategy.
Key Differences:
|
Feature |
Simple Moving Average | Exponential Moving Average |
| Speed | Slow |
Fast |
|
Weightage |
Equal | More weight to recent prices |
| Signal Timing | Delayed |
Early |
Which is better, a simple or an exponential moving average?
- SMA is better for long-term trend identification, weekly/monthly charts
- EMA is better for short-term momentum trading, daily/intraday charts
Ultimately, understanding the merits and demerits of moving average method is what helps a trader decide which version to apply to their specific strategy.
Here’s the contradiction. Faster signals from EMA are helpful, but they can also create false signals.
That’s why experienced traders combine EMAs with context, not blindly follow them.
So now that you know what EMA is and how it compares to SMA, the next question is the one that actually matters for your trading: which EMA should you be using?
Which Exponential Moving Average To Use?
This is where things get practical. There’s no single “best EMA.” It depends on how you trade.
Your timeframe, risk tolerance, and trading style all influence which EMA setup works best for you.
Common EMA Periods And Their Use:
- 9 EMA: Very fast, ideal for scalping
- 8 EMA: Fast day trading EMA, popular for 5-minute to 15-minute charts, often paired with the 21 EMA for intraday swing signals.
- 12 EMA and 26 EMA: form the foundation of the MACD indicator; these are the most widely used EMA periods globally, even though most traders access them through the MACD rather than as standalone EMAs.
- 20 EMA: Short-term trend tracking
- 50 EMA: Medium-term trend confirmation
- 200 EMA: Long-term trend direction
In Indian markets, certain EMAs carry more weight because institutional traders and analysts track them closely.
Many traders watch for a specific EMA crossover between these periods to confirm a shift in market sentiment.
Long-term investors and institutional traders closely watch the 200 EMA as a key trend reference.
Swing traders track the 50-day EMA for intermediate trend direction and use the 20-day EMA to time pullback entries.
When price reacts sharply at these levels, it usually signals strong market participation and a likely reversal or continuation.
Quick Guide:
|
Trading Style |
EMA To Use |
| Scalping |
9 EMA |
|
Intraday |
9 and 20 EMA |
| Swing Trading |
20 and 50 EMA |
|
Positional |
50 and 200 EMA |
When in doubt, start with the 20 EMA. It balances speed and stability well enough to keep you in a trend without reacting to every minor price movement.
Once you have the right EMA for your style, the next variable to account for is the market itself, because the same EMA can behave very differently depending on how volatile conditions are.
Adjusting EMA Period For Market Volatility
EMA selection isn’t only about trading style; market volatility plays a big role too. In high-volatility phases, like Bank Nifty during budget announcements or major earnings days, shorter EMAs such as 8 or 9 often become noisy and give false signals.
Many traders shift to slightly slower EMAs like 20 or 21 to smooth price action. In calmer, trending markets, faster EMAs work better as prices respect them more cleanly.
With the right EMA selected for your style and adjusted for current market conditions, the next step is learning how to actually use it to time your entries.
EMA Crossovers And Strategy Selection
Once you choose EMAs, the next step is how you use them. Crossovers are the most common method. But the real edge comes from combining crossovers with trend direction and proper timing.
Applying an EMA crossover for swing trading allows you to capture the meat of a move without getting shaken out by daily noise.
Basic EMA Crossover Rules:
- Short EMA crosses above long EMA → buy signal
- Short EMA crosses long EMA below → sell signal
- Confirm with price holding above or below EMAs
A classic 20 and 50 EMA crossover is often used by swing traders to identify when a medium-term trend is accelerating.
This combination filters out minor price spikes while keeping you aligned with the broader market move.
Example:
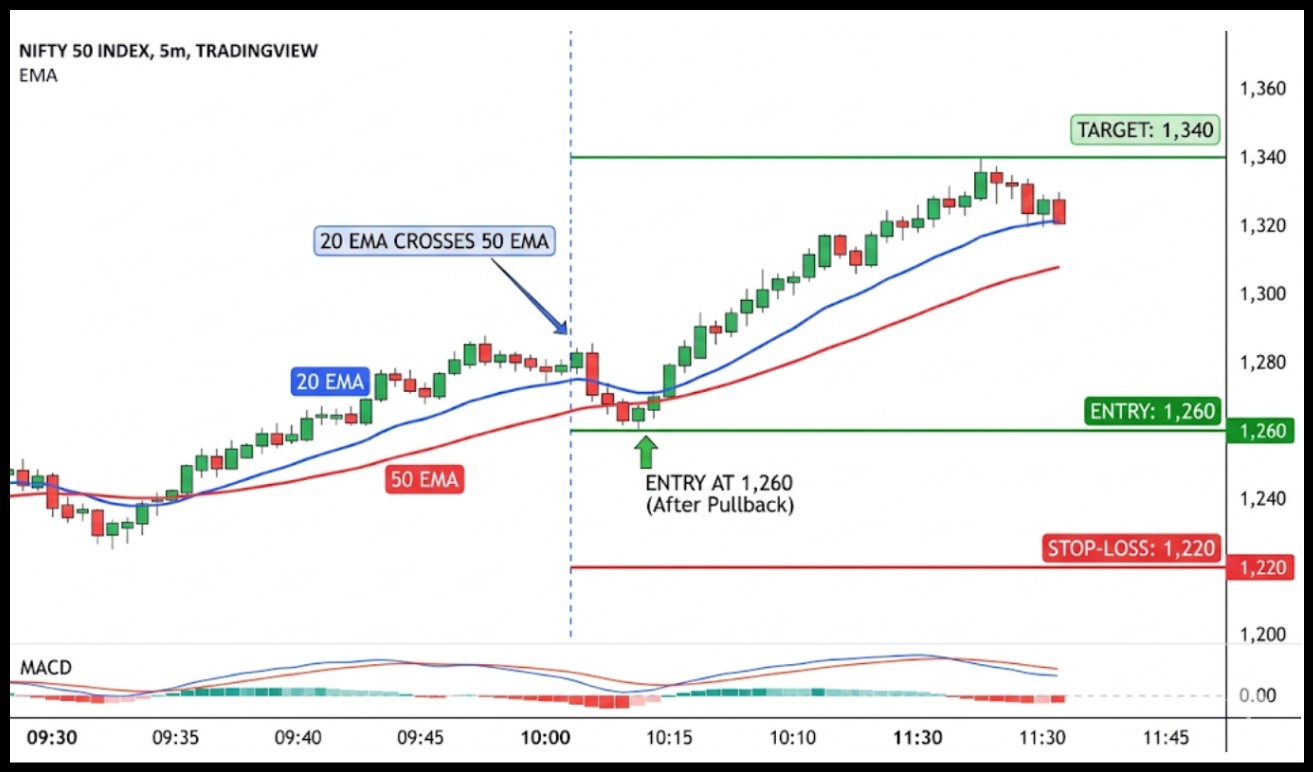
- 20 EMA crosses above 50 EMA
- Stock price at 1,250
- Entry at 1,260 after pullback
- Stop-loss at 1,220
- Target at 1,340
This is a classic swing setup. Simple, structured, and repeatable. When followed consistently, it removes guesswork and builds confidence over multiple trades.
The crossover logic stays the same across styles, but the specific EMAs and timeframes you apply it to will look quite different depending on whether you are trading intraday or holding for days.
EMA Settings For Different Trading Styles
Let’s connect this to real trading scenarios. Which EMA to use for swing trading is different from intraday trading.
For Swing Trading:
- Use 20 EMA and 50 EMA
- Focus on daily charts
- Hold trades for 3 to 10 days
For Day Trading:
- Use 9 EMA and 20 EMA
- Focus on 5-minute or 15-minute charts
- Capture quick momentum
Best EMA Crossover Strategy For Day Trading:
- Enter the crossover
- Exit quickly
- Avoid holding positions overnight
EMA crossover works best in trending conditions, not in flat or range-bound markets.
When the price moves sideways, it keeps crossing EMAs repeatedly, creating false signals and confusing entries.
In such phases, an EMA and Bollinger Band strategy becomes highly effective; you use the EMA to identify the trend’s strength while the Bollinger Bands help you spot overextended prices near the bands where a reversal is likely.
Using these together ensures you aren’t just blindly following a crossover into a dead market.
In these sideways phases, EMA should not be your primary decision tool; oscillators like RSI or Bollinger Bands tend to provide more reliable signals.
To make all of this concrete, let’s walk through an actual trade setup so you can see how EMA selection plays out in real numbers.
Real Trading Example
Let’s make this practical with a clear example. Clear numbers remove guesswork and help you understand how a trade is actually planned and executed.
Trade Setup:
- Stock: HDFC Bank
- Timeframe: Daily
- 20 EMA: 1,520
- 50 EMA: 1,500
- Price: 1,530
Entry Conditions:
- 20 EMA crosses above 50 EMA
- Price pulls back and holds above the 20 EMA
- Entry: 1,540
Risk And Target:
- Stop-loss: 1,500
- Risk: 40 points
- Target: 1,620
Outcome:
- Price moves steadily upward
- Target achieved in 5 sessions
This shows how EMA selection directly impacts trade clarity. The right combination helps you avoid noise and focus only on meaningful trend movements.
That clarity only holds, however, when the EMA is being used correctly. There are a few common mistakes that quietly undermine even the best setups.
Common Mistakes When Choosing EMA
Even experienced traders make small mistakes here. Using random EMA combinations without testing them on your preferred timeframe often leads to inconsistent results.
Mistakes To Avoid:
- Using too many EMAs on one chart
- Switching EMA settings frequently
- Ignoring the higher timeframe trend
- Trading in sideways markets
Another issue is overconfidence. A good EMA setup still needs discipline and risk control.
Not taking into consideration the market context can soon transform even the best setup into a losing trade.
Avoiding these mistakes gets you halfway there. The other half comes from building a few consistent habits that compound quietly over time.
Practical Tips For Better Results
Patterns can be made through minor adjustments. Sticking to your trading plan keeps decisions structured and stops you from second-guessing your strategy mid-trade.
- Stick to one EMA combination.
- Combine EMA with support and resistance
- Avoid low-volume stocks
- Wait for pullbacks instead of chasing entries
Consistency in approach often matters more than finding a “perfect” EMA. Sticking to one setup allows you to understand its behavior deeply and make better decisions over time.
Conclusion
Knowing which exponential moving average to use is not about finding a magic number. It is about matching the right tool to the way you actually trade.
If you are scalping on a 5-minute chart, a 200 EMA is not going to help you. If you are a positional trader holding for weeks, a 9 EMA strategy is just going to create noise.
The moment you align your EMA with your timeframe and your strategy, the signals become cleaner, and the decisions become easier.
Start with one combination. Watch how price behaves around it across different market conditions.
That observation, done consistently over time, will teach you more than any indicator setting ever could.
FAQs
Q1: Which EMA Is Best For Beginners?
Ans: 20 EMA is a good starting point as it balances speed and reliability. It helps understand trends without too much noise.
Q2: Is EMA Better Than SMA?
Ans: EMA reacts faster to price changes, making it better for active trading. SMA is more stable and suits long-term analysis.
Q3: Can I Use Multiple EMAs Together?
Ans: Yes, combining EMAs like 20 and 50 improves signal accuracy. It helps filter false entries and confirms trend direction.
Before investing capital, invest your time in learning Stock Market.
Fill in the basic details below and a callback will be arranged for more information:


