


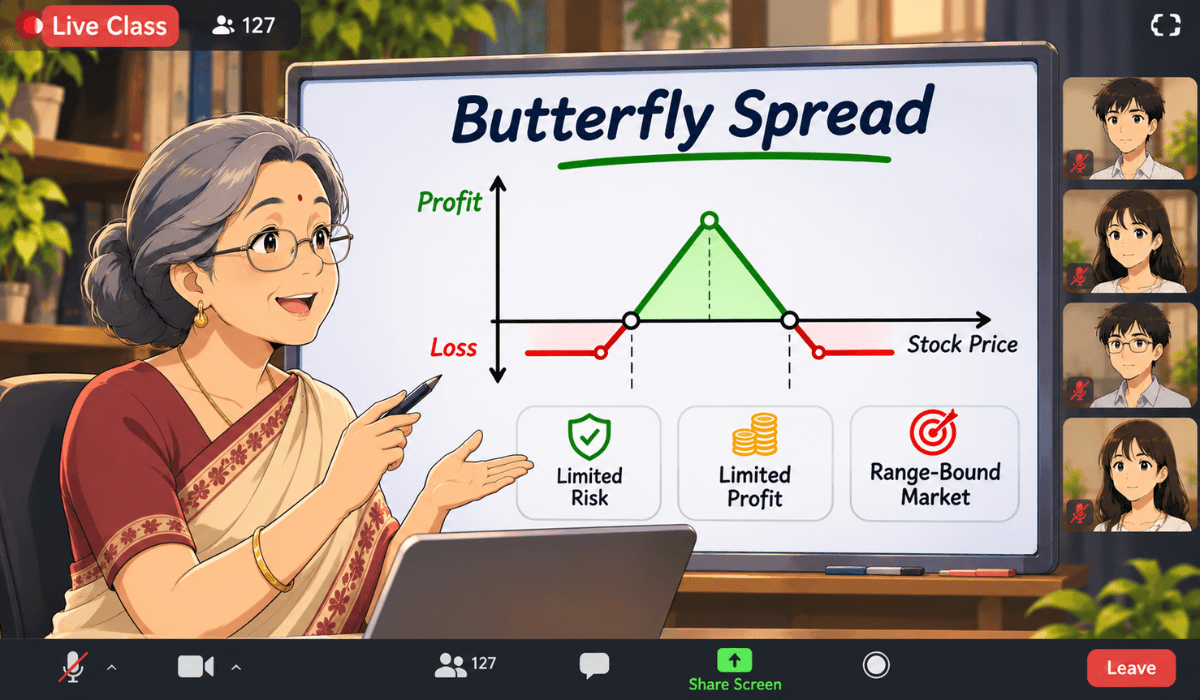
A butterfly spread in options is a low-cost strategy for when you expect the market to stay near one price. It uses three strikes and four options, and both profit and loss are capped.
This page explains the legs, the payoff, the breakevens and the risks, with one worked example.
What Is a Butterfly Spread in Options?
First, let us settle the meaning. In fact, every number later on this page rests on it.
A butterfly spread combines a bull spread and a bear spread, such as the Bear Put Spread Strategy, that meet at the same middle strike. The payoff chart looks like a tent, and the tent top sits at the middle strike.
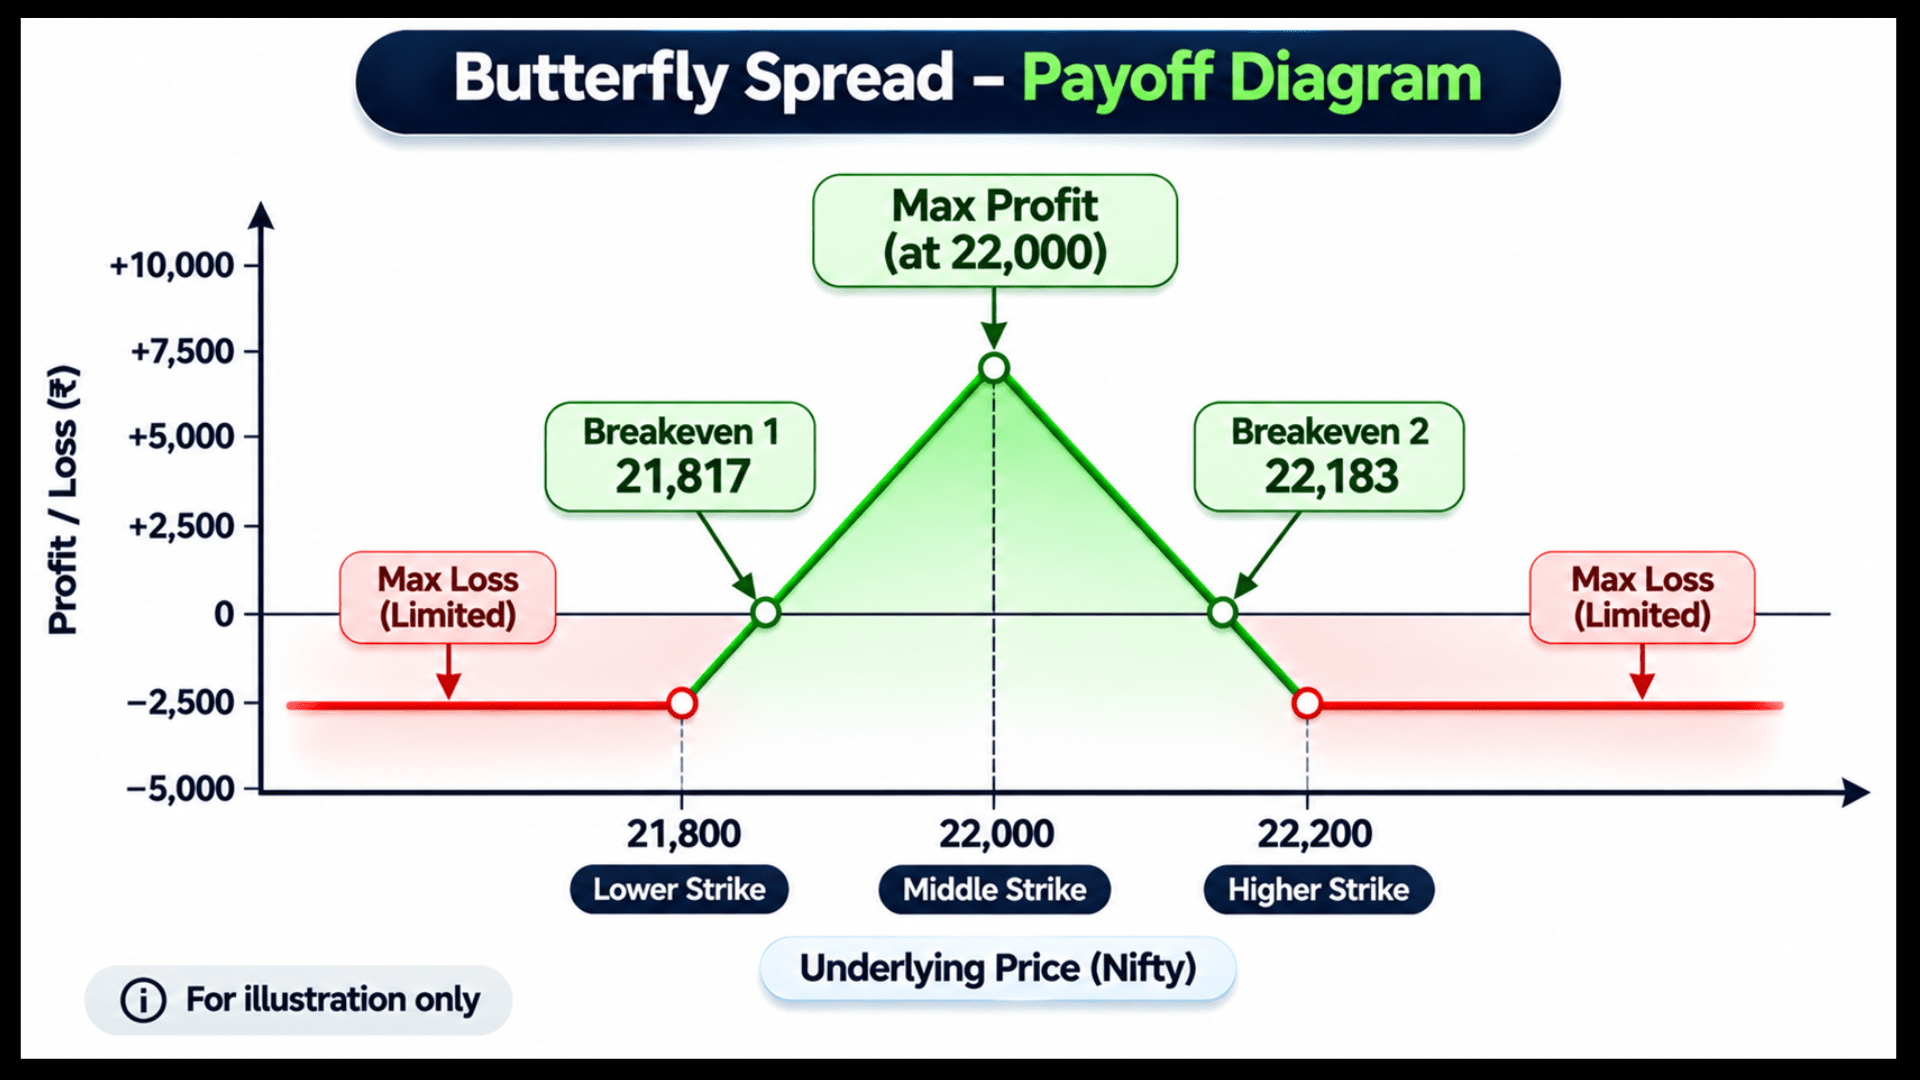
You earn the most when the underlying closes exactly at the middle strike on expiry. However, you lose a small, fixed amount if it closes far away on either side.
In short, think of it as a bet on “not much movement” with a safety net built in.
Long Call Butterfly Spread: Understanding the Legs and Structure
Next, let us look at the structure. It has four legs on three strikes, and each leg has a clear job.
The most common version is the long call butterfly. Its strikes are equally spaced, so we call them lower, middle and higher.
See the table below for the four legs. Of course, the numbers are hypothetical, for illustration only.
| Leg | Action | Option | Strike | Quantity |
|---|---|---|---|---|
| 1 | Buy | Call | 21,800 (lower) | 1 |
| 2 | Sell | Call | 22,000 (middle) | 2 |
| 3 | Buy | Call | 22,200 (higher) | 1 |
The two bought calls act as protection. Meanwhile, the two sold calls give the strategy its tent shape and reduce the cost.
In effect, the 21,800/22,000 legs form a Bull Call Spread Strategy, and the 22,000/22,200 legs form a bear call spread on top of it.
The same shape can be built with puts, and the payoff at expiry is the same. This page uses calls to keep things simple.
To see where it fits among other spreads, work through learning option strategies in a sensible order.
When to Use a Butterfly Spread?
Before any trade, match the strategy with your view. Here we see which market a butterfly likes.
A butterfly spread suits a neutral, low-movement view. You expect the underlying to expire close to the middle strike, with little swing.
It is not a direction bet. If you expect a big move either way, the long strangle strategy fits better.
For another big-move idea, see how to create a long straddle.
Because it is a debit strategy, you pay the net cost upfront. That cost is also your maximum loss.
Butterfly Spread Example
Now, let us build one example. Assume a hypothetical index trades at 22,000 with 30 days to expiry.
For illustration only, 1 lot = 50 units. Real lot sizes are revised by the exchange, so verify the current size.
Butterfly Spread Net Debit: What Does It Cost?
First, price all the legs with one model. The premiums come from Black-Scholes with 15% volatility and a 0% interest rate, rounded to whole points.
These are model values, and real quotes will differ. The model premiums are 484 for the 21,800 call, 377 for the 22,000 call and 287 for the 22,200 call.
Net debit = 484 + 287 – (2 x 377) = 17 points. For one lot, that is 17 x 50 = 850 (before charges).
Butterfly Spread Max Profit, Max Loss and Breakeven Formulas
These formulas apply at expiry, using intrinsic value only. Time value is ignored on purpose.
- Net debit = premium paid on both bought calls minus premium received on both sold calls.
- Maximum loss = net debit (price ends at or below the lower strike, or at or above the higher strike).
- Maximum profit = (middle strike – lower strike) – net debit.
- Lower breakeven = lower strike + net debit.
- Upper breakeven = higher strike – net debit.
In our example, the maximum loss is 17 points, or 850 per lot. The maximum profit is (22,000 – 21,800) – 17 = 183 points, or 9,150 per lot.
How to Find Butterfly Spread Breakevens?
Next, apply the breakeven formulas to the same example.
The breakevens are 21,800 + 17 = 21,817 and 22,200 – 17 = 22,183. Between those two levels the position ends in profit at expiry.
Notice the shape. You risk 17 points to chase a best case of 183. However, that best case needs the price to land very close to 22,000.
How to Read a Butterfly Spread Payoff Table at Expiry?
Now, let us see the profit or loss at different closing prices. The formula is below.
Payoff = max(S – 21,800, 0) – 2 x max(S – 22,000, 0) + max(S – 22,200, 0) – 17.
Here S is the closing price. The table below applies it to nine closing prices.
| Closing price | Payoff (points) | Payoff per lot (x 50) |
|---|---|---|
| 21,700 | -17 | -850 |
| 21,800 | -17 | -850 |
| 21,850 | 33 | 1,650 |
| 21,900 | 83 | 4,150 |
| 22,000 | 183 | 9,150 |
| 22,100 | 83 | 4,150 |
| 22,150 | 33 | 1,650 |
| 22,200 | -17 | -850 |
| 22,300 | -17 | -850 |
The table is symmetric, because the strikes are equally spaced. Profit falls steadily as the close moves away from 22,000.
Why a Butterfly Spread Costs So Little?
Most of the premium you pay on the lower call is paid back by the two sold calls. As a result, the net debit here is only 17 points against a 484-point lower call.
A lower cost also means a thinner margin of safety. The profit zone is narrow, so small misjudgements decide the result.
To see why an option has value beyond its payoff at expiry, read about the intrinsic value of options.
Butterfly Spread Greeks and Time: How It Behaves
Greeks and time shape the ride before expiry. Here is how a long butterfly usually behaves.
Butterfly Spread Delta and Time Decay
A long butterfly is usually close to flat in direction when the price sits near the middle strike. Its delta stays small, so early moves hurt less than they would for a single option.
Time works in your favour only when the price stays near the middle strike. Close to expiry the tent sharpens, and the position gains if price stays there.
Away from the middle strike, time hurts instead. A helpful refresher is what delta means in options trading.
Butterfly Spread and Volatility
Volatility also matters. A rise in implied volatility can lower the value of a long butterfly near the centre.
How Butterfly Spread Margins and Transaction Costs Impact Profit?
A long butterfly has all legs bought or hedged, so the maximum loss is known upfront. Still, margin and charges vary by broker and exchange rules, so verify them before trading.
Learn how option trading margin is calculated before you size a trade.
Moreover, four legs mean four orders. Brokerage, exchange charges, taxes and slippage apply to each. On a 17-point debit, these costs can take a large share of the profit.
If you ever sell a leg without the matching protection, you add margin needs and much larger risk. Selling legs always carries more risk than buying.
Butterfly Spread vs Iron Condor vs Long Strangle
The right structure depends on your view. This quick table compares three neighbours at a general level.
| Strategy | View | Risk and reward | Net cash flow |
|---|---|---|---|
| Long butterfly | Stay near one price | Limited both ways | Debit |
| Iron condor | Stay inside a range | Limited both ways, wider profit zone | Credit |
| Long strangle | Big move either way | Limited loss, large reward | Debit |
A butterfly targets one price, while a condor targets a range. Therefore, the structure is closely related to the Iron Condor Strategy, which uses a credit and a wider profit zone.
If “iron condor strategy” in that line is already a live link, this only changes the anchor to the exact key phrase; tell me if you’d rather keep the old anchor and I’ll place the new one elsewhere.
In contrast, the long strangle sits at the other end, since it needs movement to pay off.
Butterfly Spread Risks and Early-Exit Ideas
The main risk is that price drifts away from the middle strike. Then you lose the whole net debit, though never more than that.
A second risk is cost. Charges on four legs can turn a small theoretical profit into a loss.
These are general ideas people use, not advice:
- Decide your exit before you enter, such as a target or a time limit.
- Close the position early if the view no longer holds, instead of waiting for expiry.
- Avoid holding through events that can cause sharp gaps.
- Keep the position small, since the best case is rare.
Many beginners lose money because they chase low-cost trades without understanding them. The patterns are covered in why option buyers lose money.
Common Butterfly Spread Mistakes to Avoid
These are the slips we see most often. Watch for each one before you place a trade.
- Picking strikes too close. The profit zone becomes tiny and costs eat it.
- Expecting the maximum profit. It needs a close almost exactly at the middle strike.
- Ignoring charges. Four legs make costs a big part of a small trade.
- Entering with no view. The strategy only makes sense if you expect low movement.
- Skipping the expiry maths. Always check the payoff table before entering.
When a Butterfly Spread Srategy Fails
It fails when the market makes a strong move in either direction before expiry. Results, news or a sharp trend can push price past the outer strikes.
It also fails when volatility jumps and the price still stays near the centre. The mark-to-market value can dip before it recovers.
Learn how vega affects option prices before you hold through such days.
How to Practise a Butterfly Spread Before Using Real Money
Start with virtual or paper trades. Build the four legs, record your net debit, and compare it with the expiry payoff table.
Do this across several expiries, with different strikes. Notice how often price lands in the profit zone, and how charges change the result.
Testing on past data adds more evidence. A good starting point is backtesting options trading strategies.
Reading about payoffs helps, but live option chains and a mentor’s answers make it click.
Join our live classes from your mobile, ask your doubts and learn step by step.
Conclusion
In short, a long butterfly spread suits a neutral view and caps both profit and loss. The maximum loss is the net debit, and the maximum profit sits at the middle strike.
However, it needs precise timing and carries real cost drag. Finally, treat it as a learning tool first, and remember that this is education, not a buy or sell call.
Disclaimer: All numbers here are hypothetical and for illustration only, including strikes, premiums and “1 lot = 50 units”. Real lot sizes, margins and charges change, so verify them.
This is education, not investment advice, and not a recommendation to trade. Options involve risk of loss, and there is no profit guarantee.
Frequently Asked Questions
Before investing capital, invest your time in learning Stock Market.
Fill in the basic details below and a callback will be arranged for more information: