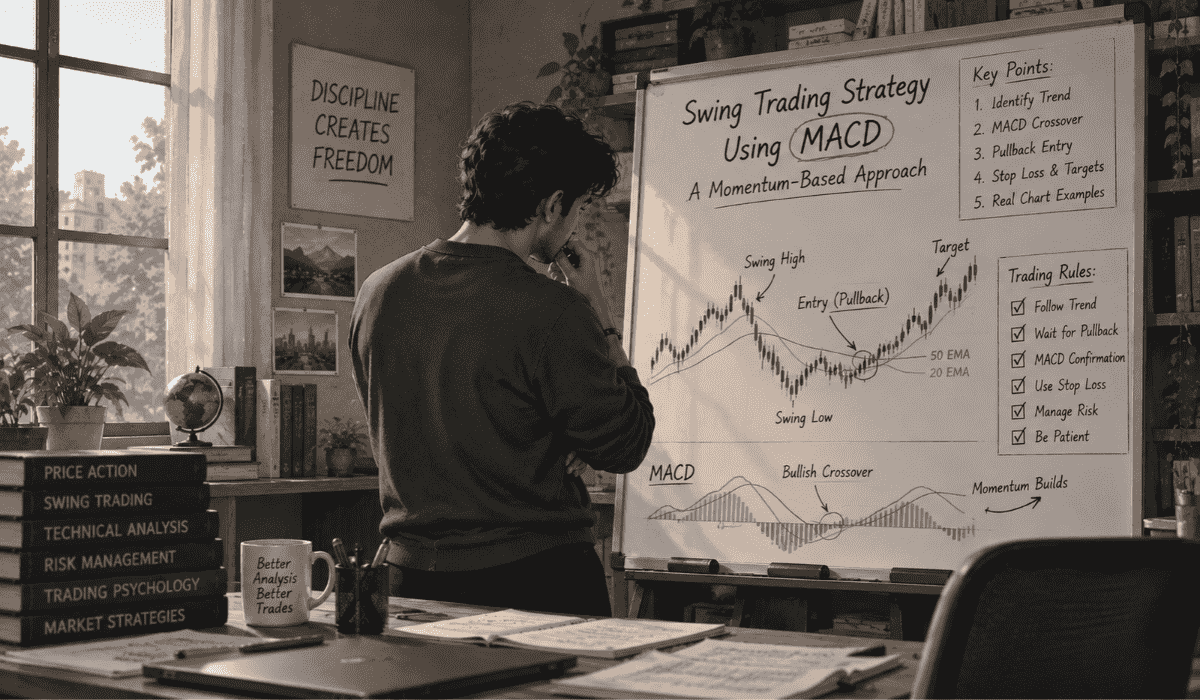



Few chart patterns are as visually obvious and as consistently useful as a cup and handle swing trading strategy.
It gives you something most setups do not: a built-in way to measure your profit target before you even enter the trade, based on the shape of the pattern itself.
What Does the Cup and Handle Pattern Actually Look Like?
The pattern has two parts. First, a “cup,” a rounded, U-shaped dip and recovery that typically forms over several weeks to a few months.
Second, a “handle,” a smaller, shorter pullback that forms near the cup’s previous high, usually lasting days to a couple of weeks.
Picture a stock that runs up, pulls back and rounds out a bowl shape as it recovers most of that pullback.
Traders often validate this visual recovery by swing trading with technical analysis tools to monitor momentum and trend strength.
It then drifts slightly lower one more time in a tighter, shallower dip before finally breaking out above the old high.
Why Does This Pattern Keep Working?
The cup phase reflects institutions quietly accumulating shares while the stock recovers from its dip.
The handle phase shakes out shorter-term, impatient holders right before the real move, which is exactly why the breakout that follows often comes with a noticeable jump in volume.
Real Setup or Fake-Out? The Measurements That Decide
Not every rounded dip qualifies as a tradeable cup and handle. Look for:
Cup depth: roughly 12% to 33% retracement of the prior uptrend. Deeper than that and the pattern’s odds of working start to drop.
Handle retracement: no more than 8% to 12% pullback from the cup’s high. A handle that falls too far starts to look like a failed pattern rather than a healthy pause.
Volume pattern: volume should generally decline through the cup and handle formation, then spike noticeably on the actual breakout.
The Trade Setup, Step by Step
Where Should You Enter?
Entry: Buy when price closes 2% to 3% above the handle’s resistance level, ideally accompanied by a volume spike well above the recent average.
For extra confirmation, a swing trading strategy using MACD can act as a momentum check, while a swing trading strategy using RSI helps confirm the breakout is not already overextended.
Alternative entry (retest): Some traders prefer to wait for a pullback to the breakout level on declining volume, followed by a bullish reversal candle.
They enter on that retest instead of chasing the initial breakout.
Where Does the Stop Loss Go?
Stop loss: Below the handle’s low, or two to three times the average true range below your entry if the handle’s low sits too far away for a sensible risk.
Applying strict swing trading risk management principles ensures that an unexpected breakdown will not devastate your overall trading capital.
H3: How Far Can the Profit Target Run?
Profit targets: This is where the pattern earns its reputation. Measure the depth of the cup from its low to its high, then project that same distance upward from the breakout point.
Many traders scale out at 62%, 100%, and 161.8% of that measured move, the same ratios used in swing trading with Fibonacci retracements, treating each as a partial profit-booking level rather than one single exit point.
Worked Example: The Cup and Handle on Mphasis
Suppose Mphasis has run up from ₹2,100 to ₹2,450, then pulls back into a rounded cup bottoming near ₹2,180 before recovering back toward ₹2,430.
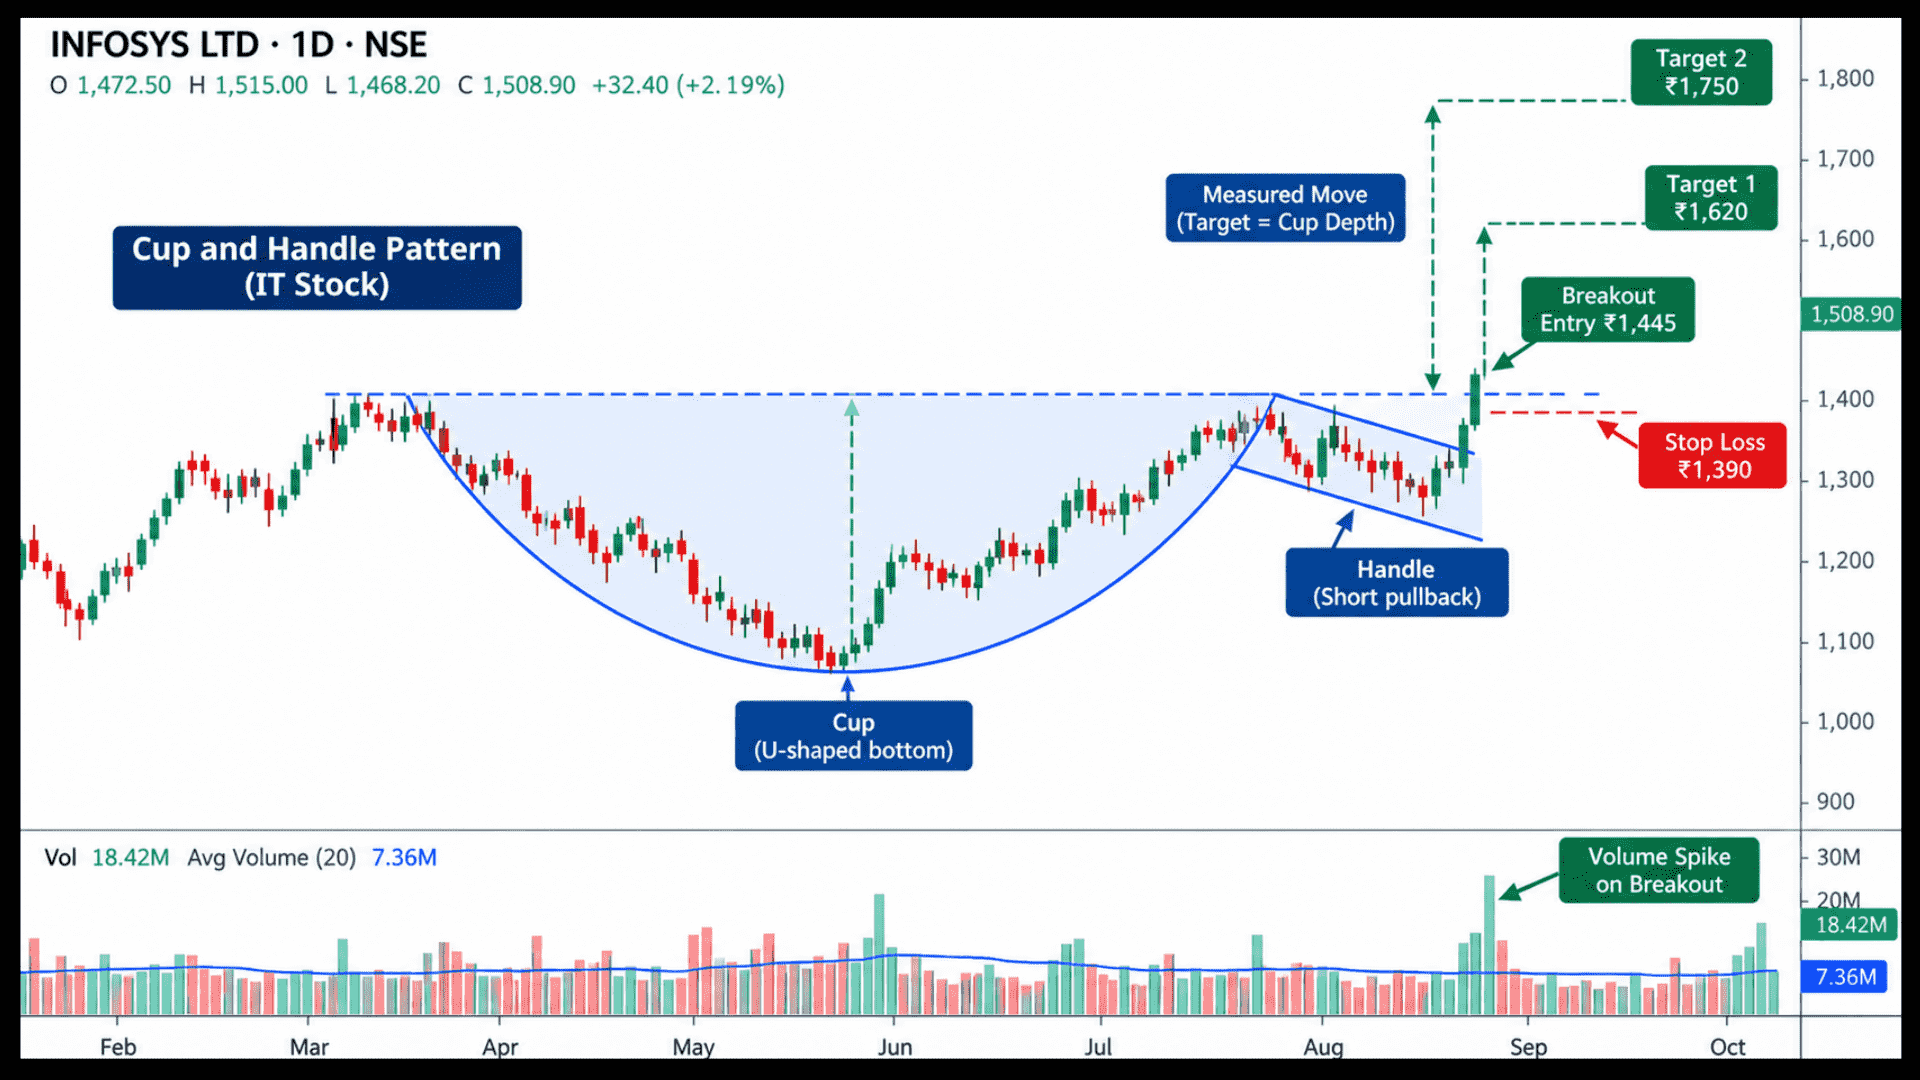
It then forms a handle, drifting down to ₹2,360 over eight sessions on declining volume, before breaking out above ₹2,430 with volume nearly double its 20-day average.
Cup depth here is ₹270 (₹2,450 minus ₹2,180). You enter on the breakout at ₹2,445, with your stop at ₹2,340, just under the handle low.
Your first target, at 62% of the cup depth projected from the breakout, sits near ₹2,613. Your second target, at 100% of the cup depth, sits near ₹2,715.
Flip It Upside Down: The Inverse Cup and Handle
The pattern also appears upside down in downtrends, called the inverse or bearish cup and handle, traded as a breakdown continuation setup rather than a breakout.
If your swing trading extends into bearish markets, our post on swing trading strategy in bear markets covers how this inverse pattern fits into a broader downtrend approach.
It also covers the India-specific point about how to actually take a short position through futures or options.
Which Timeframe Should Swing Traders Actually Use?
While the cup and handle can technically form on any timeframe, swing traders should focus on the daily chart.
There, the full formation typically takes anywhere from seven weeks to well over sixty weeks, depending on the stock and the broader market backdrop.
Utilizing Swing Trading with AI analytics during this extended observation phase helps filter out market noise and tracks accumulation trends more objectively.
Shorter intraday versions of this pattern exist but are far less reliable for a multi-day swing trade.
Mistakes That Quietly Ruin a Good Setup
Trading a cup that is too deep is the most common one. A cup retracing 50% or more of the prior uptrend has largely erased the strength that made the pattern worth trading.
Entering before the breakout actually confirms is the second. A handle that is still drifting lower, with no volume pickup yet, is not a signal.
Violating fundamental swing trading rules by jumping into positions prematurely often leads to unnecessary losses on fake breakouts.
It becomes one only once price closes above resistance with real conviction behind it.
Why Does the Handle Matter More Than Beginners Expect?
Traders new to this pattern, especially those still following a swing trading strategy for beginners, often focus entirely on the cup and treat the handle as a minor formality.
In practice, the handle is where a lot of setups actually fail.
A handle that is too deep (more than roughly 12% off the cup’s high), that drifts sideways too long without tightening, or that shows rising volume on the way down is a warning sign.
A tight, well-behaved handle on falling volume, similar to the squeeze traders watch for in swing trading with Bollinger Bands, is one of the better tells that the setup is likely to work.
Why Bet Everything on One Exit? Scale Out Instead
Rather than treating the measured move target as a single all-or-nothing exit, many traders scale out in parts.
Using the Mphasis example, a common approach is booking a third near ₹2,613 (62% target) and another third near ₹2,715 (100% target).
The final third runs with a trailing stop, such as the moving average used in a swing trading EMA strategy, in case the move extends toward the 161.8% extension.
This trades away some upside on a runaway winner in exchange for locking in gains along the way.
It tends to suit swing traders better psychologically than holding out for one exit price the stock may never quite reach.
Where Does This Pattern Show Up Most Often?
The cup and handle tends to appear more frequently in stocks recovering after a broader market correction, once indices like Nifty or Sensex have pulled back and started climbing again.
Many participants engaging What is swing trading look for these specific recovery phases to catch strong trend reversals early.
Individual stocks that fell alongside the market and are now basing and recovering are the most fertile ground, more so than stocks that never really corrected.
Can You Spot This Pattern Before the Breakout Happens?
A cup and handle is easy to identify once the breakout has already played out.
Learning to recognize early precursors in various swing trading patterns helps traders anticipate breakouts rather than chasing them after the fact.
Catching it while the handle is still forming, and confirming it correctly with volume, is a different skill built through repetition.
Our swing trading classes cover pattern-based setups like this one live, on real Indian stocks.
Conclusion: Let the Pattern Set Your Targets
The cup and handle stands out because it hands you a measured profit target before you ever place the trade.
Focus on the daily chart, keep the cup within a healthy depth, and demand a tight handle on falling volume.
Enter only once price closes above resistance with a clear volume spike, and place your stop just under the handle’s low.
Scaling out at 62%, 100%, and 161.8% of the measured move locks in gains while leaving room for bigger runs.
Spotting the setup early takes practice, and that is where structured swing trading classes help.
Frequently asked questions
Before investing capital, invest your time in learning Stock Market.
Fill in the basic details below and a callback will be arranged for more information: