



Mastering swing trading with technical analysis involves reading price charts, indicators, volume, and patterns to time entries and exits on moves that play out over days to weeks, not months or years.
This guide brings together the full picture: how trend, support and resistance, volume, momentum indicators, and chart patterns fit together into one coherent approach.
If you are completely new to the concept of swing trading itself, start with our swing trading strategy for beginners guide first.
This post assumes you already understand the basic idea of holding a position for several days to catch a price swing.
It is also the natural next step if you want to learn technical analysis in a way that is tied directly to real trade decisions.
Why Do Charts Beat Gut Feeling in Swing Trading?
Fundamental analysis tells you whether a company is a good business.
It does not tell you when a stock is likely to move in the next one to three weeks, which is exactly the window a swing trade lives in.
Technical analysis, by contrast, is built entirely around timing: reading what price and volume are actually doing right now.
You use that to plan an entry, a stop loss, and an exit before the trade even happens.
Many modern market participants are now exploring Swing Trading with AI to quickly analyze historical price action and optimize these entry and exit thresholds.
That is why nearly every serious swing trading approach leans on charts first.
The 5-Step Technical Framework Every Swing Trader Needs
Most losing swing trades don’t fail because of a bad indicator. They fail because the trader skipped a step in the analysis.
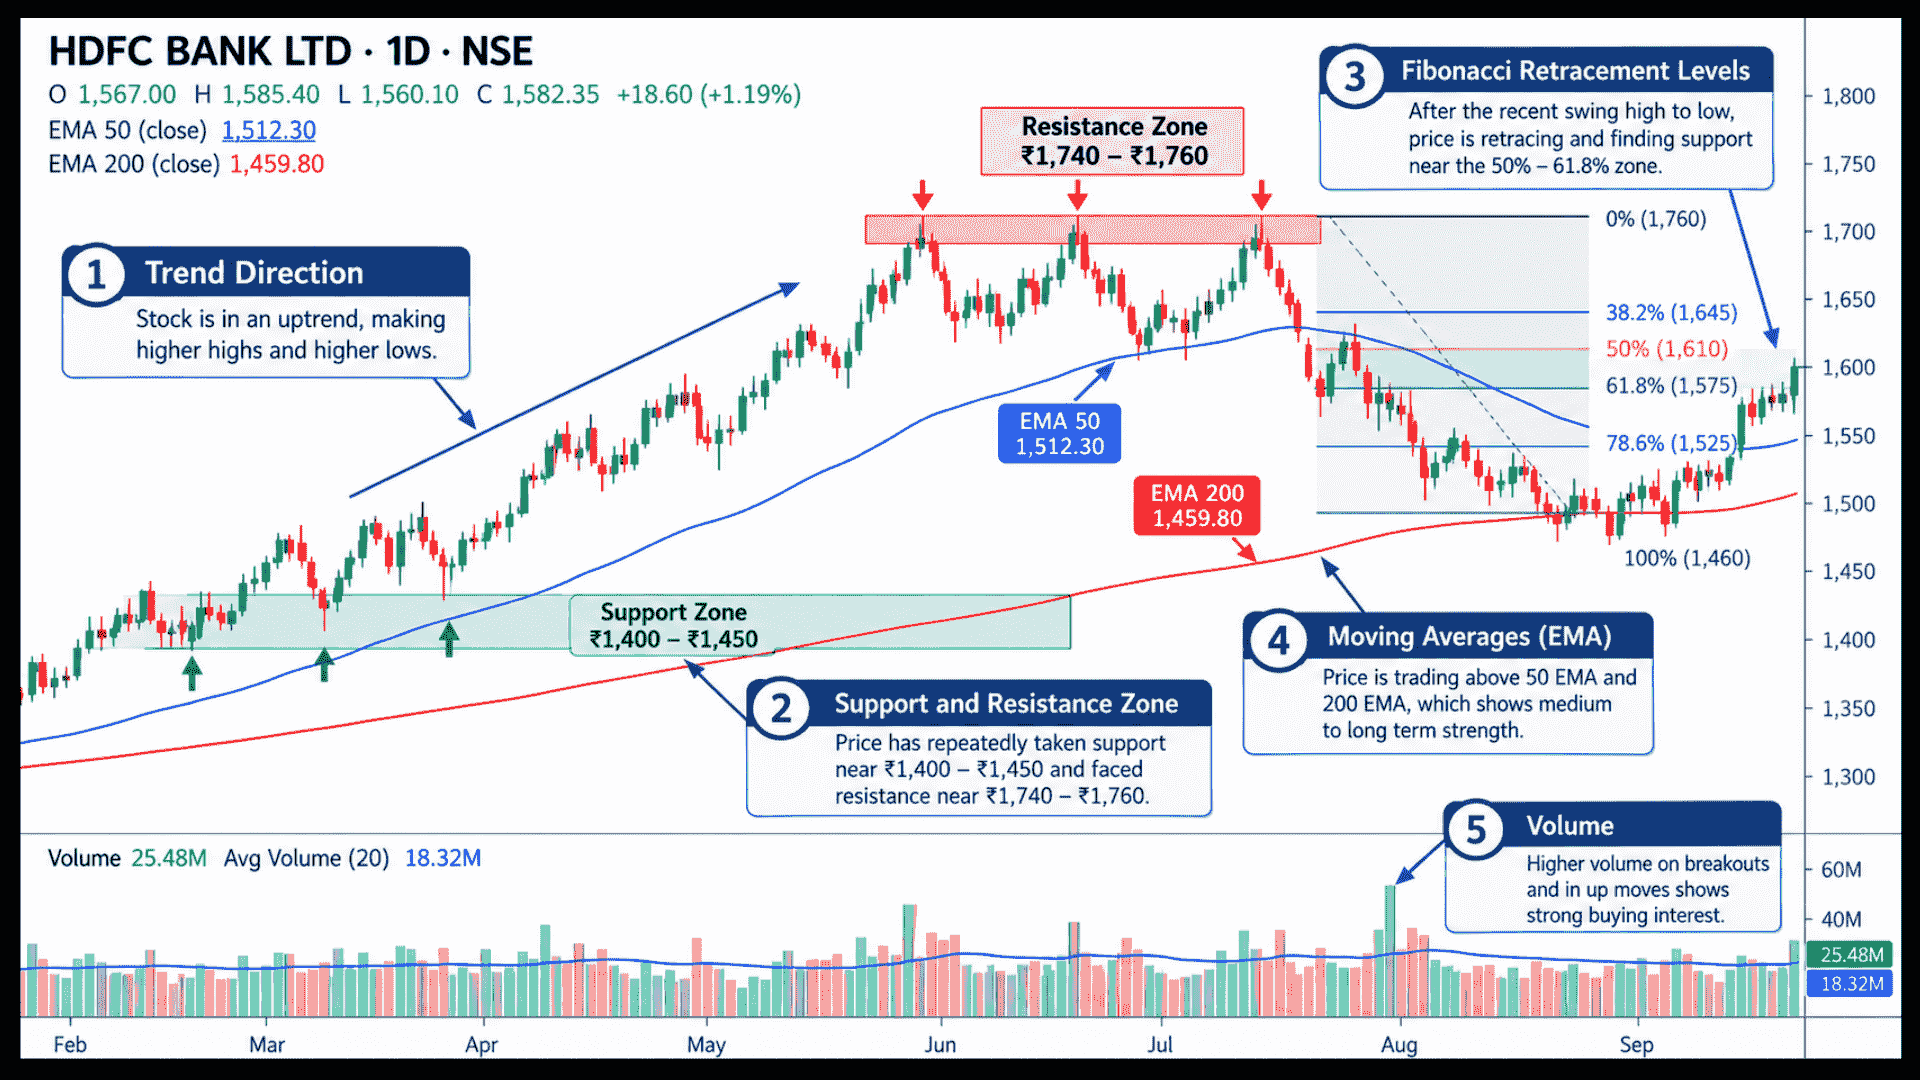
A simple, repeatable framework keeps every decision consistent: trend first, then levels, then confirmation, then entry, then exit.
The five steps below follow that exact order, so each one builds on the one before it.
Step 1: Is the Trend Your Friend or Your Trap?
Every technical setup you use downstream of this step depends on getting the trend right first.
Trading a bullish pullback setup in a stock that is actually in a downtrend is the single most common way beginners lose money.
The simplest read: is price making higher highs and higher lows (uptrend), lower highs and lower lows (downtrend), or bouncing sideways with no clear direction (range-bound)?
A rising 50-day moving average with price consistently above it is a reasonable proxy for an uptrend if you want a quick visual check rather than manually marking swing points.
Step 2: Where Will Price Bounce, and Where Will It Break?
Support and resistance zones are where price has previously reversed, and they tend to matter again the next time price approaches them.
For swing trading specifically, these zones give you two things: a logical place to enter (buying near support in an uptrend).
And a logical place to set your stop loss (just below that same support, since a break below it invalidates the setup).
Step 3: Is Volume Backing the Move or Faking It?
Price movement without volume behind it is often unreliable, especially on breakouts.
A stock breaking above resistance on unusually high volume is showing real conviction behind the move.
The same breakout on thin, average volume is far more likely to fail and reverse.
Step 4: Which Momentum Indicators Actually Deserve Chart Space?
This is where most of the actual setup decisions happen, and where it matters most not to overload your chart with every indicator at once.
Two or three, used consistently, will serve you better than eight indicators fighting each other for attention.
Moving Averages (EMA)
The 20 and 50 EMA combination is a standard way to both confirm trend and time pullback entries.
We cover the full mechanics of this setup, including a worked example, in our post on swing trading EMA strategy.
MACD
A momentum indicator built from moving averages, useful for spotting when momentum is shifting direction through its crossover signal.
Our dedicated post on swing trading strategy using MACD breaks down the exact entry and exit rules.
RSI
Measures the speed of recent price moves and helps time entries within an established trend, rather than just flagging generic overbought or oversold levels.
See our post on swing trading strategy using RSI for the full pullback setup.
Bollinger Bands
Adjusts automatically to volatility, useful for both range-bound bounce setups and squeeze breakout setups.
Covered in depth in swing trading with Bollinger Bands.
Fibonacci Retracement
Marks likely pullback zones and, just as usefully, gives you measured price targets.
Full mechanics and a worked example are in swing trading with Fibonacci retracement.
Step 5: Can Chart Patterns Predict the Next Swing?
Beyond indicators, price itself tends to form recognisable shapes that repeat across different stocks and time periods.
That happens because they reflect recurring crowd behaviour rather than any single stock’s quirks.
Mastering reliable swing trading patterns helps you anticipate these cyclical market shifts before they fully materialize on your charts.
The cup and handle is one of the more reliable continuation patterns for swing trading, giving you a built-in way to measure your profit target from the pattern’s own shape.
Our post on cup and handle swing trading strategy covers exactly how to spot and trade it, including the specific measurements that separate a real setup from a weak one.
Simple pullback and breakout patterns, and candlestick reversal signals like a bullish engulfing candle or a hammer forming right at support, are also worth learning.
They show up constantly across nearly every setup described above.
The 20-Minute Daily Routine That Replaces Screen-Staring?
Most beginners assume technical analysis for swing trading means constant screen-watching. In practice, a realistic routine looks more like this:
- Once a day, after market close: Scan your watchlist for stocks approaching a setup, whether that is an EMA pullback, an RSI dip within a trend, or a pattern like cup and handle nearing breakout.
- Confirm the trend first, always, before looking at any indicator signal.
- Check volume on any breakout or breakdown before acting on it.
- Plan your stop loss and target before entering, not after.
- Adhering to strict swing trading rules during this planning phase helps protect your capital from sudden market volatility.
- Review open positions briefly each evening for any exit signal, rather than checking constantly through the trading day.
This entire process, done consistently, takes maybe fifteen to twenty minutes a day once you are familiar with your usual watchlist.
What Changes When the Market Turns Bearish?
Everything above assumes a generally rising or range-bound market.
When the broader market turns down, the same technical tools still apply, but the setups, the instruments you trade them through, and your position sizing all need to shift.
We cover that adjustment fully in our guide on swing trading strategy in bear market conditions, including an important India-specific rule about how short positions actually have to be taken here.
The Biggest Mistake: Waiting for Every Indicator to Agree
It is tempting, once you know EMA, MACD, RSI, Bollinger Bands, and Fibonacci retracement, to want all five to align before ever taking a trade.
In reality, that level of confirmation rarely happens, and waiting for it usually means missing genuinely good setups while waiting for a “perfect” one that never quite arrives.
Pick one primary trend tool, one momentum tool, and use chart patterns and support and resistance as your visual confirmation.
That combination, applied consistently, will serve you better than trying to force every indicator into agreement on every trade.
How Do All Five Steps Come Together in One Real Trade?
Reading about five separate tools can make swing trading sound more complicated than it actually is in practice.
Here is how they typically stack together on one real setup, start to finish.
Suppose you are scanning your watchlist and notice Kotak Mahindra Bank is in a clear uptrend (Step 1: trend).
It is trading above a rising 50-day moving average with a recent higher low forming near a support zone that has held twice before (Step 2: support and resistance).
The stock pulls back toward that zone on noticeably lighter volume than the prior rally (Step 3: volume).
RSI dips into the 42 to 45 range rather than staying pinned above 60 (Step 4: momentum indicator).
And price forms a bullish engulfing candle right at the support level (Step 5: pattern).
That is five separate technical observations pointing toward the same conclusion. None of them individually would be enough to justify a trade.
Together, they form a genuinely well-supported setup, and this is really what “swing trading with technical analysis” means in practice.
It is not memorising indicator formulas, but reading several pieces of the same picture and acting only when they agree.
Anyone learning what is swing trading will find that combining these multiple technical factors transforms abstract chart patterns into practical execution.
Build a Watchlist You Actually Know Inside Out
A practical starting watchlist for this kind of layered analysis is fifteen to twenty-five liquid, large or mid-cap stocks you check consistently.
That beats scanning the entire market for setups every single day.
Familiarity with a smaller set of stocks, their typical volatility and how they tend to behave around support and resistance, tends to produce better pattern recognition over time.
Jumping between unfamiliar names constantly rarely builds that same edge.
Revisit this list every few weeks rather than daily, swapping out stocks that have become illiquid or lost their trend.
Add ones that have developed a clear, tradeable structure.
Backtest First, Risk Real Money Later
Before applying any of the setups linked throughout this guide with live money, spend time backtesting them on historical charts.
Mastering effective swing trading risk management techniques during your practice phase is just as important as identifying high-probability chart patterns.
Pick a handful of stocks, scroll back several months, and manually identify where each setup (EMA pullback, RSI dip, Bollinger squeeze, and so on) would have triggered, then track what actually happened afterward.
If you have been wondering technical analysis kaise sikhe, this is honestly the most practical answer: practise on past charts before live ones.
This single exercise, done honestly rather than cherry-picking only the winning examples, tends to build more real confidence in a setup than reading about it ever will.
It usually reveals which specific setups suit your own temperament and available screen time best.
Why Do Tips and WhatsApp Calls Leave You Stranded?
A genuinely common alternative to learning technical analysis is simply following stock tips from social media, WhatsApp groups, or television calls.
The problem is not that every tip is wrong.
The problem is that you have no framework of your own to judge when to exit, when the setup has failed, or how much to risk, since none of that context typically comes with the tip itself.
Many traders first come across these ideas through videos and resources on technical analysis in Hindi, which is a good start as long as it builds into your own framework.
Building your own technical analysis skillset, even a simple version using the tools covered in this guide, means every trade comes with its own built-in entry, stop loss, and exit plan.
That holds regardless of where the original idea for the trade came from.
Ready to Learn This Live, on Real Charts?
Reading about technical analysis and applying it under real market pressure, with real money on the line, are genuinely different skills.
Our swing trading classes walk through this entire approach live, every trading day, on real Indian stocks, so you build the pattern recognition that only comes from consistent, guided practice.
Think of it as a practical technical analysis course built specifically around swing setups.
Conclusion: Your Chart Is Talking, Are You Listening?
Swing trading with technical analysis is not about memorising formulas or stacking every indicator on one chart. It is about reading trend first, marking support and resistance, confirming with volume, and letting one or two momentum tools plus chart patterns sharpen your timing.
Keep your watchlist small, backtest honestly, and plan every stop loss and target before you enter. Whether you learn technical analysis on your own or through guided swing trading classes online, consistent practice on real charts is what turns five separate tools into one confident, repeatable trading decision.
Frequently asked questions
Before investing capital, invest your time in learning Stock Market.
Fill in the basic details below and a callback will be arranged for more information: