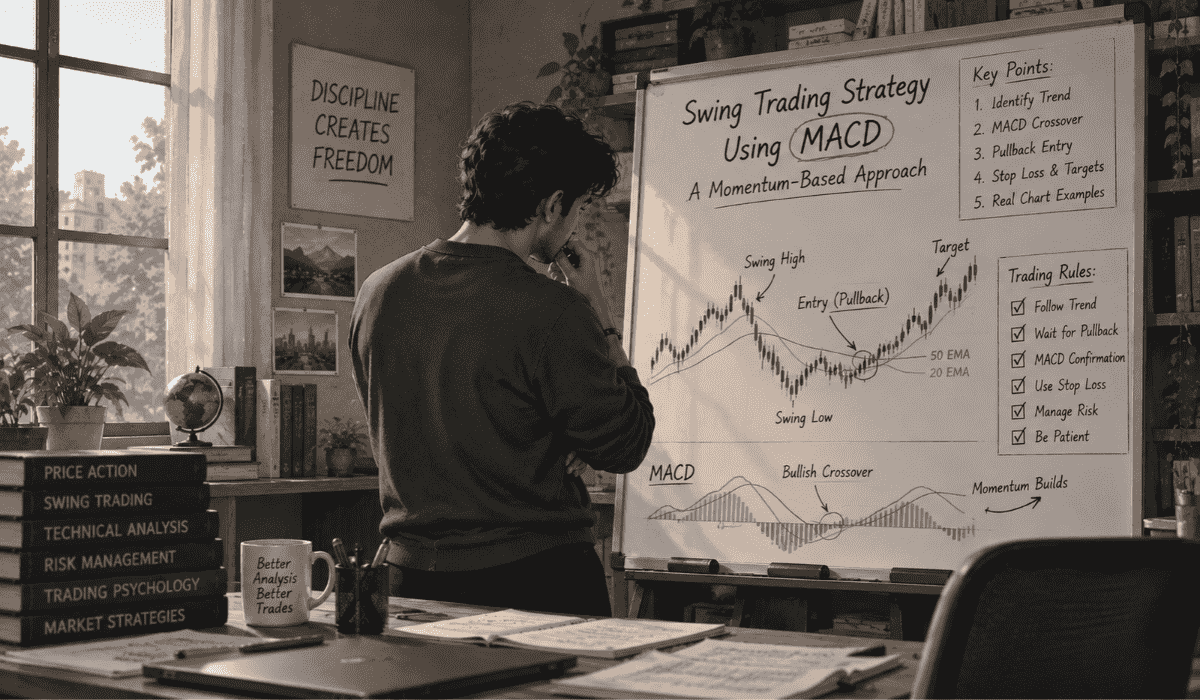



There are dozens of named patterns in technical analysis, but most traders rely on only a small handful of swing trading patterns in real trades.
This guide covers both candlestick and chart patterns that show up often enough in real trades to be worth learning properly.
If you’re newer and still asking meaning of swing trading, build that foundation first, rather than trying to memorise every pattern that exists.
Candlestick vs Chart Swing Trading Patterns: Why Does the Difference Matter?
It helps to separate patterns into two groups before going further, since they serve different purposes.
Candlestick patterns form over one to three candles and signal a possible short-term reversal or continuation right at a specific point on the chart.
They often appear at support or resistance.
Chart patterns form over many candles, sometimes weeks, and reflect a larger structure in price.
They are typically used to time an entry and, often, to measure a realistic profit target from the pattern’s own shape.
Candlestick Patterns for Swing Trading: 4 Signals Worth Your Screen Time
Bullish Engulfing: When Buyers Swallow the Sellers
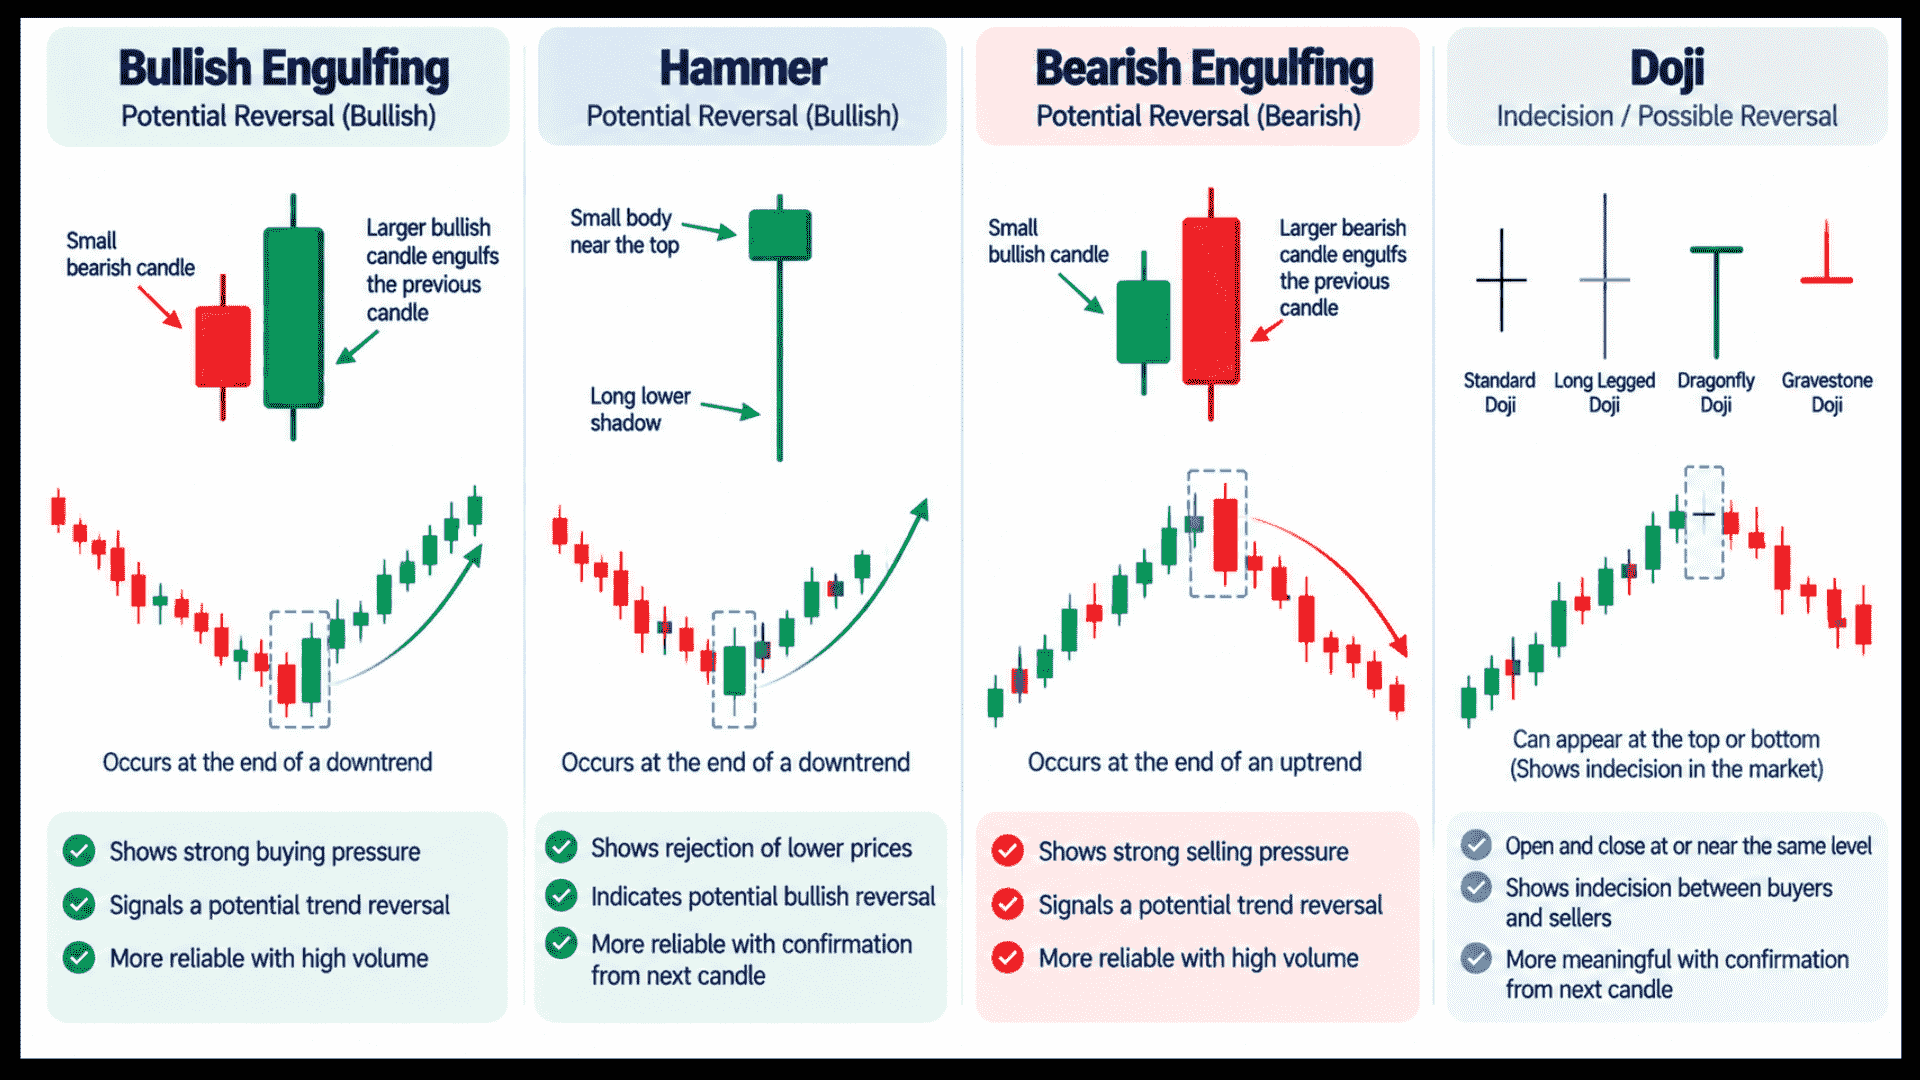
A small bearish candle followed by a larger bullish candle that fully “engulfs” the previous candle’s body.
When this forms at a support level or during a pullback within an uptrend, it is one of the more reliable single-candle reversal signals swing traders watch for.
Hammer: Did Buyers Just Slam the Door on Sellers?
A candle with a small body near the top of its range and a long lower wick.
It shows sellers pushed price down during the session, but buyers stepped in strongly enough to close it back near the open.
A hammer at support, especially with above-average volume, is a common trigger for pullback entries.
Bearish Engulfing: The Warning Sign at the Top
The mirror image of bullish engulfing, useful for spotting potential reversals at resistance or the top of a rally.
It works whether you are exiting a long position or planning a bearish entry.
Doji: Is the Market Holding Its Breath?
A candle where the open and close are nearly identical, showing genuine indecision in the market.
A doji on its own is not usually a strong enough signal to act on.
But a doji appearing right after a strong move, at a level you were already watching, is often worth paying attention to.
Chart Patterns for Swing Trading: The Bigger-Picture Setups
Chart patterns reveal the larger structure behind a price move. They form over days or weeks and help you spot whether a trend is likely to continue or reverse. They also give you clear levels for entry, stop loss and target.
These four patterns are the ones swing traders rely on most.
Cup and Handle: The Pattern That Hands You a Target
A rounded consolidation is followed by a smaller pullback and then a breakout, making this one of the more reliable continuation patterns.
It also gives you a measured way to calculate a profit target from the pattern’s own depth.
We cover the exact entry, stop-loss, and target rules in our dedicated post on the cup and handle swing trading strategy.
Double Top and Double Bottom: Tested Twice, Decided Once
Two roughly equal highs (double top) or two roughly equal lows (double bottom) form with a pullback or bounce between them.
A double top signals a potential reversal after an uptrend has struggled to break higher twice.
A double bottom signals the opposite, often marking the end of a decline.
Flag Pattern: Why Does a Short Pause Often Mean More?
A sharp price move is followed by a tight, short consolidation that drifts slightly against the move, resembling a flag on a pole.
Flags tend to resolve in the direction of the original move, which makes the flag a pause worth watching for a continuation entry once it breaks.
Head and Shoulders: The Classic Signal That an Uptrend Is Ending
Three peaks form, with the middle peak (the “head”) higher than the two surrounding peaks (the “shoulders”).
This pattern typically signals a trend reversal from up to down. When it appears on the index or several leading stocks at once, it is often an early warning that broader conditions are turning.
That is the point to shift your approach, and a separate swing trading strategy in bear market conditions covers how to adjust entries, position sizing and trade direction.
Its inverse, the inverse head and shoulders, signals the opposite: a reversal from down to up.
How Do You Combine Swing Trading Patterns for Stronger Setups?
Patterns work best as one part of a larger picture, not as a standalone signal.
A hammer candle at support carries more weight when it lines up with an oversold RSI reading.
It becomes even stronger when it appears at the end of a pullback within an established uptrend.
To see how patterns, indicators and trend context fit together, our guide on swing trading with technical analysis covers the full framework.
Why Do Good-Looking Swing Trading Patterns Fail?
The most common mistake is trading a pattern in isolation, ignoring the broader trend it is forming within.
A bullish engulfing candle at support in a strong uptrend is a genuinely different signal from the same candle in a sustained downtrend. In a downtrend, that same shape is far more likely to fail.
Reading that context correctly takes practice, and some traders now use swing trading with AI tools to assess trend conditions and filter out low-probability setups.
The second mistake is entering before the pattern actually confirms.
A candle that looks like it might be forming a hammer before the session has closed is not yet a hammer. Wait for the close.
It’s one of the simplest swing trading rules, and one of the most often ignored.
Note: The same AI page is already linked in the Level 3 watchlist section. If both sections are in the same article, you could keep this one and replace the second link with a different relevant page, but I’ve left it in since you may want both.
Continuation vs Reversal Swing Trading Patterns: Ride the Trend or Fade It?
Before going further, it helps to sort patterns into two functional groups, since this changes how you should react to each one.
Continuation patterns, like flags and cup and handle, suggest the existing trend is likely to resume after a brief pause.
These are generally traded in the direction of the trend that was already in place before the pattern formed.
Reversal patterns, like double tops, double bottoms, and head and shoulders, suggest the existing trend is losing steam and may be turning.
These are traded against the prior trend, which naturally makes them feel riskier to act on, since you are betting against working momentum.
This is exactly where knowing how to manage risk in trading protects you when a reversal setup fails.
Volume: The Lie Detector Behind Swing Trading Patterns
A pattern breaking out or confirming without a meaningful increase in volume is a genuine warning sign, regardless of the pattern.
Volume represents actual conviction behind a move.
A textbook-perfect chart pattern with weak breakout volume fails to confirm noticeably more often than one with a clear volume spike.
This applies equally to candlestick patterns.
A hammer on unusually low volume carries less weight than the same shape with volume well above the recent average.
The latter suggests real buying interest stepped in, not just a quiet, low-conviction session.
Pairing volume with volatility tools, as explained in swing trading with bollinger bands, can sharpen this read further.
Want to Learn Swing Trading Patterns Faster? Try This
Rather than memorising the visual shape of every pattern from a textbook image, scroll back through several months of historical charts.
Pick stocks you already know well and manually mark every instance of the pattern you are trying to learn.
This builds genuine pattern recognition, since real charts rarely look as clean as textbook diagrams.
Seeing the messier, real-world versions of a hammer or a flag trains your eye far better than studying idealised examples alone.
Ready to Practise Spotting These on Live Charts?
Patterns are easy to recognise on a textbook chart after the fact.
Spotting a genuine one forming live, and confirming it correctly before acting, takes real screen time.
Our Swing Trading Classes cover pattern-based setups like these live, on real Indian stocks, every trading day.
Conclusion: Master a Few Patterns, Not All of Them
Swing trading patterns are tools, not guarantees. A small set of candlestick patterns, like engulfing candles, hammers and dojis, paired with chart patterns such as flags, double bottoms, and head and shoulders, covers most real-world setups.
What separates profitable traders is context: reading the trend, waiting for confirmation, and checking volume before acting.
Learn a few patterns deeply, study them on real historical charts, and combine them with indicators and sound risk control. Consistency with a handful of reliable setups will serve you far better than memorising every pattern in the textbook.
Frequently Asked Question
Before investing capital, invest your time in learning Stock Market.
Fill in the basic details below and a callback will be arranged for more information: