



You see a company reporting a bigger profit every year. Then you notice its bank balance is not growing.
So, is free cash flow same as profit? No. They measure two different things, and the gap between them tells a useful story.
Is Free Cash Flow Same as Profit?
Net profit is an accounting number. It follows accounting rules, which record income and costs when they are earned, not when cash moves.
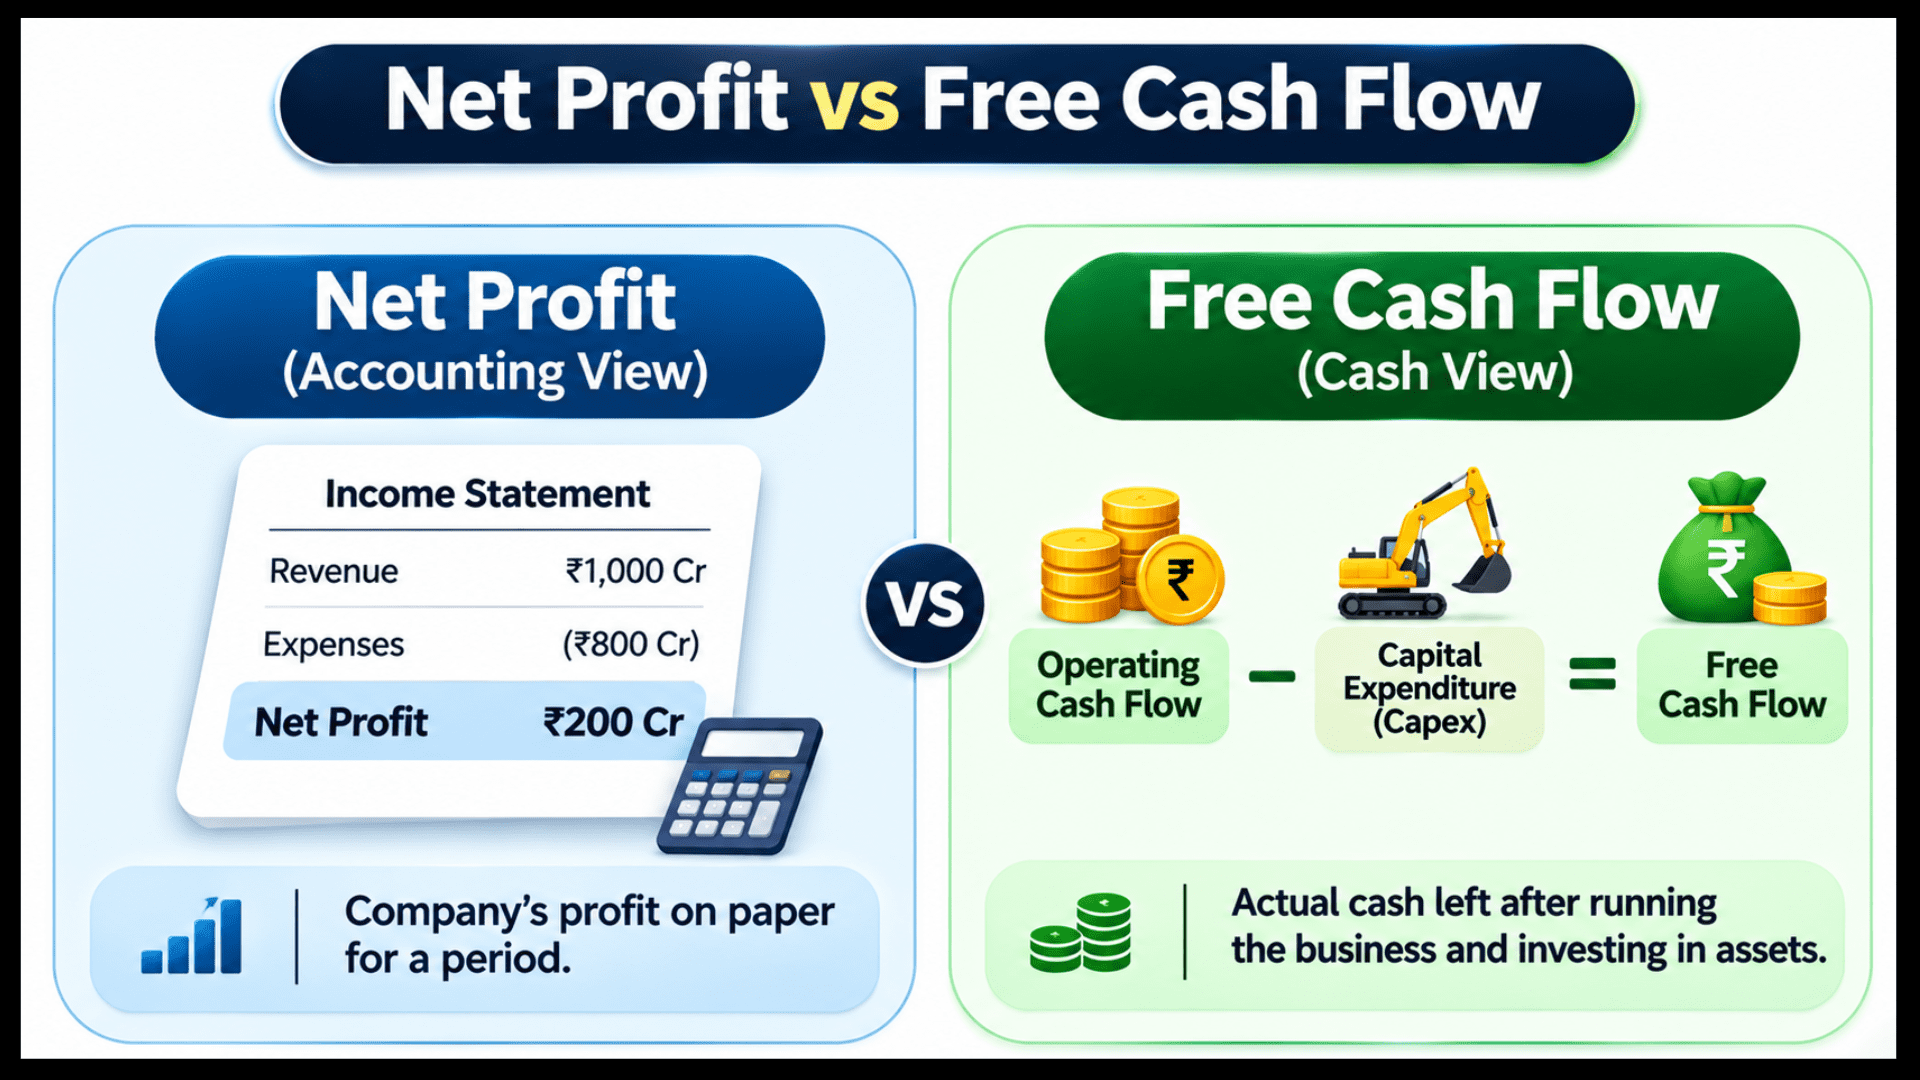
In contrast, free cash flow (FCF) is cash-based. It is operating cash flow minus capital expenditure (capex).
How Free Cash Flow Differs From Net Profit
The table below puts the two side by side. However, it is a general picture, and exact treatment can vary by company.
| Point | Net profit | Free cash flow |
|---|---|---|
| Based on | Accounting rules | Actual cash movement |
| Includes non-cash items like depreciation | Yes, as a cost | No, added back in operating cash flow |
| Affected by credit sales and stock build-up | Credit sales count as income | Cash is counted only when received |
| Considers money spent on new assets | Only slowly, through depreciation | Yes, capex is deducted fully |
| Where to find it | Profit and loss statement | Cash flow statement (operating cash flow, capex) |
If you need FCF explained from scratch, read our page on free cash flow meaning first.
Why Business Profit Doesn’t Equal Cash
Here are the usual reasons the two numbers differ. Besides, each one is a normal business event, not a trick.
- Depreciation. It reduces profit, but no cash leaves the company that year. It is added back when working out operating cash flow.
- Working capital. If customers pay late, sales are in profit but not in cash. Likewise, if stock piles up, cash is stuck in the warehouse.
- Capex. Buying a machine or building a plant is not a profit-and-loss expense at once. It spreads over years as depreciation, but the cash leaves on day one.
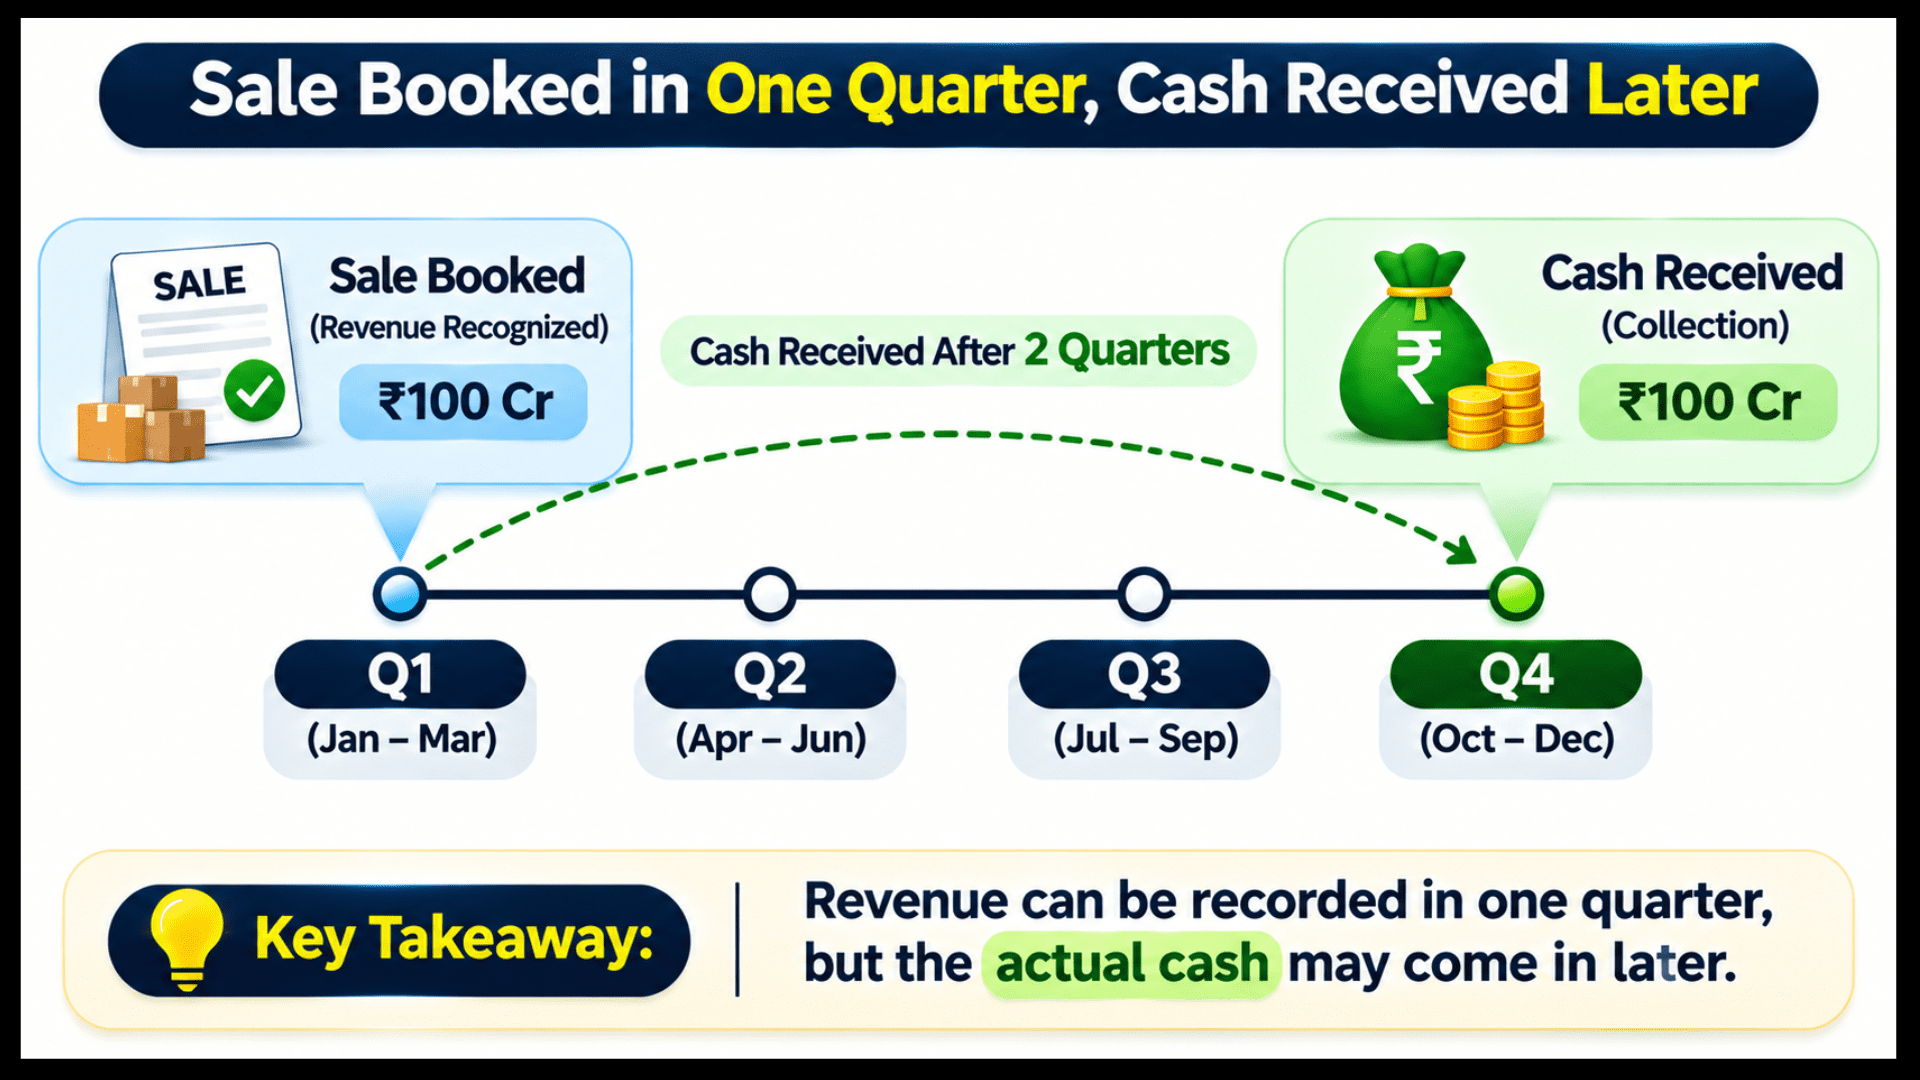
- Timing. A big order booked in March may bring cash only in June. As a result, a quarter’s profit and cash can look very different.
Profit Positive but FCF Negative
Let us take a hypothetical Company A. All figures are in rupees crore and are for illustration only.
Also, operating cash flow here is simplified as net profit + depreciation + change in working capital. Real statements have more items.
First, Company A reports a net profit of 120. Depreciation is 30. Meanwhile, cash tied up in receivables and stock rose by 80, so the working capital change is -80.
So, operating cash flow = 120 + 30 – 80 = 70. Capex is 110, so FCF = 70 – 110 = -40.
The company looks profitable on paper, but it spent more cash than it generated. That is not automatically bad, and it depends on why.
Our page on what negative free cash flow means covers the causes in depth.
Low Profit but Positive FCF
Now take Company B, also hypothetical. Its profit is small, but its cash picture is different.
Net profit is 40. In addition, depreciation is a large 60 because it owns older, heavy assets. Besides, working capital released 10 in cash, so the change is +10.
Operating cash flow = 40 + 60 + 10 = 110. Capex is just 45, so FCF = 110 – 45 = 65.
The table below compares both companies using the same formula. Numbers are for illustration only.
| Item (Rs crore) | Company A | Company B |
|---|---|---|
| Net profit | 120 | 40 |
| Depreciation (added back) | 30 | 60 |
| Working capital change | -80 | +10 |
| Operating cash flow | 70 | 110 |
| Capex | 110 | 45 |
| Free cash flow | -40 | 65 |
Formula used: FCF = operating cash flow – capex. Company B has one third of A’s profit but far more spare cash.
However, this does not mean B is the better business. B may have low growth or ageing assets that need heavy spending soon.
Thus, it only shows that profit alone hides the cash story.
Notice that Company B’s operating cash flow is 110, yet its FCF is only 65.
That gap is capex, and Free Cash Flow vs Operating Cash Flow explains it in detail.
Red Flags When Profit Grows but Cash Does Not
Sometimes profit rises every year while cash stays flat. Therefore, that gap deserves a closer look.
Here is a hypothetical Company C over three years. Figures are in rupees crore, for illustration only.
| Year | Net profit | Working capital change | Operating cash flow | Capex | FCF | Operating cash flow as % of profit |
|---|---|---|---|---|---|---|
| Year 1 | 100 | -5 | 120 | 40 | 80 | 120% |
| Year 2 | 130 | -40 | 116 | 42 | 74 | 89% |
| Year 3 | 165 | -85 | 107 | 45 | 62 | 65% |
Profit grew from 100 to 165, but operating cash flow slipped from 120 to 107. Here, depreciation is 25, 26 and 27 in the three years.
Operating cash flow = profit + depreciation + working capital change.
In fact, the reason in this example is rising receivables and stock. Sales are being booked, yet cash is not arriving at the same pace.
Common warning signs to look for in real reports, in general terms:
- Profit rising for several years while operating cash flow stays flat or falls.
- Receivables growing faster than sales.
- Stock piling up compared with sales.
- FCF staying negative for years with no clear growth reason.
A flag is a reason to ask questions, not proof of a problem. In fact, many learners study how results are reported before judging them.
The page on the impact of quarterly results on share price shows why headline profit alone can mislead.
How to Analyze the Gap Between Profit and Cash
Reading a company report can feel heavy at first, so take it one statement at a time. A simple routine makes the gap between profit and cash easy to spot.
- Note net profit from the profit and loss statement for the last 3 to 5 years.
- Note operating cash flow and capex from the cash flow statement for the same years.
- Work out FCF = operating cash flow – capex for each year.
- Check operating cash flow as a share of net profit. A long-running gap deserves questions.
- Next, look at working capital: receivables, stock and payables.
- Compare with peers in the same type of business, since capex needs differ by industry.
Asset-light businesses and capex-heavy businesses will show very different patterns. Similarly, debt-funded companies also feel rate changes, so the impact of interest rate on the stock market is worth knowing.
If you also want to see how OCF and FCF differ, read free cash flow vs operating cash flow.
What Free Cash Flow Cannot Tell You?
FCF is useful, but it has limits. For instance, definitions vary, as some analysts adjust for interest or lease payments.
Also, one year can mislead. A company may delay capex and show high FCF, or spend heavily for growth and show low FCF.
Therefore, always read several years together. FCF is not a buy or sell signal, and it works best next to profit, debt and returns.
Likewise, profit-based ratios are part of the toolkit. A method like DuPont analysis shows what drives returns on top of the cash picture.
Finally, a mentor review of your own company notes can catch blind spots that you miss alone.
Looking at Financials: Should You Start With Profit or Free Cash Flow?
First, think of profit as the story the books tell, and FCF as the check on that story. Neither replaces the other.
For example, beginners can start with profit to see the business size, then use cash flow to test it. Our learn fundamental analysis roadmap shows where each statement fits.
However, one weak year is not a verdict. Look at the trend and the reason behind each number.
Why Does FCF Matter for Long-Term Investors?
Long-term investors often care about how much cash a business can really spare. That thinking sits close to the value investing vs growth investing debate.
Value investors often look for high free cash flow yields to find undervalued companies paying steady dividends or buying back shares.
Reading about FCF is easy, but real company statements and a mentor’s answers teach you to spot the gap.
Join our live classes from your mobile, ask your doubts and learn step by step.
Conclusion
So, free cash flow is not the same as profit. Profit follows accounting rules, while FCF follows the cash.
In short, depreciation, working capital, capex and timing explain why the two numbers differ. As a result, a company can look profitable and still run short of cash.
Our examples showed both sides. Company A had profit but negative FCF, while Company B had low profit but positive FCF.
Also, Company C showed why rising profit with flat cash deserves a closer look. However, a red flag is a reason to ask questions, not proof of a problem.
Therefore, read both numbers over three to five years, and check the reason behind every gap. Finally, use FCF next to profit, debt and returns, because no single number tells the full story.
Remember, this is learning, not a buy or sell signal. Practise on real statements, and your confidence will grow with every report you read.
Disclaimer: This page is for education only and is not investment advice. All numbers are hypothetical and for illustration only.
Definitions of FCF vary, and past figures do not guarantee future results. So, please do your own research or speak to a registered adviser before investing.
Frequently Asked Questions
Before investing capital, invest your time in learning Stock Market.
Fill in the basic details below and a callback will be arranged for more information: