



Free cash flow vs operating cash flow sounds tricky, but the gap between the two is just one item: capex.
First, both numbers come from the same cash flow statement. One shows the cash the business earns from operations. The other shows what is left after it spends on assets.
Have you ever seen healthy operating cash flow and still wondered why a company’s cash keeps shrinking? If so, this page is for you.
The Difference Between Free Cash Flow and Operating Cash Flow in One Line
Operating cash flow (OCF), also called cash from operations, is the cash a business generates from its day-to-day work. It is the starting point.
In addition, free cash flow (FCF) is operating cash flow minus capital expenditure (capex). Capex is the cash spent on buying or upgrading fixed assets such as machines, buildings and equipment.
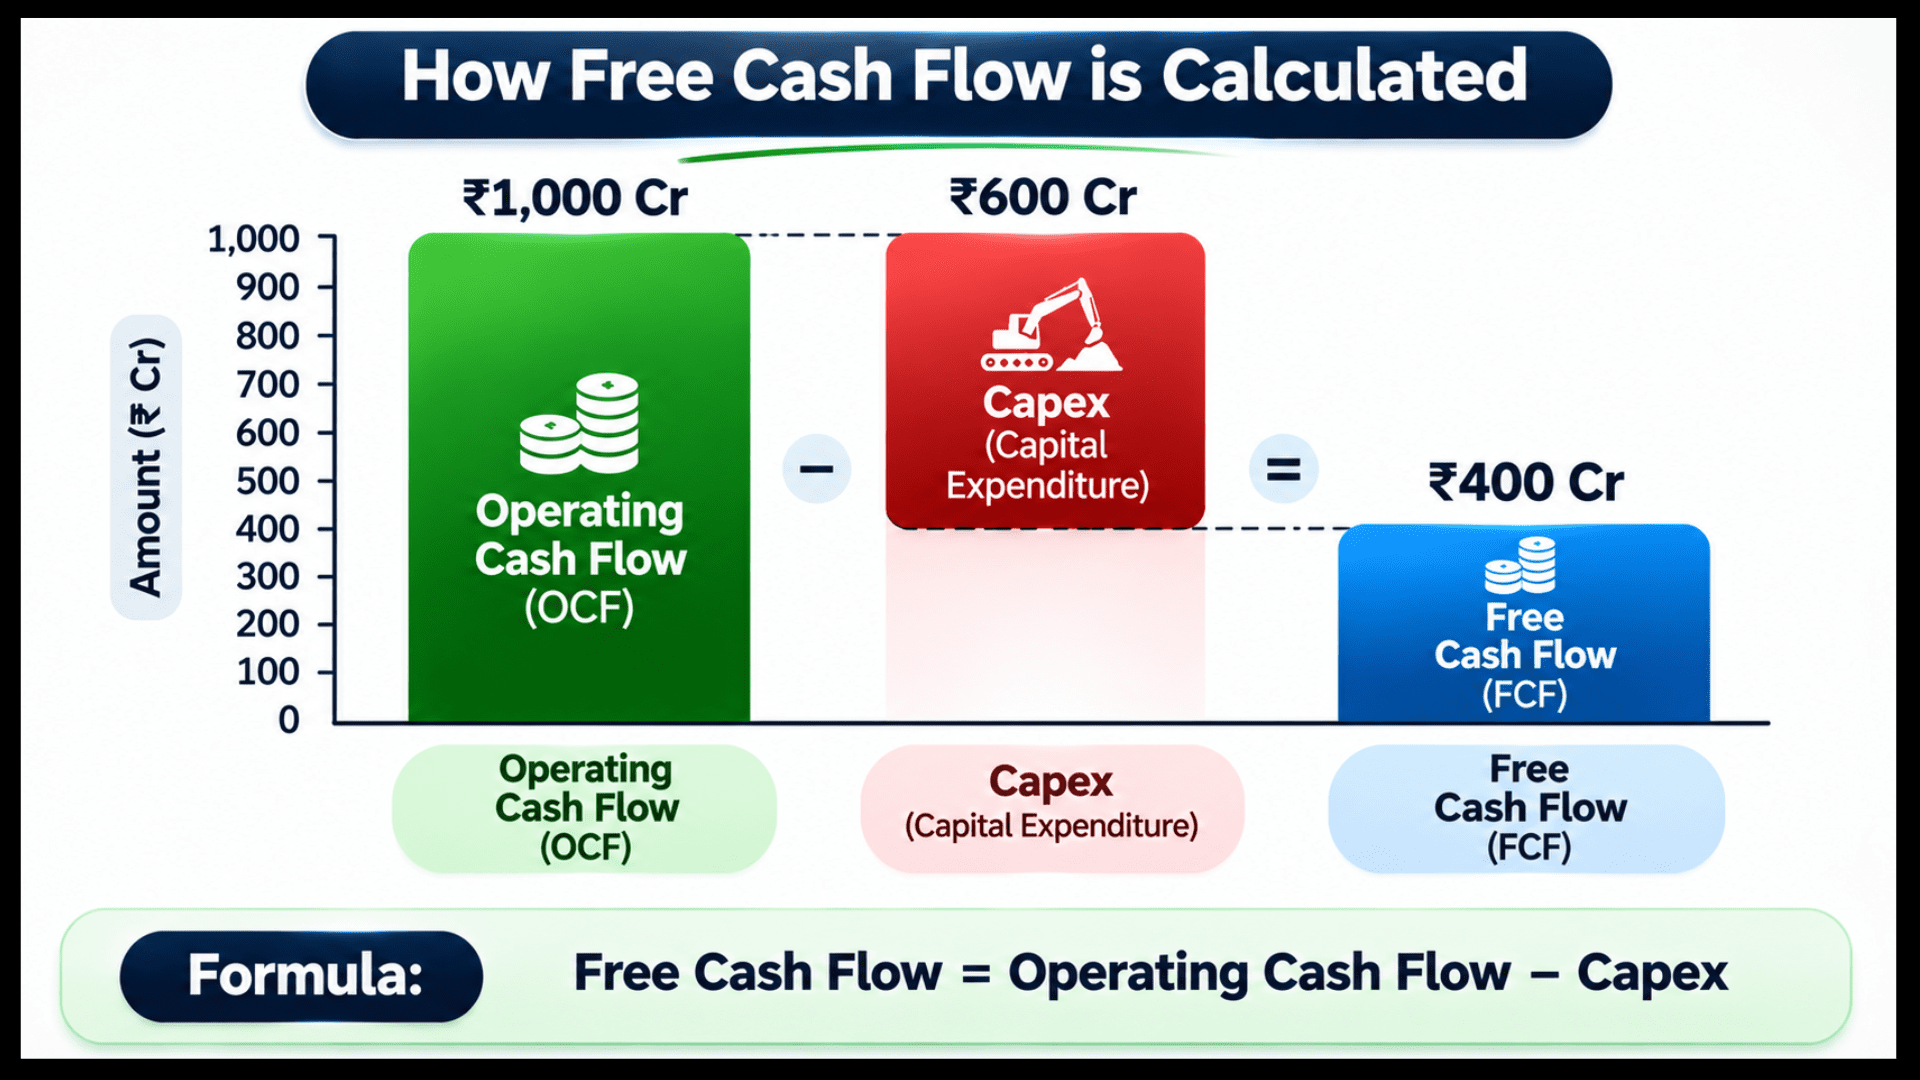
So, the whole difference between OCF and FCF is the cash that goes into assets. If you want the full definition, step-by-step calculation and uses, our Free Cash Flow Meaning page covers it from scratch.
Formula, for illustration: FCF = OCF – capex.
Comparing Operating Cash Flow And Free Cash Flow
Here is a quick comparison of cash from operations vs free cash flow. Therefore, you can see where they differ in practice.
| Point | Operating cash flow (OCF) | Free cash flow (FCF) |
|---|---|---|
| What it measures | Cash generated by core operations | Cash left after capex |
| Where it comes from | Cash flow statement, operating section | OCF minus capex from the investing section |
| Includes capex? | No | Yes, capex is deducted |
| Can it be negative? | Yes, if operations burn cash | Yes, also when capex is heavy |
| Best used to check | Whether the business earns cash from its work | Whether cash remains after maintaining and growing assets |
| Main blind spot | Ignores the cost of keeping assets running | Can swing a lot from one big capex year |
A company can look strong on the left column and weak on the right. That is exactly why traders and investors look at both.
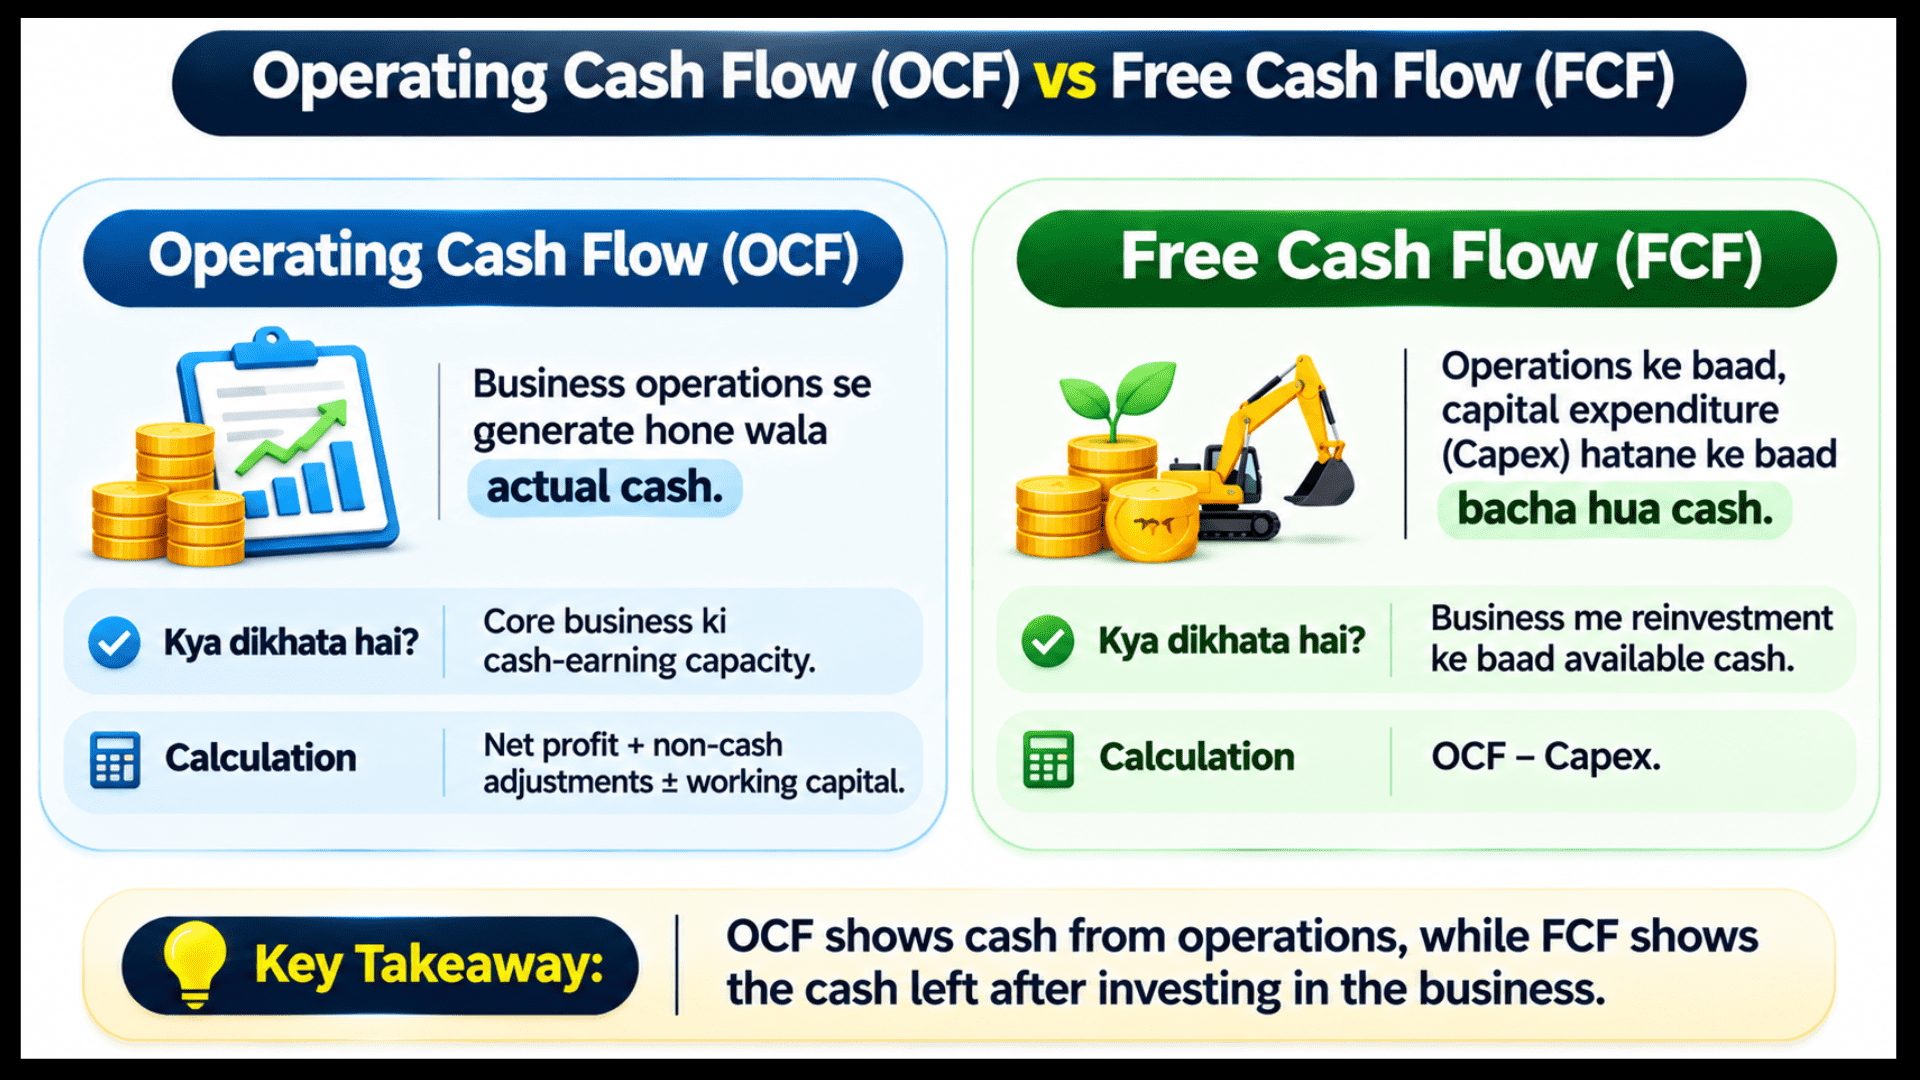
Likewise, beginners who want to learn value investing often start with exactly this comparison.
Why OCF Can Be Positive and FCF Negative?
Let us see the difference with a made-up example. Company A is a hypothetical business, and the numbers are for illustration only.
Figures are in ₹ crore. FCF is calculated as OCF minus capex each year.
| Year | OCF | Capex | FCF (OCF – capex) |
|---|---|---|---|
| Year 1 | 120 | 40 | 80 |
| Year 2 | 130 | 150 | -20 |
| Year 3 | 140 | 60 | 80 |
Notice that OCF rose steadily every year. Yet, in Year 2, FCF turned negative because the company spent 150 on a big expansion.
That one-year dip does not tell you the business is failing. Instead, it tells you the company chose to spend more than it earned from operations that year.
We explain when a negative number is a warning in our guide on what negative free cash flow means.
In Year 1, FCF was 80 out of OCF of 120. Similarly, in Year 3, it was 80 out of 140.
So, the share of operating cash that remained after capex changed a lot from year to year.
How Capex-Heavy and Asset-Light Businesses Impact Free Cash Flow vs. Operating Cash Flow
How big the gap is between OCF and FCF depends a lot on the type of business. Some businesses need constant spending on assets, while others need very little.
In general, businesses like manufacturing, power, telecom and infrastructure tend to be capex-heavy. They keep buying plants, towers or equipment.
In contrast, businesses built on software, services or brands tend to be asset-light. They need fewer physical assets, so more OCF can reach FCF.
Here are two hypothetical companies with the same OCF but very different capex. Figures are in ₹ crore, for illustration only.
| Company | OCF | Capex | FCF | FCF as % of OCF |
|---|---|---|---|---|
| Company B (asset-light) | 100 | 10 | 90 | 90% |
| Company C (capex-heavy) | 100 | 85 | 15 | 15% |
However, on OCF alone, B and C look identical. After capex, B keeps 90 for debt repayment, dividends or buybacks, while C keeps only 15.
This does not make C a bad business. In fact, its capex might be building capacity for future growth.
It only means its OCF is doing a different job. Many long-term investors who follow value investing study this gap closely. After all, it shows how much cash a business really keeps.
Free Cash Flow And Operating Cash Flow: Which Metric Matters First?
Neither number is better in every case. Instead, they answer different questions.
When to Look at Operating Cash Flow
Look at operating cash flow when you want to know if the core business actually brings in cash.
A company with weak or falling OCF has a problem at the operations level.
When to Look at Free Cash Flow
Next, look at free cash flow when you want to know the cash truly available after asset spending. This is the number that can fund dividends, debt repayment, buybacks or growth.
Growth-focused and value-focused investors weigh this cash differently, as value investing vs growth investing explains.
How to Read OCF and FCF Together
Therefore, using both together is the safest habit. If you are new to company numbers, our page to learn fundamental analysis shows where cash flow fits.
Here is a simple way to read the pair:
- OCF positive, FCF positive: operations earn cash and some remains after capex.
- OCF positive, FCF negative: operations earn cash, but capex is higher than that cash. Check why.
- OCF negative: the core business is burning cash. FCF will be even weaker.
Is Free Cash Flow the Same as Profit?
Also, FCF is not the same thing as profit. Profit includes non-cash items and accounting timing, which we compare in detail in free cash flow versus net profit.
How to Read the FCF to OCF Ratio Over Several Years
One year of data can fool you, so compare the FCF-to-OCF ratio across years. This is simply FCF divided by OCF, shown as a percentage.
For Company A, the ratio was 66.7% in Year 1, -15.4% in Year 2 and 57.1% in Year 3. These are made-up numbers for illustration.
In fact, the pattern is more useful than any single year. A business that keeps converting a healthy share of OCF into FCF is in a stronger position. In contrast, one that never has cash left after capex faces more questions.
Then, check whether the capex was a planned, one-time expansion or a regular, repeating need. Thus, that answer changes how you should read the dip.
To see what drives returns on top of the cash picture, DuPont analysis is a useful companion.
Common Mistakes When Comparing OCF and FCF
Almost everyone slips on a few of these when starting out. So, a quick check now saves a lot of confusion later.
- Reading one year only. A big capex year can make FCF look terrible, while a low one can make it look great.
- Treating negative FCF as automatically bad. Growth capex can push FCF below zero even in a healthy business.
- Ignoring maintenance vs growth capex. Some capex only keeps existing assets running, while some builds new capacity. Reports do not always split them clearly.
- Comparing different industries directly. A capex-heavy business and an asset-light one will naturally show very different FCF.
- Using quarterly numbers alone. Cash flow can be lumpy, so quarterly results and share price moves are better read with several periods of context.
Limits of OCF and FCF: What the Numbers Cannot Tell You
Definitions are not identical everywhere. For example, some sources adjust FCF for interest paid or lease payments. As a result, two websites can show different FCF for one company.
Always check how the number is built. Besides, interest costs also move with rates, so the impact of interest rate on the stock market adds useful context.
Moreover, cash flow numbers also depend on accounting choices, such as how a company classifies certain spending. Read the notes in the annual report when something looks odd.
Finally, FCF and OCF are not buy or sell signals. They are one input among many.
To go deeper, good fundamental analysis books explain how to combine cash flow with profit, debt and valuation.
Do you also look at OCF and FCF and still feel unsure which one to trust?
Videos can explain the formula, but real statements and a mentor’s answers teach you to read the gap.
Join our live classes from your mobile, ask your doubts and learn step by step.
Conclusion
So, the difference between free cash flow and operating cash flow is just capex. OCF shows the cash the business earns, while FCF shows what is left after assets are funded.
In short, a company can have strong OCF and still show weak FCF in a heavy-spending year. As a result, one number alone can mislead you.
Therefore, use both together, compare several years, and read the reason behind every gap. Remember, this is learning, not a buy or sell signal.
Disclaimer: This page is for education only. All numbers are hypothetical and shown for illustration.
It is not investment advice or a recommendation to buy or sell anything. So, please do your own research or speak to a SEBI-registered adviser.
Frequently Asked Questions
Before investing capital, invest your time in learning Stock Market.
Fill in the basic details below and a callback will be arranged for more information: