


You see a company’s ROE jump from 20% to 25%. Good news, right? Maybe. But what actually changed? So, DuPont analysis answers that. It splits ROE into three parts, so you can see the real driver behind the number.
For example, a rising ROE can come from better margins, faster asset use or just more debt.
Each cause means something different, so DuPont helps you tell them apart.
What Is DuPont Analysis?
DuPont analysis is a method that breaks return on equity (ROE) into smaller drivers. Also, each driver tells you a different story about the business.
Besides, it is also called the DuPont model or DuPont identity. The idea is old, but it is still a handy way to read a company’s numbers.
ROE alone tells you how much profit a company earns on shareholders’ money. In contrast, DuPont tells you how it got there.
For example, think of ROE as a final exam score. Then, DuPont is the report card showing which subjects pulled it up or down.
Still, if ratios are new to you, it helps to first learn fundamental analysis step by step. Then come back to this method.
DuPont Analysis Formula: How the 3-Step Method Works
The 3 step DuPont analysis uses this formula:
ROE = Net profit margin x Asset turnover x Equity multiplier
Written out in full, it looks like this:
ROE = (Net profit / Revenue) x (Revenue / Average total assets) x (Average total assets / Average equity)
Notice how revenue and average total assets cancel out. So, you are left with net profit divided by average equity, which is plain ROE.
That is why the three parts always multiply back to the same ROE.
In short, it is profitability, efficiency and leverage. Also, every ROE change comes from one or more of these three.
Understanding the Three Core Drivers of DuPont Analysis
Now, let us look at each driver one by one.
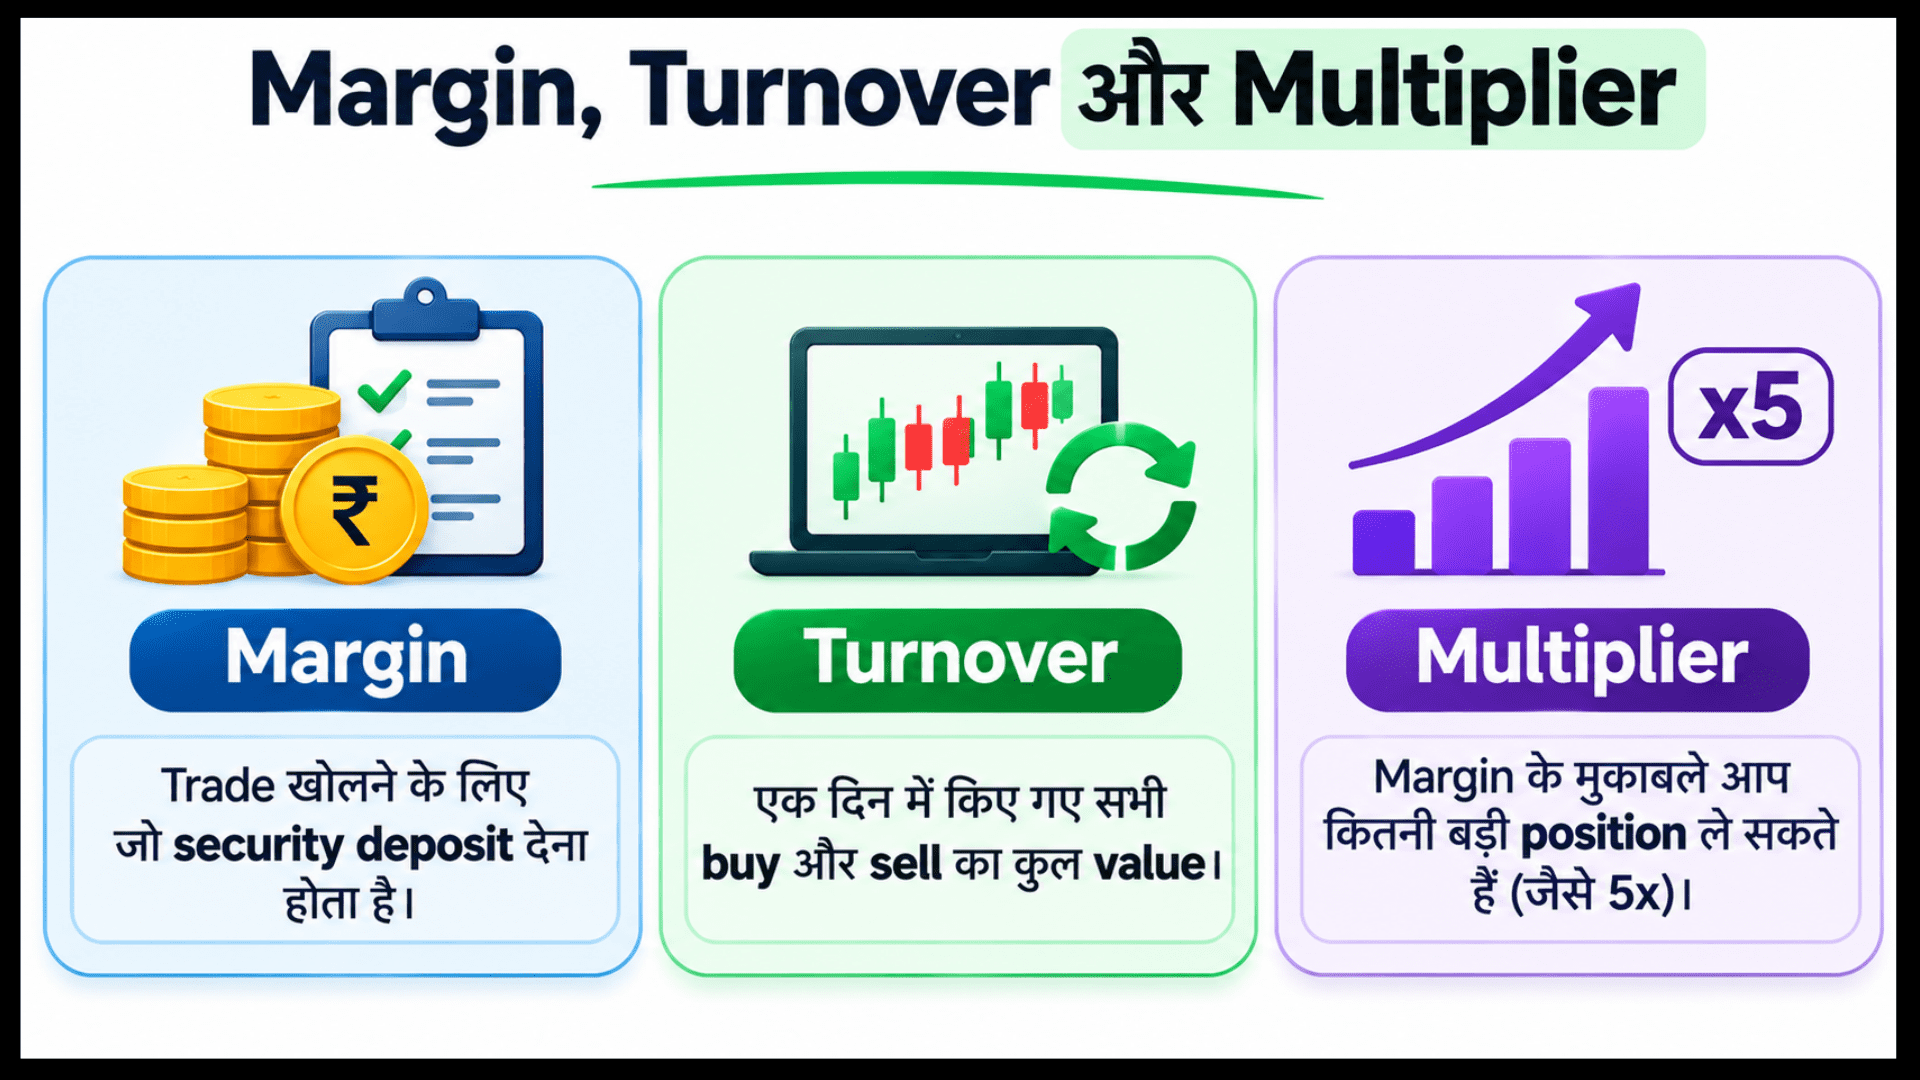
- Net profit margin is the profit left after all costs, interest and tax. First, a higher margin means the company keeps more from each sale.
- Asset turnover shows how much revenue the company earns from every rupee of assets. Next, a business that sells more with the same assets has a higher turnover.
- Equity multiplier shows how much the company relies on borrowed money. Finally, a higher number means more assets are funded by debt, not by shareholders.
But here is the catch. A higher equity multiplier can lift ROE, but it also adds risk. If you wonder why do we use DuPont analysis, spotting this risk is one big reason. We will see it in the example below.
Also, different industries naturally look different. For example, some run on thin margins and high turnover, others on fat margins and slow turnover.
DuPont Analysis Example
Now let us put numbers on it. The figures below are for Company A and are for illustration only.
First, they are not real data. Also, we compare two years, and all amounts are in a hypothetical unit, say crore.
| Item | Year 1 | Year 2 |
|---|---|---|
| Revenue | 1,000 | 1,100 |
| Net profit | 80 | 110 |
| Average total assets | 800 | 880 |
| Average equity | 400 | 440 |
Next, we apply the formulas. Also, every number below is computed from the table above.
| Driver | Year 1 | Year 2 |
|---|---|---|
| Net profit margin | 8.0% | 10.0% |
| Asset turnover | 1.25 | 1.25 |
| Equity multiplier | 2.00 | 2.00 |
| ROE | 20.0% | 25.0% |
First, check Year 1: 8.0% x 1.25 x 2.00 = 20.0%. Then, check Year 2: 10.0% x 1.25 x 2.00 = 25.0%.
So, ROE rose by 5 percentage points. Now, look at the drivers: turnover stayed at 1.25 and the multiplier stayed at 2.00.
Instead, only the net profit margin moved, from 8.0% to 10.0%. In fact, the whole rise came from better profitability, not from more debt or faster asset use.
This is the power of the method. For example, two investors could see the same 25% ROE and read it very differently.
If the multiplier had jumped instead, the same ROE rise would carry more risk. However, a rise from higher margin is usually read as a healthier sign than one from added borrowing.
Cash can help here, because profit can rise without cash rising.
For example, Free Cash Flow Meaning shows how to check whether profit turns into cash.
DuPont raises the question. However, it does not answer it.
Also, DuPont says nothing about price timing. Therefore, many readers pair it with chart reading, and you can learn technical analysis step by step.
Why Use Average Values in DuPont Analysis?
Profit and revenue cover a full year. However, assets and equity are snapshots on a single date.
So, many analysts use the average of opening and closing balances. This matches a full-year flow with a full-year balance.
Some sources use year-end values instead. Then, the numbers can differ slightly from another source.
So, always check which method a source used before comparing two ROE or DuPont figures.
Cash figures need the same care, because two cash numbers can tell different stories.
For example, Free Cash Flow vs Operating Cash Flow shows how the gap appears.
Easy Step DuPont Model Explained with an Example
There is also a 5-step version. It splits the net profit margin into three smaller parts.
The five parts are: tax burden, interest burden, EBIT margin, asset turnover and equity multiplier.
Here is how the same Company A looks under this view. Also, these are hypothetical numbers for illustration.
| Driver | Formula | Year 1 | Year 2 |
|---|---|---|---|
| Tax burden | Net profit / Profit before tax | 0.667 | 0.733 |
| Interest burden | Profit before tax / EBIT | 0.857 | 0.882 |
| EBIT margin | EBIT / Revenue | 14.0% | 15.5% |
| Asset turnover | Revenue / Average total assets | 1.25 | 1.25 |
| Equity multiplier | Average total assets / Average equity | 2.00 | 2.00 |
Then, multiply the five and you get back the same ROE: 20.0% in Year 1 and 25.0% in Year 2.
In this example, EBIT is 140 and 170. Also, interest is 20 in both years, and tax is 40 in both years.
So, part of the profit gain came from operations, and part came from a lower tax share of profit.
In short, the 5 step view shows whether the gain came from the business itself or from tax and interest.
For most beginners, the 3 step version is enough to start with. Besides, a structured fundamental analysis course helps you practise both versions on real statements.
Limitations of DuPont Analysis
DuPont is useful, but it is not a magic tool. So, keep these limits in mind.
- Accounting choices differ. Two companies may report profit and assets in different ways.
- One year can mislead. A single year may include one-off gains or losses.
- Banks and financial companies are read differently. Their balance sheets work in a different way, so the same breakdown does not fit them neatly.
- It uses past numbers. Past results do not guarantee future results.
- It explains ROE, not value. A good ROE breakdown does not tell you if a company is fairly priced.It explains ROE, not value. A good ROE breakdown does not tell you if a company is fairly priced. How to Find Valuation of a Stock covers that next step.
So, treat it as one input among many. Fundamentals alone cannot tell you how a share will behave.
Besides, even valuation ratios need care, as is low PEG ratio good shows.
Also, quarterly numbers can move prices in the short run. Our note on the impact of quarterly results on share price explains this.
Is DuPont Analysis Same as ROE?
Short answer: no. Instead, ROE is one ratio, but DuPont is a method that splits that ratio into drivers.
Many readers ask is DuPont analysis the same as ROE when they first see this split, and the difference is simple.
Why Do Investors Use the DuPont Model?
Investors use it to find the driver behind a change in ROE. Also, they compare peers and spot ROE that comes mostly from debt.
Besides, the longer list of uses is covered in why do we use DuPont analysis.
Moreover, both value and growth investors read ROE, though they look at it differently. Our comparison of value investing And growth investing explains how each style thinks.
How DuPont Analysis Fits With Other Ratios
DuPont works best next to other ratios. First, PE tells you what the market pays for earnings, while ROE tells you how well the company earns them.
Also, growth-adjusted measures add one more angle. You can see this in what is PEG ratio and how it is calculated.
How to Do a DuPont Analysis?
Whether you track one stock or a full watchlist, a repeatable routine saves you from guessing.
- Collect revenue, net profit, total assets and equity for two or more years.
- Calculate average total assets and average equity for each year.
- Compute net profit margin, asset turnover and equity multiplier.
- Multiply the three and confirm the result matches ROE.
- Compare years and note which driver moved.
- Ask why that driver moved, using the annual report and results commentary.
Also, do this for a few companies in the same industry. Then, patterns become clearer when you compare like with like.
Besides, to go deeper into ratio analysis, a few fundamental analysis books walk through it with more examples.
Seen a high ROE and unsure whether it comes from profit or from debt?
Videos can explain the formula, but real annual reports and a mentor’s answers show you what the numbers hide.
Join our live classes from your mobile, ask your doubts and learn step by step.
Conclusion
DuPont analysis splits ROE into margin, turnover and leverage, so you can see what really moved the number. However, it explains ROE, not value, so treat it as one input among many.
Also, always ask why a driver moved and check whether the source used average or year-end values. Finally, practise on a few real companies in the same industry.
Disclaimer: This page is for education only and is not investment advice. All numbers are hypothetical and for illustration only, and past results do not guarantee future results.
We do not promise profits. So, please do your own research or speak to a registered adviser before investing.
Frequently Asked Questions
Before investing capital, invest your time in learning Stock Market.
Fill in the basic details below and a callback will be arranged for more information: