

You found a stock with a PEG of 0.5 and it looks like a bargain. Then a small voice asks, Is a low PEG ratio good?
That doubt is healthy, reminding you that market prices often reflect underlying risks that aren’t immediately obvious on paper.
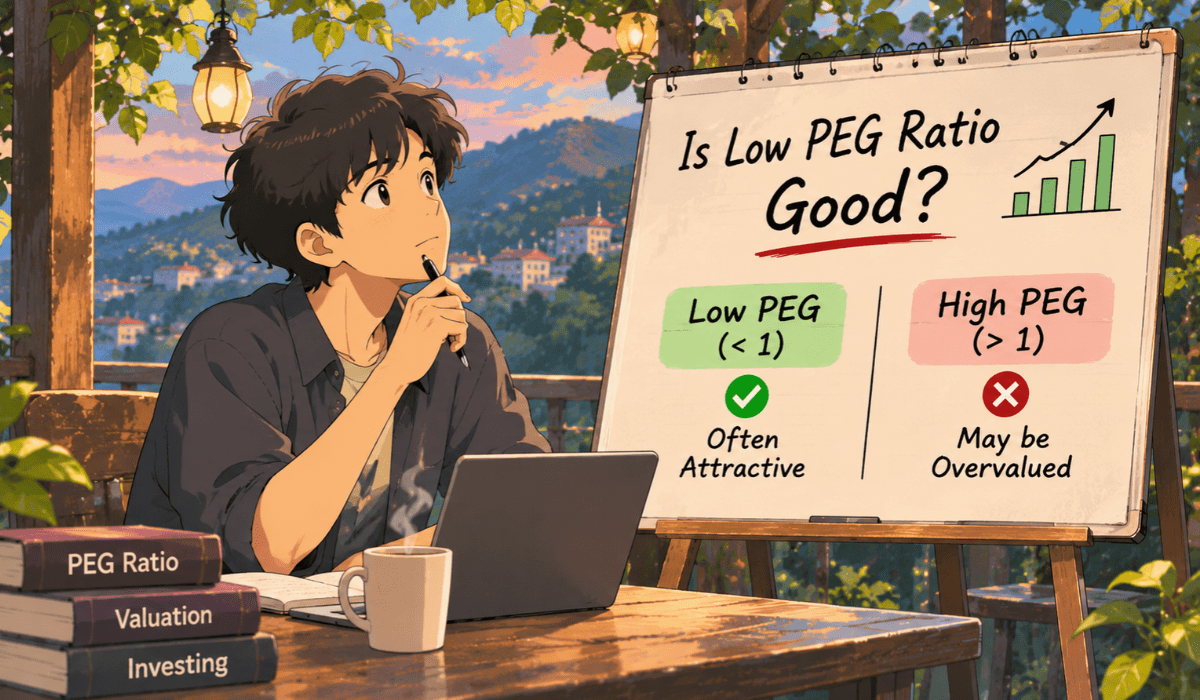
So, is low PEG ratio good? Sometimes yes, but often it needs a second look before you commit your capital.
Low PEG Ratio Meaning in Simple Words
The PEG ratio compares a company’s P/E with its expected earnings growth. First, a low value means you pay less for each unit of expected growth.
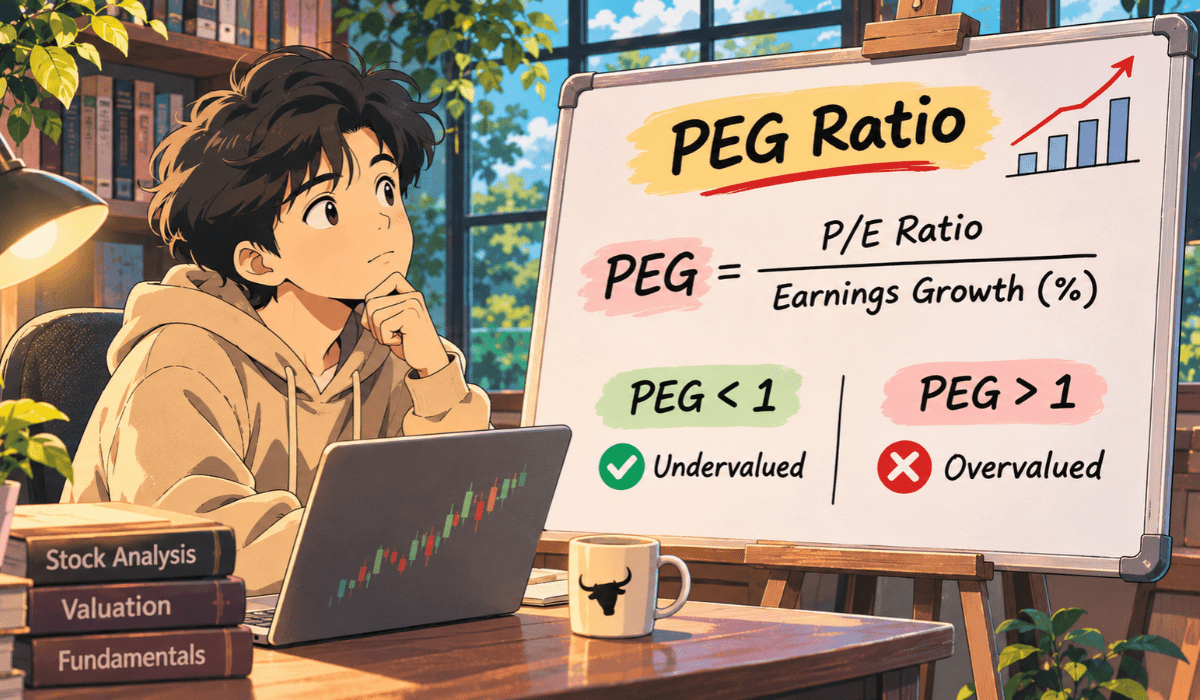
In one line, PEG = P/E divided by expected annual earnings growth (in %). Also, for the full calculation, our page on what is PEG ratio walks through it step by step.
Here we only read the result. So, a low PEG says the market price may not fully reflect the growth that is expected.
The words “may” and “expected” matter. In fact, both can turn out wrong.
What Is a Good PEG Ratio?
Many learners hear that a PEG near 1 is “fair” and a PEG below 1 is “cheap”. However, this is a common rule of thumb, nothing more.
The idea is simple. If P/E equals the growth rate, you pay one unit of P/E for each percent of growth. Thus, that feels balanced.
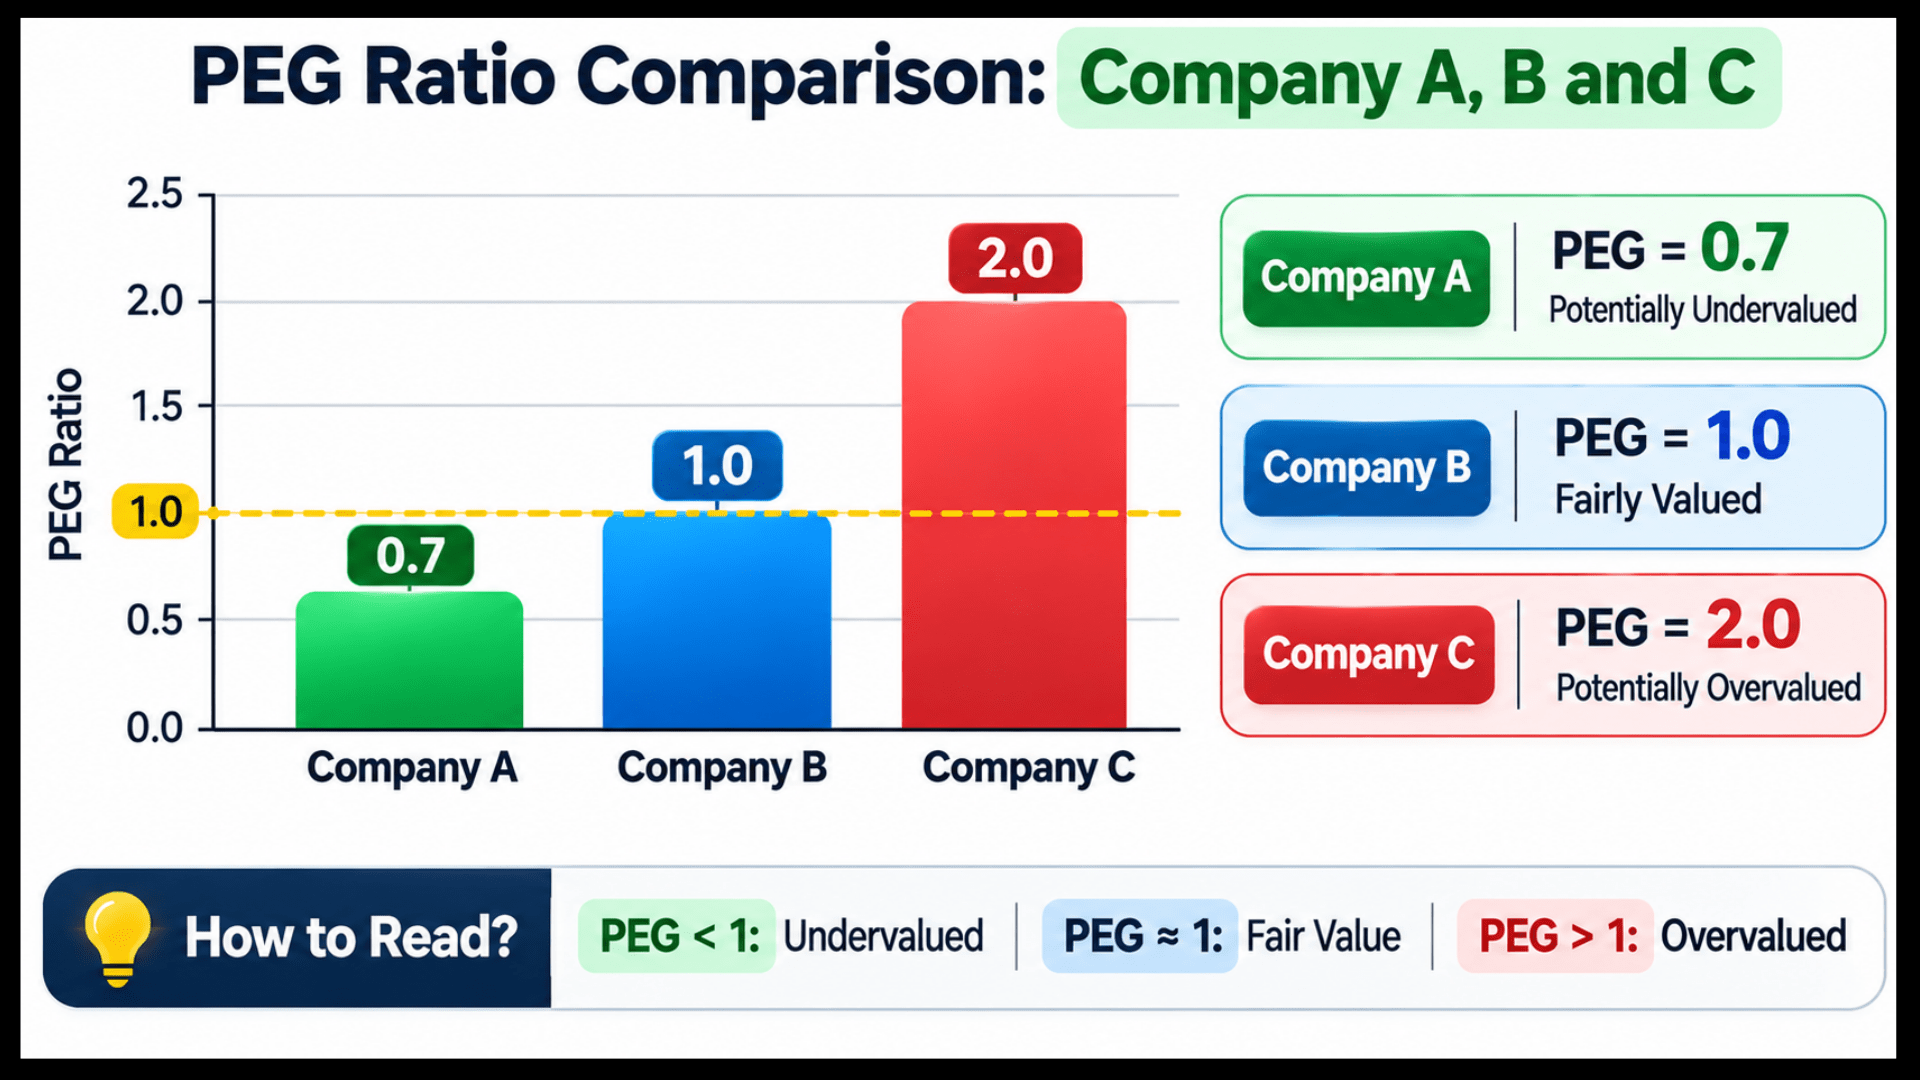
But the number 1 has no scientific power behind it. Instead, it is a convenient anchor. Investors who follow value investing use it only as a starting point.
So, what is a good PEG ratio? There is no single answer.
Instead, it depends on the business, the sector and how reliable the growth estimate is. Quality matters too, and many ask is DuPont analysis the same as ROE when judging returns.
Is a Low PEG Ratio Good? A Breakdown of Three Stock Scenarios
Let us compare three hypothetical companies. The numbers are for illustration only.
We use the formula PEG = P/E / expected growth (%). Also, whether you are screening stocks for the first time or the hundredth, a simple example makes this clearer.
| Company | P/E | Expected annual growth | PEG |
|---|---|---|---|
| Company A | 15 | 25% | 0.60 |
| Company B | 25 | 25% | 1.00 |
| Company C | 40 | 20% | 2.00 |
Company A has the lowest PEG, so on paper it looks the cheapest for its growth. In contrast, Company C looks the most expensive.
Now the important part. This table says nothing about whether the 25% growth for Company A is believable. So, the PEG is only as good as that one input.
Still, if you are building your base, our page to learn fundamental analysis covers other checks to use alongside PEG.
What Do Low, Near-1, and High PEG Ratios Actually Signal?
Here is a simple way to read each level. First, these are possible readings, not verdicts.
- Well below 1: growth may be underpriced, or the estimate may be too hopeful. Check how reliable the estimate is.
- Around 1: price and growth look broadly in step. Check quality of earnings and debt.
- Well above 1: the market may be paying a premium, or growth may be slowing. Check whether growth is likely to continue.
Notice that every point ends with a check. In fact, that is the whole point of this page.
A low number starts your research. However, it does not finish it.
Is a Low PEG Ratio Good or Just a Trap?
A low PEG can look great and still hide trouble. So, here are the most common traps:
- Shrinking growth estimates: the PEG looks low only because old, higher estimates are still being used.
- One-off growth: a single big gain, such as a sale of an asset, inflates growth for one year only.
- Cyclical earnings: profits peak at the top of a cycle, so P/E looks low and growth looks high.
- Weak balance sheet: heavy debt can wipe out growth when conditions turn.
- Tiny base: growing from a very small profit gives a huge percentage that does not last.
How Falling Growth Projections Alter the PEG Ratio
Let us see the first trap with numbers. Take hypothetical Company A with a P/E of 15.
Next, the table below shows how its PEG changes if the growth estimate is cut. Also, the numbers are for illustration only.
| Expected growth for Company A | P/E | PEG (P/E / growth) |
|---|---|---|
| 25% | 15 | 0.60 |
| 20% | 15 | 0.75 |
| 15% | 15 | 1.00 |
| 10% | 15 | 1.50 |
| 5% | 15 | 3.00 |
The price and P/E did not change at all. Instead, only the growth estimate moved, and the “bargain” turned into an expensive stock on paper.
This is why one PEG number can feel certain and still be fragile. Therefore, careful investors keep a margin of safety for exactly this reason.
Why Do PEG Ratio Growth Estimates Change?
Estimates come from analysts or from your own work. Moreover, they are revised after every result, and sometimes after a single news item.
Then, a weak quarter can pull the expected growth down quickly. Want to see how such updates move prices? Read about the impact of quarterly results on share price.
Also, past growth does not guarantee future growth. For example, a company that grew fast for three years can slow down in the fourth.
Besides, different websites use different growth numbers. So, a PEG from one source may not match another.
Meanwhile, some readers also study price charts alongside estimates. You can learn technical analysis step by step for that.
Why Low PEG Multiples Can Be Misleading?
These three traps can fool even careful readers. So, let us see each one with numbers.
First, take a hypothetical Company X whose profit per share rose from Rs 10 to Rs 14. The reason is a one-time asset sale.
That is 40% growth on paper. Now, at a price of Rs 150, the P/E on the old profit is 15.0.
On the new profit, it is about 10.7. Both look low.
But the extra Rs 4 will not repeat next year. In fact, the growth was real in the books and useless for the future.
Likewise, a tiny base creates a similar illusion. If profit grows from Re 1 to Rs 3 per share, that is 200% growth.
With a P/E of 30, the PEG is 0.15. But this looks absurdly cheap and tells you almost nothing.
Finally, cyclical businesses are tricky too. Their profit swings with demand, so a low P/E at peak profit can be a warning, not a bargain.
Spotting such traps gets easier with practice on real statements. Besides, a structured fundamental analysis course can guide you through that.
Is Low PEG Ratio Good for Every Sector?
No, because sectors grow and are valued differently.
For example, a mature business with slow, steady profits may always show a higher PEG. Its growth is small but dependable. In contrast, a young, fast-moving sector may show a lower PEG, yet its growth is harder to predict.
Moreover, banks and other financial companies are read differently, since their earnings depend on lending and balance sheet structure.
So, compare a company with its own sector peers, not with the whole market. Likewise, DuPont analysis is easiest to read when you compare peers in the same sector.
A PEG of 1.2 in one sector can be more reasonable than a PEG of 0.8 in another. Finally, the context decides.
Good PEG Ratio vs Value Investing: How to Think About Price
Some investors treat PEG as a bridge between value and growth ideas. Also, they want growth but do not wish to overpay.
If that sounds like you, our comparison of value investing vs growth investing explains how each style thinks about price.
Similarly, value-minded investors like a cushion against mistakes in their estimates. The same idea applies here.
So, if your growth estimate is shaky, you may want a bigger gap before you feel comfortable.
Checklist Before You Trust a PEG Ratio
Run through these questions every time. So, this short table keeps them in one place.
| Question | Why it matters |
|---|---|
| Which growth rate was used: past or expected? | The answer can change the PEG a lot |
| Is the growth from regular business or a one-off? | One-offs do not repeat |
| Is the profit base very small? | Small bases give inflated growth |
| Are earnings cyclical? | Peak profits mislead |
| How much debt does the company carry? | Debt can hurt in a slow phase |
| How does it compare with sector peers? | Sectors differ widely |
| What happens to PEG if growth falls by half? | It tests how fragile the number is |
Also, fundamentals are one input, not the full picture. Estimates can be wrong, so treat PEG as a screening aid.
Besides, many learners read standard books to build this judgement. Our list of fundamental analysis books is a good starting point.
Moreover, a mentor review of your checklist answers can catch blind spots that you miss on your own.
Found a stock with a tempting low PEG and unsure whether to trust it?
Videos can explain the formula, but real statements and a mentor’s answers show you which numbers to trust. Join our live classes from your mobile, ask your doubts and learn step by step.
Conclusion
A low PEG ratio can be a good starting point, but it is never a verdict.
However, the number is only as strong as the growth estimate behind it.
So, check the growth source, the debt, the sector and the quality of earnings. Finally, treat PEG as a screening aid and keep a cushion for mistakes.
Disclaimer: This page is for education only and is not investment advice. Also, all numbers are hypothetical and for illustration only.
Besides, estimates can be wrong, and past growth does not guarantee future growth. We do not promise profits. So, please do your own research or speak to a registered adviser before investing.
Frequently Asked Questions
Before investing capital, invest your time in learning Stock Market.
Fill in the basic details below and a callback will be arranged for more information: