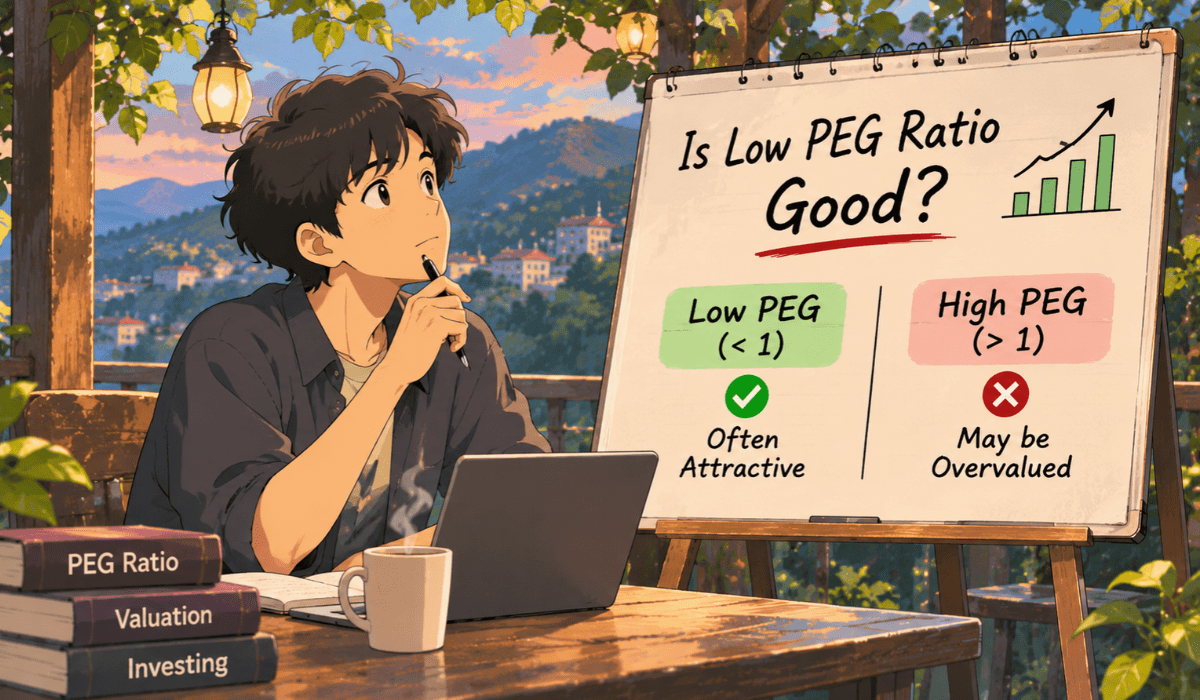


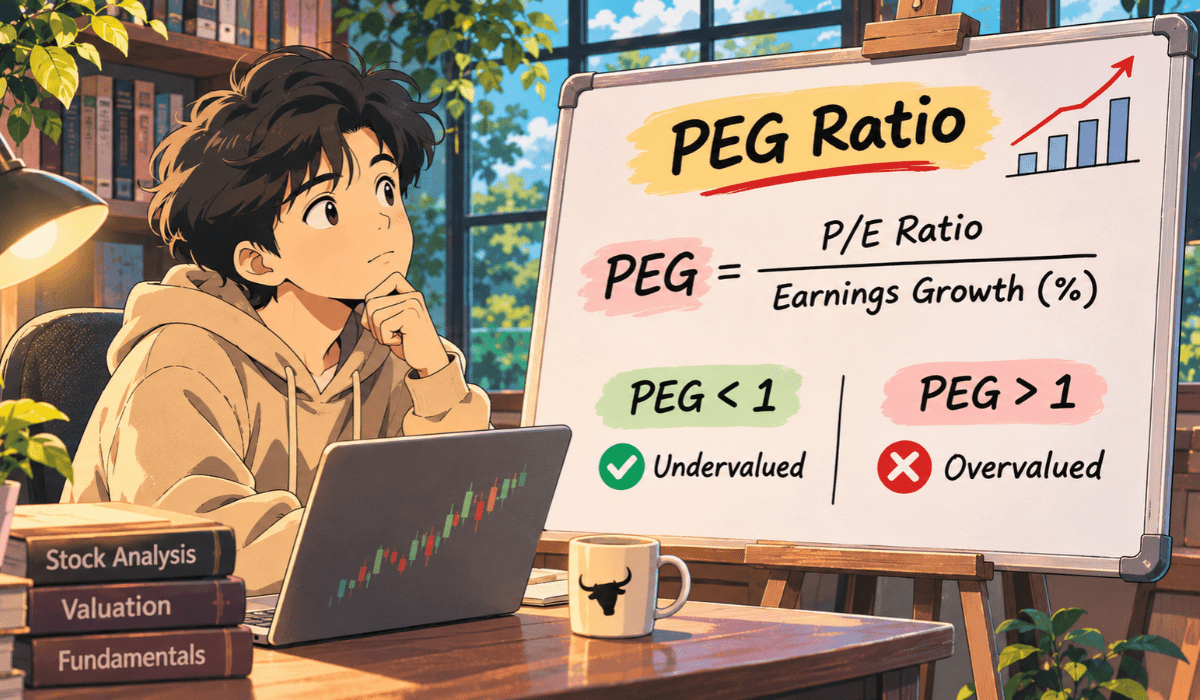
You see a stock with a P/E of 20 and wonder if that is high or low.
So, what is PEG ratio and why do people use it? In fact, it adds one missing piece to P/E: how fast earnings are expected to grow.
Whether you are new to ratios or tired of confusing numbers, this page keeps things simple and practical.
What Does the PEG Ratio Tell You?
The PEG ratio stands for price/earnings to growth ratio. First, it takes the P/E ratio and divides it by the expected yearly growth in earnings.
Now, P/E tells you how much the market pays for each rupee of profit. However, PEG asks a follow-up: is that price fair given how quickly profit may grow?
For example, think of two shops selling at the same price per rupee of profit. So, if one shop’s profit is growing faster, a buyer may see its price differently.
That is the whole idea behind the PEG ratio meaning. In short, it puts growth next to valuation.
Many investors use PEG to judge price and DuPont analysis to judge business quality.
PEG Ratio Formula
The PEG ratio formula is short. Also, it needs only two inputs, which are P/E and expected growth.
PEG ratio = P/E ratio / expected annual earnings growth rate (in percent)
First, the P/E is price divided by earnings per share (EPS). Next, the growth rate is a yearly percentage, entered as a plain number.
For example, a growth of 25% goes into the formula as 25, not 0.25.
Also, P/E itself is a plain ratio, so no extra data is needed beyond price and EPS.
The Difference Between PEG and PE Ratios Explained
Many beginners also search for the PEG ratio vs PE ratio difference. So, let us compare them side by side.
First, P/E looks at today’s price against today’s profit. In contrast, PEG looks at the same P/E but adjusts it for growth.
Now, use this table to see the difference. Also, all figures are for illustration only.
| Point | P/E ratio | PEG ratio |
|---|---|---|
| What it uses | Price and EPS | P/E and growth rate |
| What it answers | How much is paid per rupee of profit | How that price compares with expected growth |
| Needs a forecast? | No, if trailing EPS is used | Yes, a growth number is needed |
| Main weakness | Ignores growth | Depends on a growth estimate that can be wrong |
Notice the last row: PEG gives you more context, but it also brings in an estimate. Likewise, if you wonder why do we use DuPont analysis, it splits one ratio to show its cause.
Also, growth-minded investors lean on this ratio often. Moreover, it helps to see how that style differs from the other camp.
Our note on value investing vs growth investing shows this.
How to Calculate PEG Ratio?
Here is how to calculate PEG ratio in four steps. So, we use a hypothetical Company.
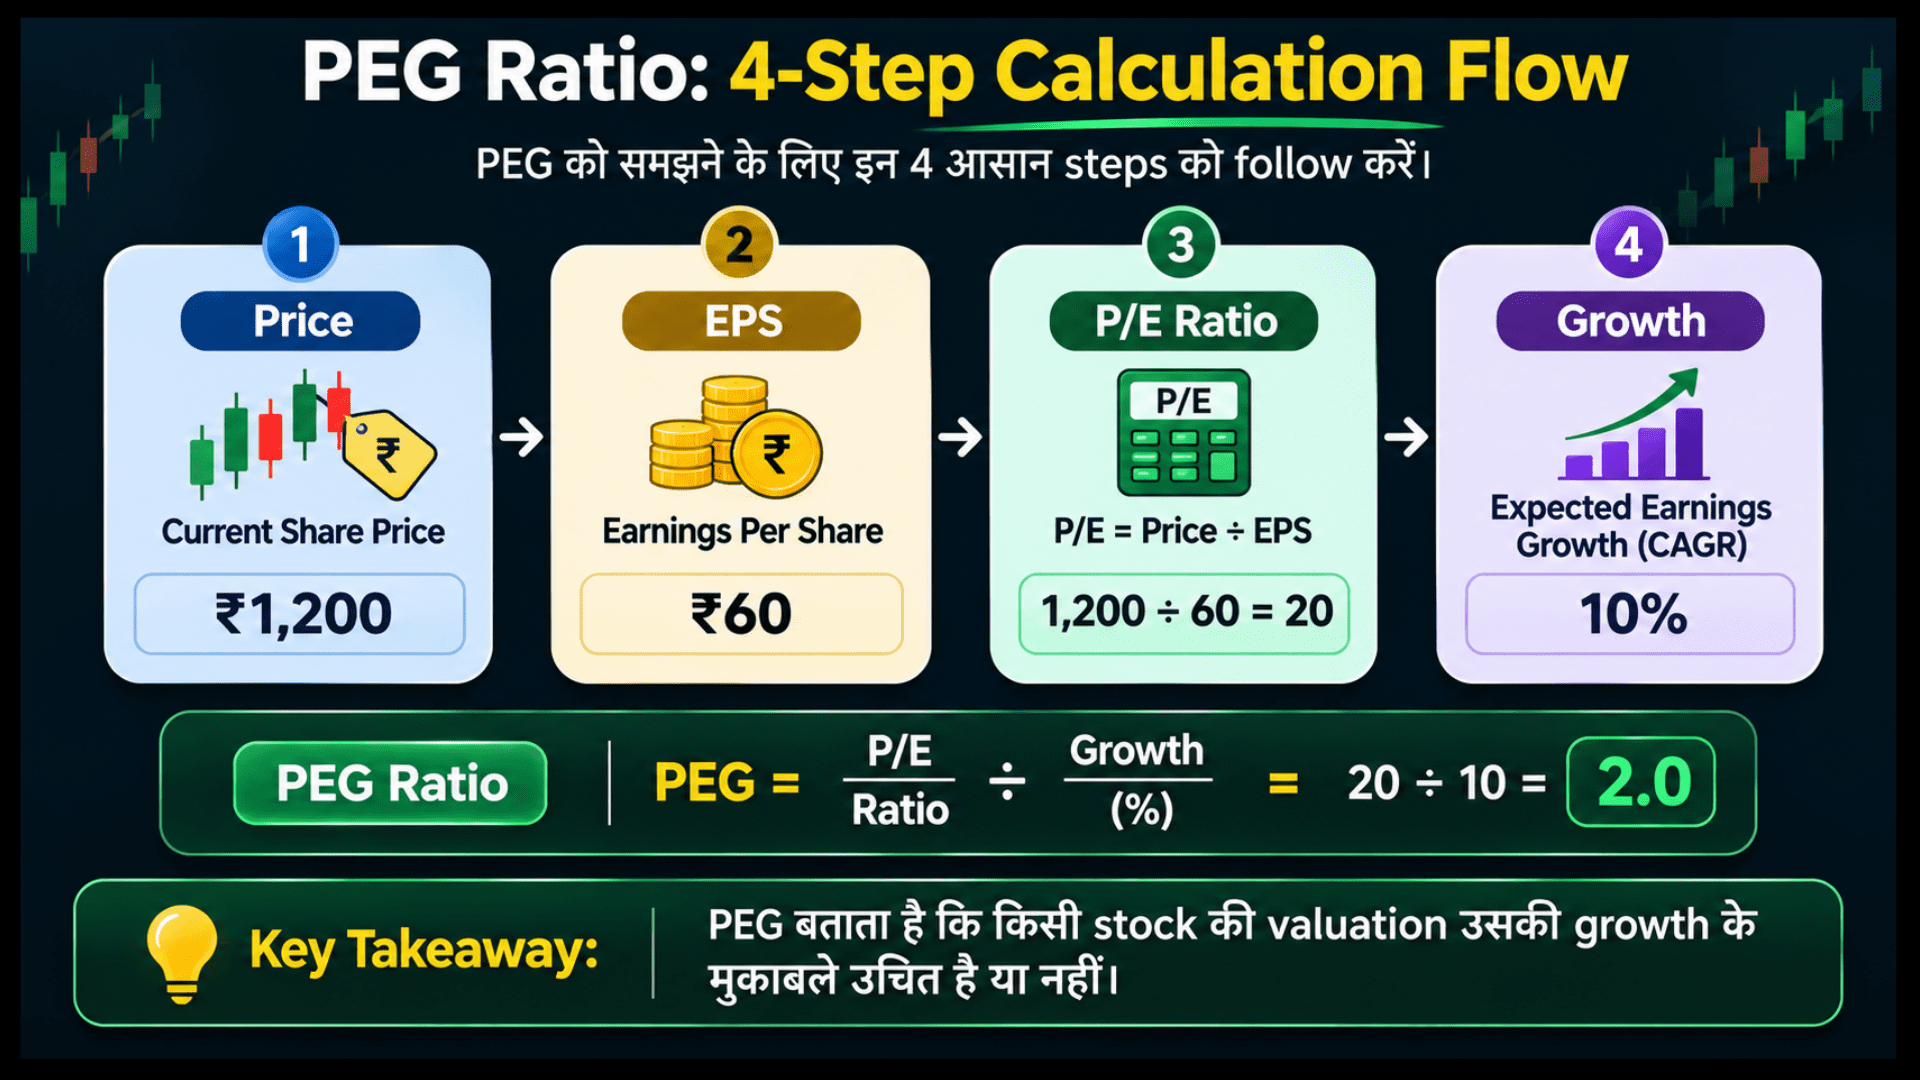
Also, all numbers are for illustration only and are not real data.
Step 1: Get the price and EPS. First, assume Company A trades at Rs 300 and its EPS over the last 12 months is Rs 15.
Step 2: Find the P/E. Then, P/E = 300 / 15 = 20.
Step 3: Choose a growth rate. Next, assume the EPS three years ago was Rs 10.
Then, growth per year (CAGR) = (15 / 10)^(1/3) – 1 = 14.47%.
Step 4: Divide. Finally, PEG = 20 / 14.47 = 1.38.
PEG Ratio Calculation Table: Company A Example
Next, the table below puts the steps together. Also, each row shows the formula used.
| Item | Formula | Company A (hypothetical) |
|---|---|---|
| Price | Given | Rs 300 |
| EPS (last 12 months) | Given | Rs 15 |
| P/E | Price / EPS | 20.00 |
| EPS three years ago | Given | Rs 10 |
| Annual EPS growth (CAGR) | (15 / 10)^(1/3) – 1 | 14.47% |
| PEG ratio | P/E / growth | 1.38 |
Now a fair question arises. We used past growth here, but is that the right growth number?
Which Growth Rate to Use in PEG Ratio?
First, there is no single correct answer. Different people use different growth numbers, so PEG values differ across sources.
Next, the usual choices are shown below. Each has a clear strength and a clear limit.
| Growth choice | What it is | Strength | Limit |
|---|---|---|---|
| Trailing (past) growth | Earnings growth from past years | Based on reported numbers | Past growth may not repeat |
| Forward (expected) growth | Estimate for coming years | Looks ahead, which is what a buyer cares about | It is an estimate and can be wrong |
| Analyst average | Average of several published estimates | Reduces one person’s bias | Analysts can all be too hopeful |
Comparing Trailing and Forward Growth in PEG Calculations
Now, let us see the effect on Company A. Then, assume the expected EPS for next year is Rs 18.75.
Expected growth = (18.75 / 15) – 1 = 25%.
First, with forward growth, PEG = 20 / 25 = 0.80. But with trailing growth, PEG = 20 / 14.47 = 1.38.
So, same company and same price give two very different PEG values.
In fact, many people prefer forward growth because a buyer pays for future earnings. Still, whichever you pick, write it down and use the same choice everywhere.
Also, choosing inputs gets easier with guidance. Besides, a structured fundamental analysis course lets you practise this on real statements.
Next, reading these results is a topic of its own. Want to know what a low or high value suggests? See our page on whether a low PEG ratio is good.
How to Avoid Common Calculation Mistakes with the PEG Ratio?
In fact, most mistakes come from the inputs, not the formula. So, watch for these.
- Mixing growth periods. One source may use a 3-year past growth, another a 5-year forecast.
- Using a percent as a decimal. Entering 0.25 instead of 25 gives a PEG that is 100 times too large.
- One-off profits. A sale of an asset can lift EPS for one year and distort growth.
- Very small base. Growth from Rs 1 to Rs 3 looks like 200%, but the business may still be tiny.
- Negative or zero earnings. If EPS is negative, P/E and PEG have no meaningful value.
- Stale estimates. Forecasts change after every quarterly result.
Moreover, on that last point, quarterly numbers can move expectations quickly. Our page on the impact of quarterly results on share price explains why estimates are rarely fixed for long.
How Different Growth Rates Change the PEG Ratio?
Now, let us compare two hypothetical companies. Both have a P/E of 20.
First, Company A has an expected growth of 25%. Meanwhile, Company B has an expected growth of 10%.
Next, the table below applies the formula to both. Figures are for illustration only.
| Company | P/E | Expected growth (% per year) | PEG = P/E / growth |
|---|---|---|---|
| Company A | 20 | 25 | 0.80 |
| Company B | 20 | 10 | 2.00 |
First, on P/E alone, the two look identical. However, on PEG, Company A is priced lower for each unit of expected growth.
Does that mean Company A is a better pick? Not automatically.
In fact, the growth number is a forecast, and forecasts miss. Quality matters too, and many ask is DuPont analysis the same as ROE when judging returns.
Similarly, value-minded readers ask for room for error. This idea is explained in margin of safety in value investing.
Also, PEG says nothing about timing. Therefore, many readers pair it with chart reading. You can learn technical analysis step by step.
Is PEG Ratio Enough? Where It Fits in Your Stock Research
First, PEG is one input in fundamental analysis. Also, it does not look at debt, cash flow, management quality or business risk.
So, a beginner who wants a full roadmap can start with our page to learn fundamental analysis step by step.
Limits of the PEG Ratio: What It Cannot Tell You
So, keep these limits in mind before you rely on the number.
- Growth is an estimate. Forecasts can be wrong, and past growth does not guarantee future growth.
- Growth rarely stays constant. Instead, the formula assumes one steady yearly rate, which real businesses seldom deliver.
- Sources differ. For example, a PEG from one site may not match another because the growth input differs.
- Not for every business. Banks and other financial companies are read with different measures. Also, cyclical businesses swing sharply.
- No view on debt or risk. Two companies with the same PEG can have very different risk.
So, treat PEG as a starting point for questions, not as a verdict. Then, to build the base, many readers pick up a few fundamental analysis books and work through the examples.
Also, a mentor can help you review how you read such ratios. This is a big part of how we teach.
Confused why PEG ratio shows a different number on every website?
Videos can explain the formula, but only real statements and a mentor’s answers teach you which growth number to trust.
Join our live classes from your mobile, ask your doubts and learn step by step.
Conclusion
The PEG ratio puts growth next to valuation by dividing P/E by expected yearly earnings growth. However, it is only as reliable as the growth estimate behind it, so always note which rate you used.
Also, use it alongside debt, cash flow and business quality, never as a final verdict. Finally, practise on a few real companies, because that is where the formula starts making sense.
Disclaimer: This page is for education only and is not personal advice. Also, all numbers and companies here are hypothetical and shown for illustration only.
Besides, estimates can be wrong, and past growth does not guarantee future growth. We do not promise profits, and no buy, sell or hold call is made. So, please do your own research or speak to a registered adviser.
Frequently Asked Questions
Before investing capital, invest your time in learning Stock Market.
Fill in the basic details below and a callback will be arranged for more information: