

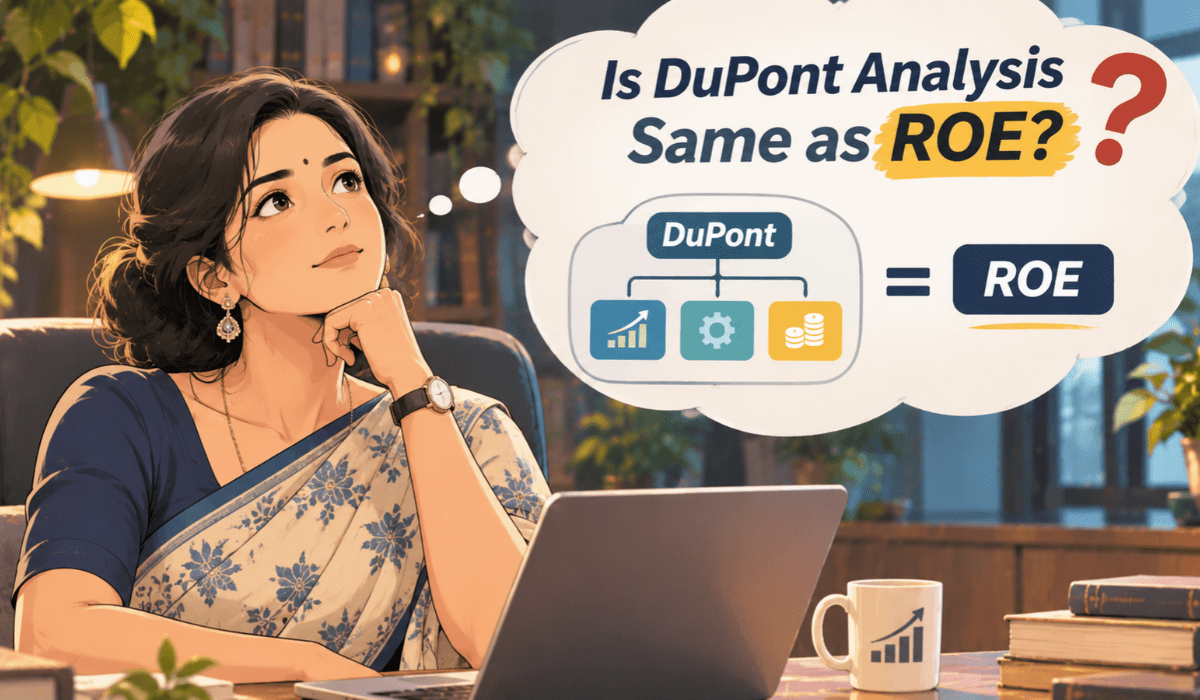
Is DuPont analysis the same as ROE? No. ROE is one number, and DuPont analysis is a method that breaks that number into parts.
Think of ROE as a final exam score. Likewise, DuPont is the mark sheet that shows which subjects produced the score.
So, if two companies show the same ROE, this page shows how to tell them apart.
What Is the Difference Between ROE And DuPont Analysis
First, many beginners treat the two as one thing. Here is the core difference in plain words.
ROE (return on equity) tells you how much profit a company earned for every 100 rupees of shareholder money. It is a single percentage.
Then, DuPont analysis starts from that same ROE and splits it into three drivers. However, it adds no new profit measure.
It only explains where the existing one came from. Therefore, if you wonder why do we use DuPont analysis at all, the answer is simple.
ROE shows the result, while the split shows the cause. Here is a quick side-by-side to keep the two ideas apart.
| Point | ROE | DuPont analysis |
|---|---|---|
| What it is | A single ratio | A method that splits that ratio |
| Question it answers | How much return on equity? | What produced that return? |
| Output | One percentage | Three drivers that multiply to the same percentage |
| Can two companies match? | Yes, easily | Their drivers can still look very different |
| Standalone use | Quick screening | Deeper comparison and diagnosis |
So, DuPont never replaces ROE. It sits behind it and opens it up.
DuPont Analysis Formula
The formula is short, so each part is easy to read on its own.
ROE = net profit margin x asset turnover x equity multiplier
Also, each part is a ratio you can read separately:
- Net profit margin: how much profit you earn per rupee of sales.
- Asset turnover: how much sales you earn per rupee of assets.
- Equity multiplier: how much of the assets are funded by borrowed money versus shareholders.
New to this? Start with our beginner guide to DuPont analysis, because here we only use the idea.
Why Two Companies With the Same ROE Can Differ in Quality
For example, two companies can both show a 20% ROE and still be very different businesses. One may earn it through strong profit margins.
However, another may earn it mostly by borrowing heavily. In fact, that is the real reason people ask this question.
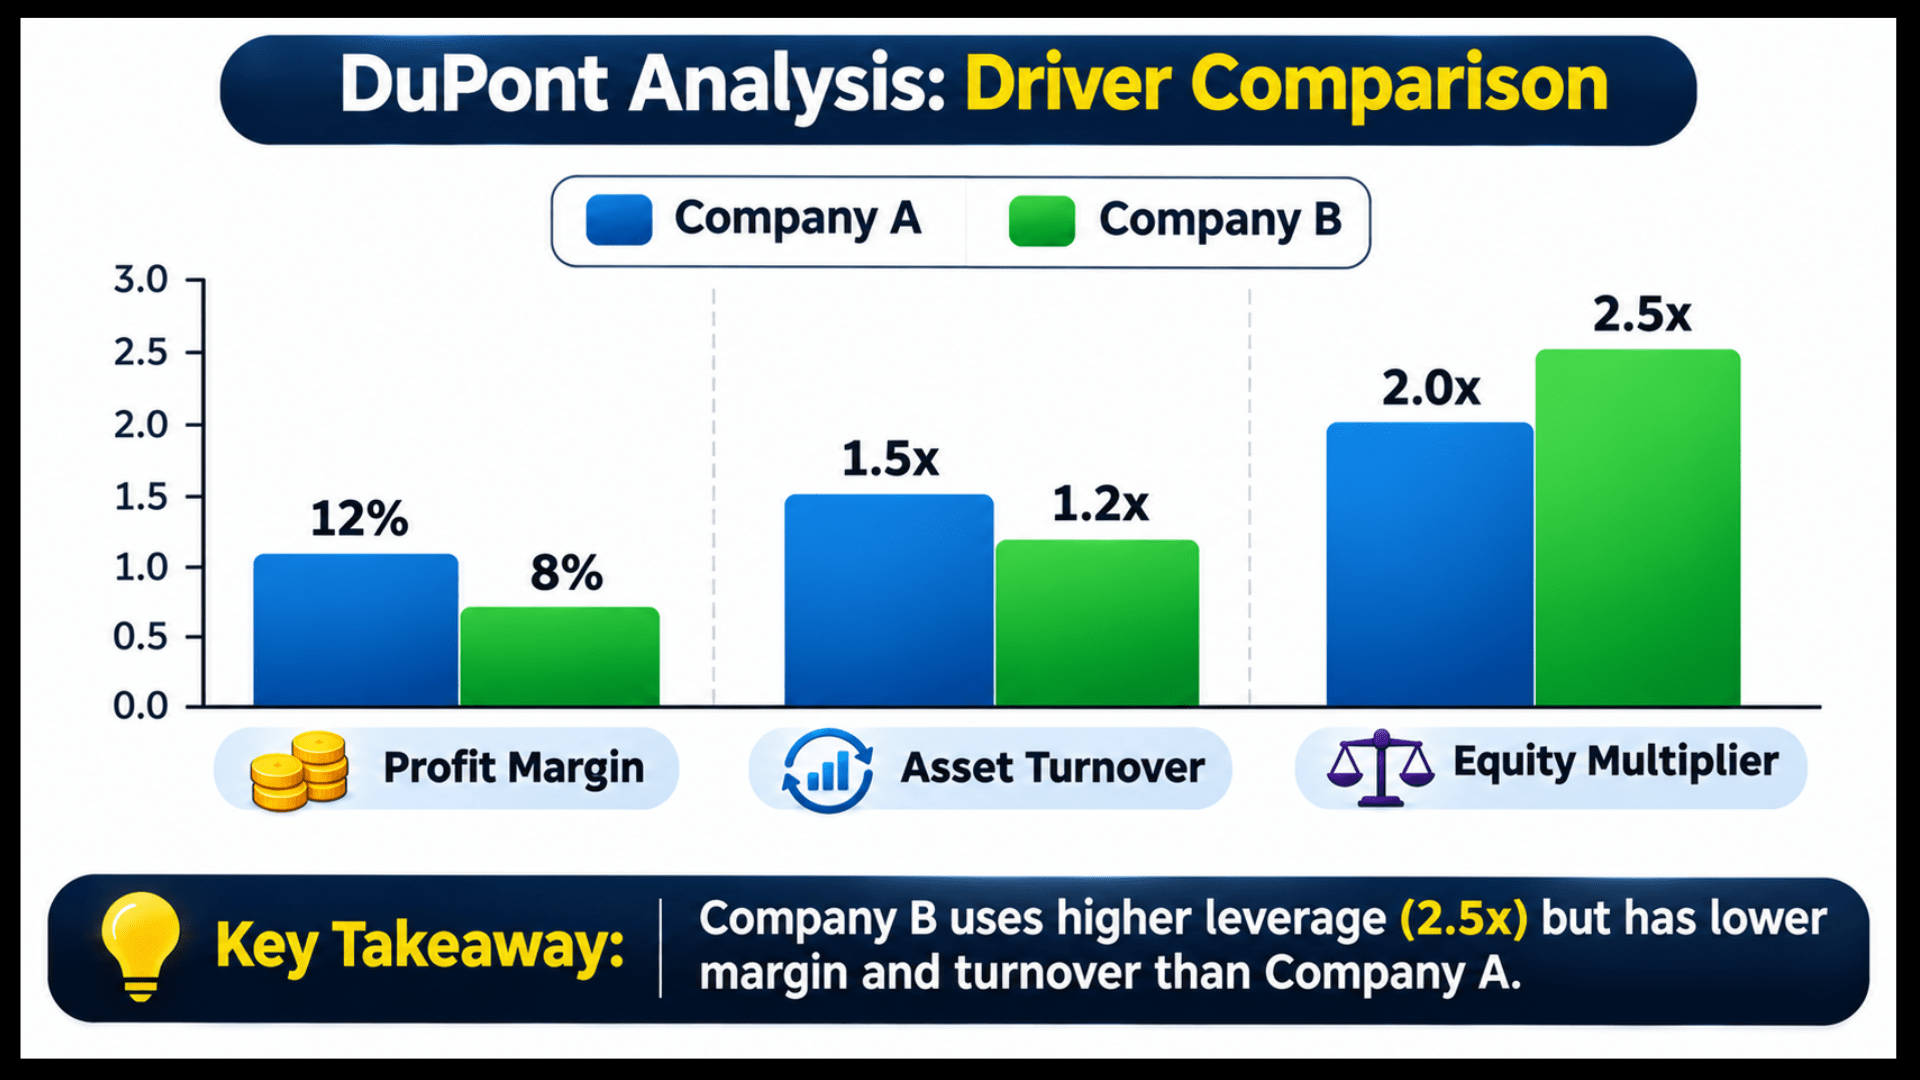
A matching ROE feels like a matching business, but it often is not. For this reason, reading a few fundamental analysis books helps you notice this pattern across many companies.
Next, let us see it with numbers.
Comparing Two Companies With the Same ROE
Please note that all figures below are for illustration only and are made up. Besides, both companies are hypothetical, with amounts in rupees crore.
First, Company A and Company B each have revenue of 1,000 and average total assets of 800. Company A has average equity of 600 and net profit of 120.
Meanwhile, Company B has average equity of 200 and net profit of 40. The formulas used are:
- Net profit margin = net profit / revenue
- Asset turnover = revenue / average total assets
- Equity multiplier = average total assets / average equity
- ROE = net profit / average equity
| Item | Company A | Company B |
|---|---|---|
| Net profit margin | 12.0% | 4.0% |
| Asset turnover | 1.25x | 1.25x |
| Equity multiplier | 1.33x | 4.00x |
| ROE (margin x turnover x multiplier) | 20.0% | 20.0% |
Both land on a 20% ROE. So, if you only looked at ROE, they would look like twins.
Breaking Down ROE: Margin-Led vs. Leverage-Led Businesses
Now, let us read the table one driver at a time. Here, asset turnover is identical at 1.25x, so efficiency in using assets is not what separates them.
Instead, the gap sits in the other two drivers. For instance, Company A is margin-led. It keeps 12 rupees of every 100 in sales as profit, and it uses little borrowed money.
Company B is leverage-led: it keeps only 4 rupees of every 100. However, it funds most of its assets with borrowed money, which lifts the ROE.
However, neither result is automatically good or bad, and this is not a view on any real company. The point is that the same 20% hides two different stories.
Also, this habit of reading drivers is a core step when you learn fundamental analysis on real companies.
Is Leverage-Led ROE Riskier?
Borrowed money comes with interest that has to be paid whether profits are high or low. Therefore, a leverage-led ROE is more sensitive to a bad year.
To test this, assume both companies pay 10% interest on their debt, with tax at 25%. Company A has debt of 200 and Company B has debt of 600, but equity stays unchanged.
Next, say operating profit (EBIT) falls by 20% in a weak year while interest stays fixed.
| Item | Company A | Company B |
|---|---|---|
| Debt (interest at 10%) | 200 (20) | 600 (60) |
| EBIT, normal year | 180.0 | 113.3 |
| EBIT, weak year (down 20%) | 144.0 | 90.7 |
| Net profit, weak year | 93.0 | 23.0 |
| ROE, weak year | 15.5% | 11.5% |
| Fall in ROE | 4.5 points | 8.5 points |
The formula behind this is net profit = (EBIT – interest) x (1 – tax rate). As a result, the same 20% fall in operating profit cut Company B’s ROE almost twice as much.
This is a hypothetical stress test, not a prediction. Still, it shows why looking at the drivers matters when two ROEs match.
If you want a mentor to review your own breakdowns, a guided fundamental analysis course with live classes can help.
ROE or DuPont Analysis: Which One to Use and When?
First, for a screen, ROE is a handy filter. Thus, it quickly shows which businesses earn decent returns on shareholder money.
Once a few names pass the filter, the breakdown becomes useful. Also, learning how to read financial statements step by step helps. Then, you can pull margin, assets and equity from the reports yourself.
However, ROE says nothing about price. A simple growth-based price check is explained in what is PEG ratio.
Here is when each tool tends to fit:
- Quick first screen of many companies: ROE
- Two companies with the same ROE: DuPont breakdown
- ROE jumped suddenly: DuPont breakdown
- Checking if borrowing is behind the return: DuPont breakdown
ROE, DuPont and Valuation: Where Price Fits In
Still, a high-quality ROE does not tell you whether the price is fair. Those are separate questions.
Investors who think about price and quality together often study margin of safety in value investing. Also, they pair it with ratios like ROE. It helps to see how value investing vs growth investing treat price and quality differently.
For example, a well-run business can still be a poor choice at the wrong price. Likewise, a weak-looking one is not always a bargain.
Limits of ROE and DuPont Analysis
Neither tool is a complete verdict on a company. Therefore, keep these limits in mind.
- Accounting differences: companies may record items differently, which can distort comparisons.
- Average vs year-end figures: averages smooth the numbers, but sources do not always follow the same method.
- Very small or negative equity: ROE can look huge or meaningless, and the breakdown stops being helpful.
- Banks and financial companies: they use borrowed money as a core part of the business, so they are read differently.
- One-off items: a single unusual gain can lift a year’s margin and ROE.
Past figures also do not guarantee future results. Besides, estimates can be wrong, and fundamentals are only one input in any decision.
Even valuation ratios can mislead, and is low PEG ratio good shows why.
Comparing Same-ROE Companies: Quick Checklist
Run through these quick questions each time. Also, the list is short on purpose, so it is easy to remember.
- Do both companies use the same accounting period and basis?
- Which of the three drivers differs the most?
- Is the equity multiplier unusually high for the industry?
- Has ROE risen because of profit, or because equity shrank?
- Does the trend hold across several years, not just one?
Looking across several years is important, because a single year can mislead. Meanwhile, quarterly results can move sentiment for a while. We cover this link in how quarterly results affect share prices.
Finally, ROE and DuPont say nothing about timing. So, many learners also learn technical analysis to read charts alongside the numbers.
Tired of seeing two companies with the same ROE and not knowing which one to trust?
Videos can explain the ratio, but real statements and a mentor’s answers teach you to read the drivers.
Join our live classes from your mobile, ask your doubts and learn step by step.
Conclusion
DuPont analysis is not the same as ROE. ROE gives the score, and DuPont shows what built it.
In short, two companies with equal ROE can differ sharply in margin, efficiency and borrowing. As a result, that difference often separates a steady business from a fragile one.
Disclaimer: This page is for education only and is not investment advice. All company figures are hypothetical, and past results do not guarantee future results.
We do not promise profits. So, please do your own research or speak to a registered adviser before investing.
Frequently Asked Questions
Before investing capital, invest your time in learning Stock Market.
Fill in the basic details below and a callback will be arranged for more information: