



A positional trading strategy has one job. It helps you catch a large part of a trend and hold through the small pullbacks along the way.
You do not need ten indicators for that. You need a clear trend, a defined entry, a stop loss you respect, and a rule for when to leave.
This guide is a positional trading strategy for beginners and for traders who want a simpler system.
What Is the Core Idea Behind a Positional Trading Strategy?
Buy a stock that is already trending up, holding it while the trend stays healthy. Exit your position once that trend breaks.
Most of your profit comes from a few trades that run for months.
Understanding the structural differences between positional trading vs day trading helps clarify why these longer holding periods generate asymmetric returns.
Most of your losses stay small because you cut them early.
That asymmetry is the whole strategy. Everything below protects it.
A Simple Step Positional Trading Plan
Before committing capital to any individual stock, you must align your trades with the broader market and sector trend.
This crucial first step ensures you only ride tailwinds rather than fighting the broader trend.
Step 1: Read the Market and Sector Before You Buy
Look at the weekly Nifty chart first. If the index sits above its rising 50-day and 200-day averages, conditions favour long trades.
Then check the stock’s sector. Strong sectors lift their best stocks.
If either check fails, trade smaller or wait.
Step 2: Pick Only the Cleanest Weekly Uptrends
Choose stocks that make higher highs and higher lows on the weekly chart. They should trade above both major moving averages.
Knowing how to select stocks for positional trading decides half your results.
We cover the full filtering process in our guide on choosing positional trading stocks.
Here, the rule is simple. Trade only the cleanest charts.
Step 3: Choose Between Two Proven Entry Setups
Beginners do best with two setups. Master these before you add anything else.
Setup A: Buy the Pullback to the 50-Day Average
In a strong uptrend, price often pulls back to the 50-day moving average and turns up again.
Wait for a bullish weekly or daily candle at that zone. Buy above its high.
Place your stop below the pullback low.
Setup B: Buy the Breakout From a Tight Base
Sometimes a stock rests in a tight range for several weeks. Then it closes above the top of that range on high volume.
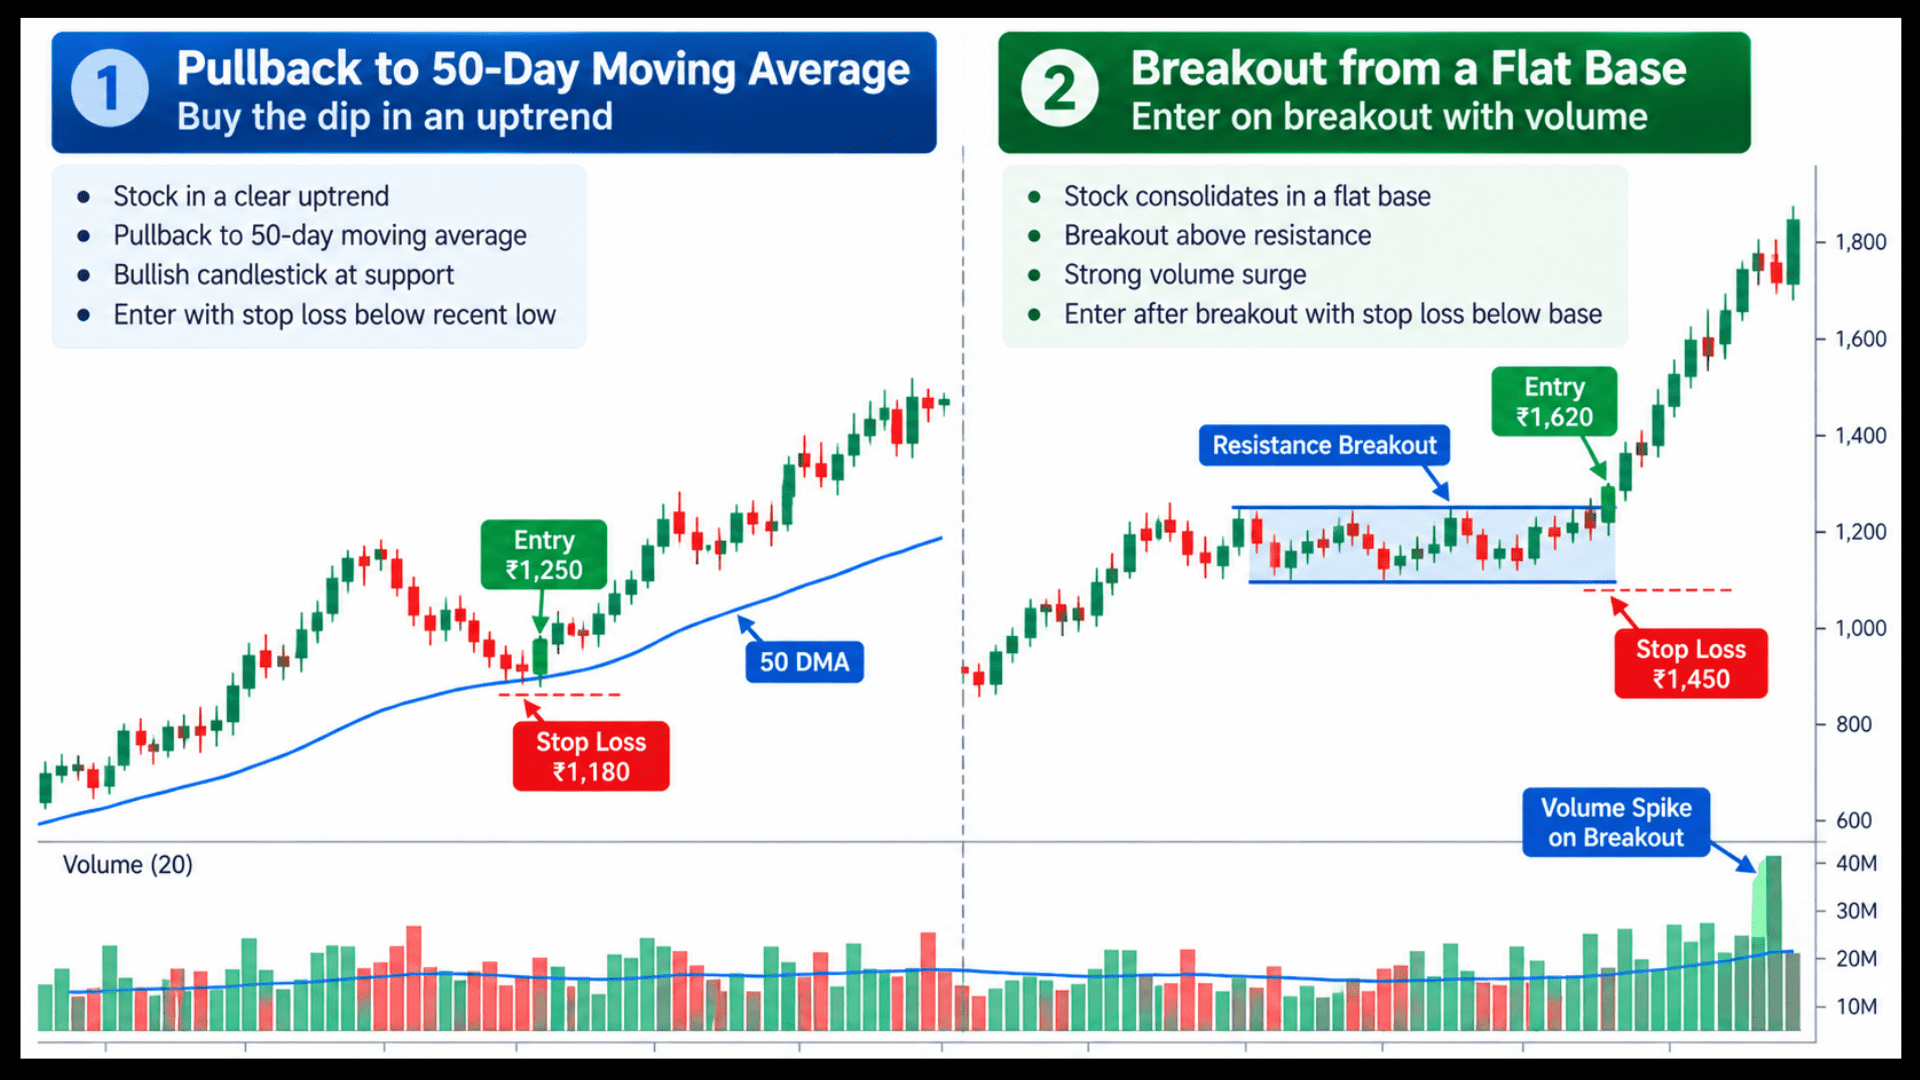
Buy the breakout close, or the retest that follows it. Place your stop below the base.
The volume matters. A breakout on thin volume fails far more often.
Step 4: Fix Your Stop Loss Before You Enter
Decide the stop before you enter. Positional stops sit wider than swing stops because the trade runs longer.
Put the stop below the last meaningful swing low, or below the base.
If that distance feels too large, reduce your position size. Do not tighten the stop into the noise.
Risk about 1% of your capital per trade. Divide that amount by your stop distance to get the number of shares.
Step 5: Let Winners Run With a Trailing Exit
Do not set one fixed target and walk away. Let the winner run.
Two simple exits work well:
- Trailing stop: move your stop up below each new weekly swing low.
- Moving average exit: leave when the weekly close falls below the 20-week or 50-day average.
Pick one before you enter. Do not switch halfway through.
A Worked Example: How One Winning Trade Covers Two Losers
These figures are illustrative and are not a recommendation.
A capital goods stock trades at ₹2,100 in a steady weekly uptrend.
It pulls back to ₹2,010, near its rising 50-day average, and prints a bullish weekly candle with a high of ₹2,040.
You buy at ₹2,045. Your stop goes at ₹1,960, below the pullback low. That is ₹85 of risk per share.
The stock climbs for three months and reaches ₹2,480. You trail your stop up beneath each weekly swing low.
A weekly close below the trailing stop takes you out near ₹2,400.
The gain is ₹355 per share on ₹85 of risk, about 4.2 times your risk.
Earlier, two similar trades hit their stops for small losses. This one paid for both.
Can Indicators Like MACD Make the Strategy Stronger?
You can add one momentum tool for extra confirmation. Weekly MACD is a common choice.
Positional trading with MACD works best when price structure still leads the decision.
We explain the exact setup in our post on positional trading with MACD. Use it as a filter, not as a replacement for price structure.
More indicators rarely improve results. They mostly delay your decisions.
Positional vs. Swing Trading: What Is the Real Difference?
Both styles follow similar rules, but the holding period sets them apart.
For anyone asking what positional trading is compared to shorter-term methods, the answer comes down to time.
Positional trades run for weeks or months, rely on weekly charts, and need wider stop-losses to handle bigger price swings.
Swing trades last from a few days to a few weeks and are planned on daily charts.
Traders weighing positional trading vs long Term investing often look at chart structures across weekly versus monthly timeframes to determine how long their capital will remain locked.
Shorter holds mean tighter stops and capital that is freed up faster for the next trade.
How Much Capital Should You Risk on a Positional Trade?
Position sizing protects you when the strategy has a bad stretch. Every strategy has one.
Choose your risk per trade, usually about 1% of your capital. Divide that amount by the distance from entry to stop.
On a ₹4,00,000 account, 1% is ₹4,000. With a ₹85 stop distance, you can buy about 47 shares.
Keep the total risk across all open positions below about 6%. That caps your worst realistic week.
Stuck in a Sideways Trade? Here Is Your Exit Plan
Some trades neither hit the stop nor move. Price drifts for weeks and ties up your capital.
Set a review point when you enter, such as six to eight weeks.
If the stock has not made progress by then, ask whether the original reason still holds.
Often the right move is to exit and use the money on a cleaner setup. Capital has a cost, even when the trade shows no loss.
How to Manage Positional Trades in Just One Hour a Week
Positional trading does not need daily attention. A short weekly routine works.
Positional trading thrives on patience rather than constant screen time, making a structured weekly routine all you need to stay on track
. By batching your analysis into specific windows, you remove emotional decision-making and protect your time.
- Weekend: review the weekly charts of your open positions and your watchlist.
- Weekend: update trailing stops below the latest weekly swing lows.
- Weekday evening: place orders for any setup that has confirmed.
- Monthly: rebuild your watchlist and review your trade journal.
The whole routine takes an hour or two. That is why working professionals often choose this style.
3 Common Mistakes That Can Ruin Your Positional Trading Strategy
Even the most well-designed positional trading plan can fail if execution habits go unchecked.
Guarding against a few hidden pitfalls makes all the difference between capturing a major trend and cutting your gains short.
Mistake 1: Booking Profits Too Early
The most common mistake is exiting too early. A trader sees a 15% gain and books it, missing a 50% move.
Mistake 2: Holding Without a Stop Loss
The second is skipping the stop loss on a long hold. A stock can fall a long way while you wait for it to recover.
Mistake 3: Ignoring Event Risk
The third is ignoring event risk. Results dates and policy days can gap a stock against you overnight.
Can You Run This Strategy With Options?
You can express a positional view with futures or options. That adds leverage and time decay, so it needs its own risk rules.
Many modern quants and retail investors now apply positional trading with ai algorithms to handle the complex computations required for multi-leg option pricing and risk monitoring.
Want to Practise This Strategy With Live Guidance?
Reading a strategy is one thing. Holding a trade through a scary pullback is another.
Our Best positional trading classes teach this method live, on real charts, so you can build that discipline with support.
Conclusion
A positional trading strategy works because it keeps things simple. Trade only when the market and sector support you.
Pick clean weekly uptrends and enter through a pullback or a base breakout.
Set your stop before you buy and risk about 1% per trade. Then let the trend decide your exit with a trailing stop or a moving average rule.
Small losses are part of the plan, and one strong trend can pay for several of them.
Follow the weekly routine, respect your rules, and give each trade time to work.
Frequently Asked Questions
Before investing capital, invest your time in learning Stock Market.
Fill in the basic details below and a callback will be arranged for more information: