



Positional trading with MACD works because the indicator is slow on purpose. On a weekly chart, it filters out the daily noise and shows you when a trend is gaining or losing strength.
That suits a trade you plan to hold for weeks or months. You do not need to react to every candle.
If you are wondering how to select stocks for a positional trading strategy, this guide covers everything you need: the settings, the entry rules, the stop loss, and the exit signals.
Why Is MACD Made for Positional Trading?
MACD measures the gap between a fast and a slow moving average. When the gap widens, momentum builds. When it narrows, momentum fades.
On a weekly chart, each candle covers five sessions. That makes the signals rarer and steadier.
You get fewer trades. Each one has more room to run.
Best MACD Settings for Weekly Charts: Why Default Settings Win
Keep the default 12, 26, 9 setting. Most traders use it, so many of them react to the same levels.
Use the weekly chart to read the trend and the signal. Use the daily chart only to fine-tune your entry price.
Changing the settings rarely adds an edge. It usually adds curve-fitting.
The Weekly MACD Strategy
This setup tests the first quality: a steady trend. Before you look for signals or chart patterns, check where the MACD line sits against the zero line on the weekly chart.
Above zero means buyers are in control. Below zero means momentum is weak, and breakouts there often fail.
Once this filter is in place, selecting the right stocks for positional trades becomes much simpler.
Follow these exact steps to execute the setup cleanly:
Step 1: Check the Zero Line Before Anything Else
Check where the MACD line sits relative to zero on the weekly chart.
Above zero, the faster average sits above the slower one. That is your green light for long trades.
Below zero, stay out or trade smaller. The broader trend is weak.
Step 2: Wait for a Crossover Near Zero
Look for the MACD line to cross above its signal line. The best crossovers happen close to or just above the zero line.
A crossover far above zero often means the move is already stretched. Late entries there tend to disappoint.
Step 3: Let Price and Volume Prove the Signal
The crossover should match a real price event. Look for a break above a recent swing high or a base.
Rising volume on that week adds weight. A crossover on thin volume deserves suspicion.
Step 4: Lock In Your Entry, Stop Loss and Exit
Here is the full rule set:
- Entry: buy above the high of the confirming weekly candle, or on the next session’s open.
- Stop loss: place it below the low of the last weekly swing.
- Exit: leave when the MACD line crosses back below the signal line, or when price closes below your stop.
Size the position from the stop distance, not from how confident you feel.
Case Study: How to Play the Breakout and Exit Cleanly?
These prices are illustrative and are not a recommendation.
Suppose a large private bank stock has traded sideways near ₹1,500 for two months. Its weekly MACD line has moved up toward zero.
One week, the stock closes at ₹1,560, above the range. On the same candle, the MACD line crosses above its signal line just over zero.
Volume runs well above average.
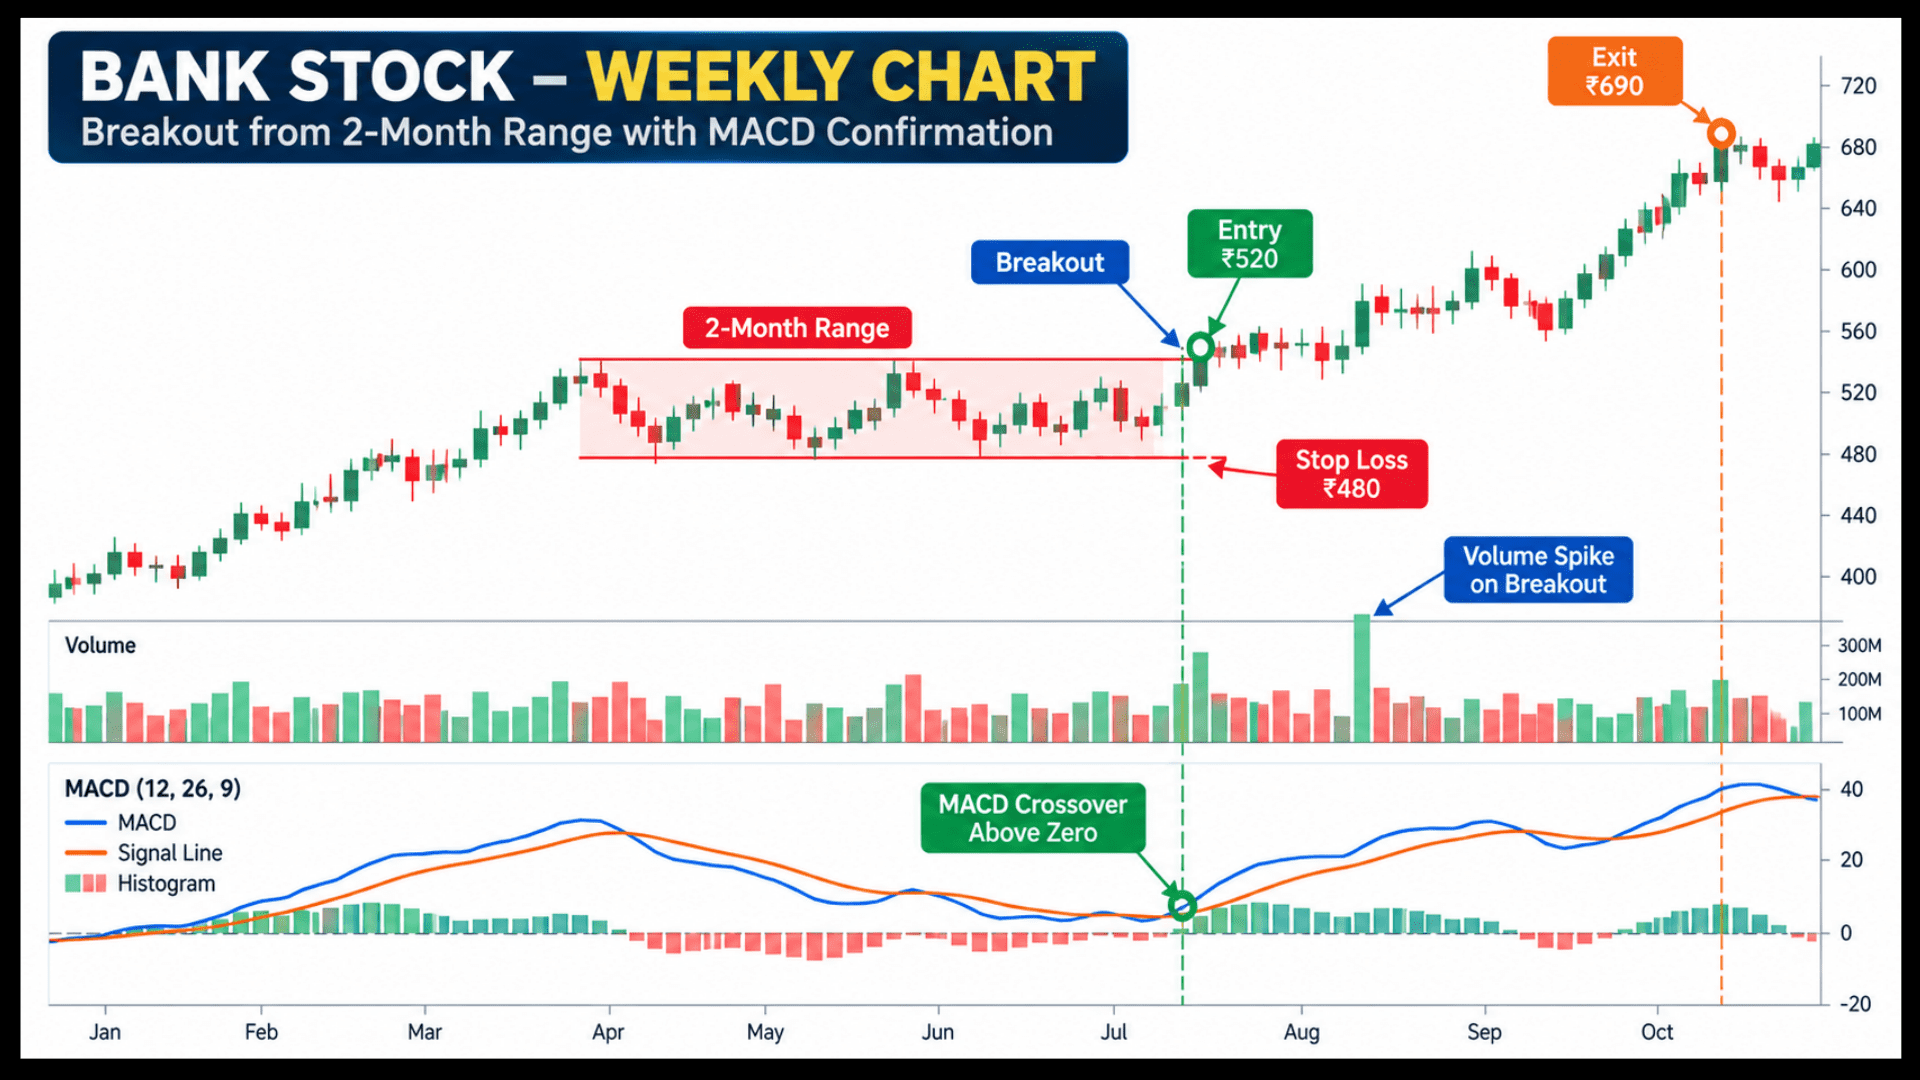
You buy at ₹1,565 with a stop at ₹1,480. That is ₹85 of risk per share.
Over the next four months, the stock climbs to ₹1,790. The MACD then crosses below its signal line, and you exit near ₹1,760.
The gain is ₹195 per share against ₹85 of risk, roughly 2.3 times your risk.
How to Use Weekly MACD Divergence to Exit Trades Earlier?
Divergence is your early warning. If price makes a new high but MACD makes a lower high, momentum is fading.
You do not have to exit the moment you see it. Tighten your stop instead, and watch for the signal line crossover to confirm.
Bullish divergence works the other way. Price makes a lower low while MACD makes a higher low.
That can mark the end of a long pullback.
Swing vs. Positional MACD: How Timeframes Change the Rules
The logic is the same, but the pace is not. A swing trader reads daily charts and holds for days to a few weeks.
A positional trader reads weekly charts and holds for weeks to months.
Adopting what is positional trading means committing to these broader weekly horizons rather than chasing quick daily price fluctuations.
Stops sit wider, so positions run smaller.
If you want the shorter-hold version, read our breakdown of MACD swing setups.
Where Positional Trading with MACD Falls Short?
MACD lags because it uses moving averages. You will rarely catch the first week of a move.
It also whipsaws in sideways markets. The lines cross back and forth with no real trend behind them.
A MACD zero-line cross is the same as a moving average crossover. So the fix is the same too: add structure.
Require a breakout, a rising trend, and volume before you act.
If you also use moving averages, see how to compare EMA period choices before layering both.
When Positional Trading with MACD Fails: A Real Example
Not every crossover works. Suppose a metal stock crosses up on the weekly MACD, but volume stays flat and price barely clears the old high.
You still take the trade because the rules were met. The stock stalls, slips back into its range, and closes below your stop three weeks later.
That is a normal loss. You risked a fixed amount, and you took it.
The next trade does not care about this one.
The lesson is not to abandon the setup. It is to check volume and structure every time, and to keep your loss small when they disappoint.
How Many Shares Should a Weekly MACD Trade Get?
Weekly stops sit wide, so position size does the risk control. This is one of the practical gaps in swing trading vs positional trading.
Do not use a fixed share count.
Decide how much you will risk, usually about 1% of your capital.
Divide that by the distance from entry to stop.
In the earlier example, the stop was ₹85 away. On a ₹3,00,000 account risking 1%, that is ₹3,000.
Dividing gives roughly 35 shares.
A wider stop means fewer shares. Never widen the stop and keep the same share count.
The 2-Minute MACD Checklist: How to Filter Out Bad Trades?
Even with a solid weekly setup, jumping into a trade without a final confirmation leads to costly mistakes.
This fast pre-trade audit acts as your ultimate defense mechanism, ensuring you only risk capital on high-probability setups that meet every technical rule.
Run through these quick checks to protect your trading account before clicking buy:
- Is the MACD line above or near zero on the weekly chart?
- Did the crossover happen with a real price breakout?
- Was volume above average on that candle?
- Is the broader market trend supportive?
- Do you know your stop and your exit before you buy?
If any answer is no, wait for the next setup.
Want to See a Weekly MACD Signal Confirmed on a Live Chart?
Reading a crossover after the fact is easy. Judging one while the candle is still forming is the hard part.
Our positional trading classes online walk through setups like this live, on real Indian stocks.
Conclusion
Positional trading with MACD rewards patience more than prediction.
Integrating positional trading with ai workflows can further assist market participants in maintaining objective discipline over these multi-week horizons.
Read the zero line first, wait for a crossover near it, and act only when price and volume confirm the move.
Size every position from the stop distance, not from conviction. Use divergence as an early warning, and let the signal line crossover decide your exit.
Some trades will fail, and that is fine when the loss is fixed in advance.
Accepting predetermined risks without emotional attachment is essential whether you are navigating short-term setups or exploring positional trading vs long term investing principles for your broader portfolio.
Run the checklist before each entry, stick to the weekly chart, and let the trend do the heavy lifting over weeks and months.
Frequently Asked Question
Before investing capital, invest your time in learning Stock Market.
Fill in the basic details below and a callback will be arranged for more information: