



Two lines crossing on a chart. That is all a golden cross really is when mastering positional trading with moving averages.
But traders have watched it for decades because it tends to mark the start of a real, lasting trend.
Positional trading with moving averages builds around this one simple crossover.
This guide covers what it is, how to trade it, and where it can go wrong.
What Is a Golden Cross in Positional Trading with Moving Averages?
A golden cross happens when the 50-day moving average crosses above the 200-day moving average.
It signals that recent price action has turned stronger than the longer-term trend.
The opposite is a death cross. The 50-day average crosses below the 200-day average.
Determining the best timeframe for positional trading helps market participants filter out intraday noise and focus purely on macro trends like these major moving average crossovers.
It signals the reverse, weakening momentum inside a longer downtrend.
Traders must also factor in operational costs, such as the applicable positional trading tax in India, when calculating their net returns over a multi-month holding period.
Both work the same way. Only the direction changes.
It is one of several tools worth knowing alongside a broader positional trading strategy.
What Makes the Golden Cross a Favorite for Big Traders?
The 200-day average is slow. It smooths out months of noise into one steady line.
When a faster average crosses above it, that is not a random wiggle.
It usually means real buying has shown up over weeks, not just one good day.
That is why institutions watch this crossover too.
It tends to attract more buying once it appears, which can extend the move further.
How to Master Positional Trading with Moving Averages?
This setup is simple by design. Do not overload it with extra indicators.
The five steps below take you from spotting the cross to exiting the trade, in the order you should check them.
Step 1: Confirm the Crossover on the Daily Chart
Watch for the 50-day average moving above the 200-day average.
Use the daily chart for the clearest signal, since the weekly chart can lag by many sessions.
Step 2: Check That Price Sits Above Both Averages
The crossover means little if price itself is still below both lines.
Confirm price is trading above the 50 and the 200 day average before you act.
Step 3: Wait for Volume to Back the Move
A genuine golden cross usually shows rising volume around the crossover.
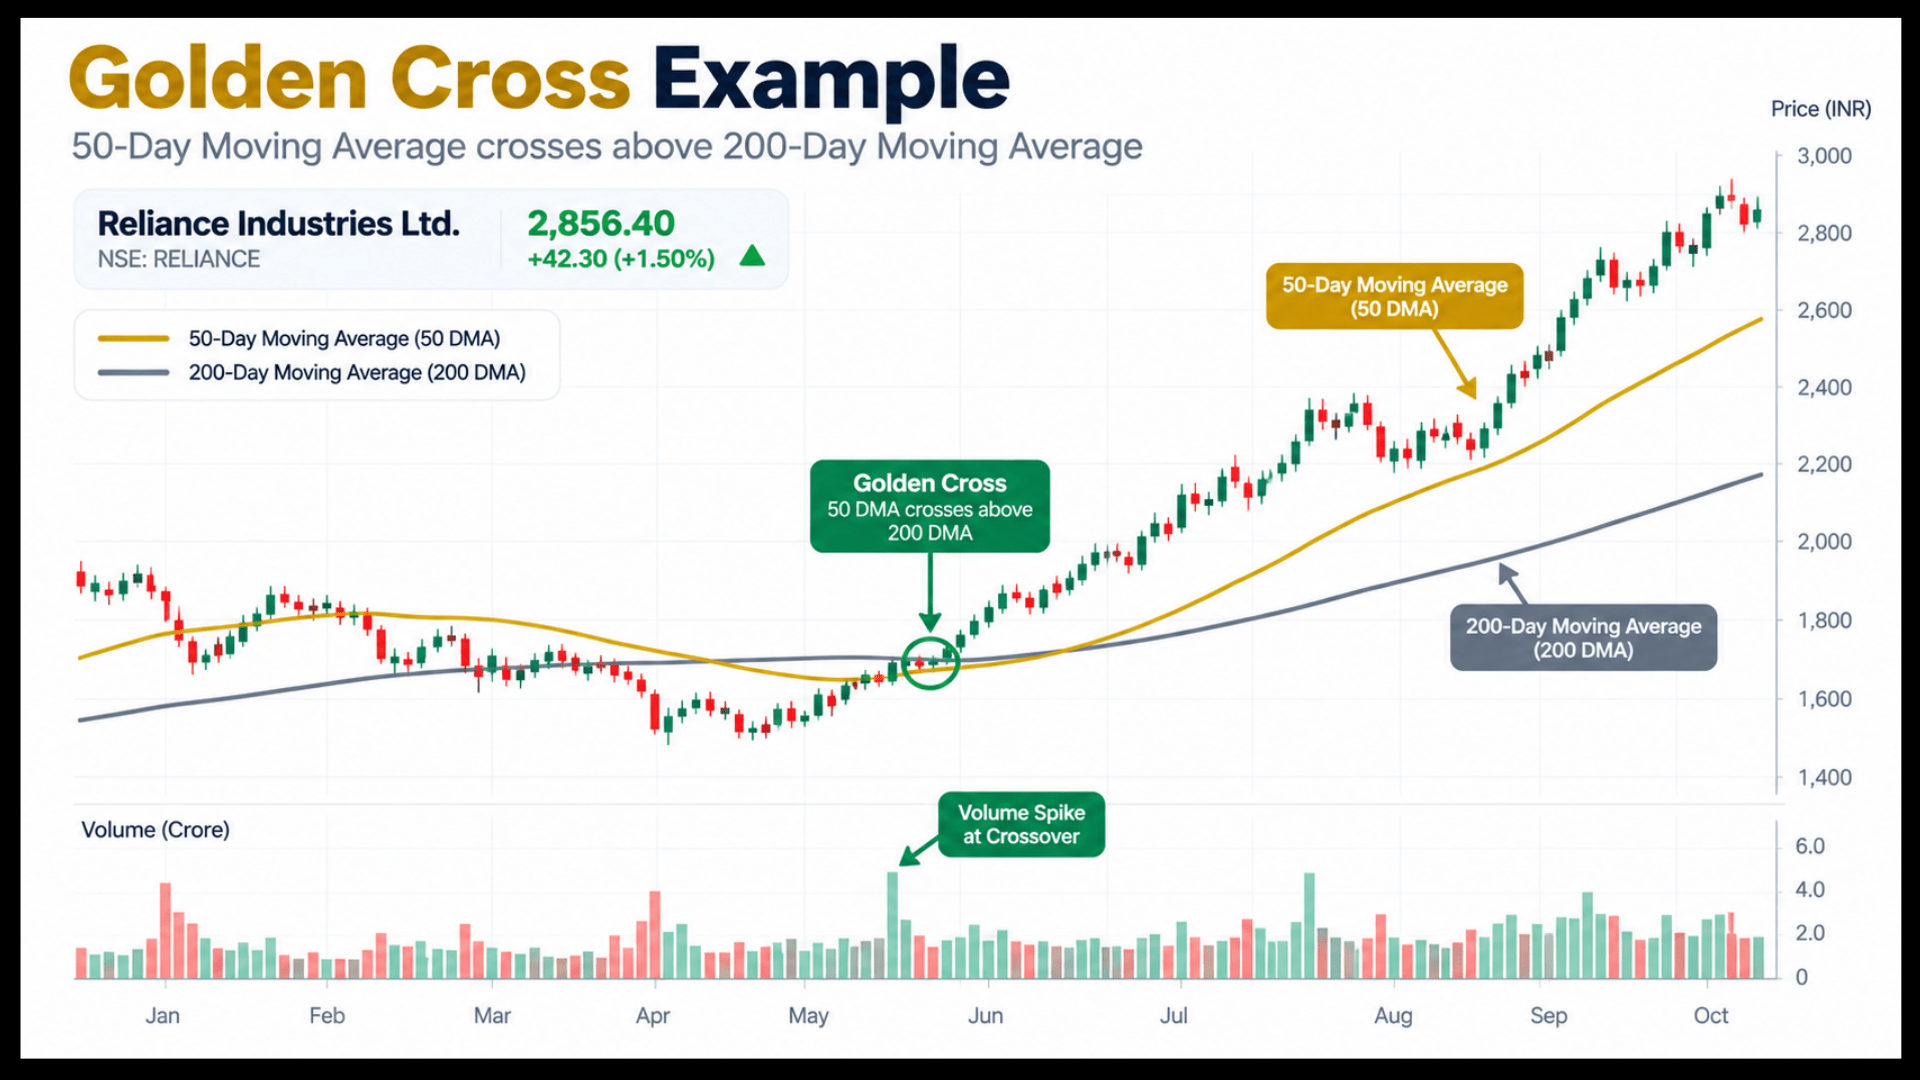
Thin volume is a weak signal and often fails.
Step 4: Enter and Set Your Stop
Buy once price confirms above both averages after the cross.
Place your stop below the most recent swing low, or below the 50 day average itself.
Step 5: Exit When the Averages Cross Back
Hold the position while the 50 day average stays above the 200 day average.
Exit, or tighten your stop hard, once a death cross forms.
A Practical Look at Positional Trading with Moving Averages
These figures are illustrative and are not a recommendation.
A large private bank has been trading below its 200 day average for months.
Its 50 day average finally turns up and crosses above the 200 day average, at a price near ₹1,480.
Volume picks up on the crossover week. You buy at ₹1,510, once price confirms above both averages.
Your stop sits at ₹1,420, below the recent swing low.
Over the next five months, the stock climbs to ₹1,850. No death cross has formed.
You are still holding, with your stop trailing higher beneath each new swing low.
Golden Cross vs. Weekly MACD
Neither one is better on its own. They measure different things.
The golden cross confirms a longer-term shift between two averages.
Our post on positional trading with MACD covers a faster momentum signal, built for catching a trend earlier.
Some traders use both together.
A golden cross confirms the big picture. A MACD crossover times the actual entry within it.
Where Does the Golden Cross Fit in Stock Selection?
A golden cross works best on a stock that already passes a proper screen.
Our guide on how to select stocks for positional trading in India already checks that price sits above the 50 and 200 day averages.
So a fresh golden cross on a shortlisted stock is a strong signal, not a random one.
Do not chase a golden cross on a stock you have not screened first. The crossover alone is not enough.
Limitations of Positional Trading with Moving Averages
The biggest weakness is timing. Since both averages are slow, the cross often happens well after the real bottom.
You will rarely catch the first leg of a move with this setup.
You are trading confirmation, not prediction.
Some traders now use positional trading with AI tools to scan large watchlists for crossovers, though each signal still needs your own confirmation.
It also whipsaws in a choppy, sideways market.
The averages cross back and forth with no real trend behind either signal.
Skip this setup entirely when a stock has no clear direction.
If you are still getting comfortable with the basics, our guide on what positional trading is a good place to start before adding a signal like this one.
Want to See a Golden Cross Confirmed on a Live Chart?
Spotting a crossover on a finished chart is easy.Judging one while it is still forming takes real practice.
Our positional trading classes in India walk through setups like this live, on real Indian stocks.
Conclusion
A golden cross is not a magic signal. It is a slow, steady confirmation that a real shift in trend has already happened.
It is not a guess about what comes next.
Positional trading with moving averages works best on stocks you have already screened.
Confirm the crossover with rising volume and keep a clear stop below the swing low.
Then let the trend run until the 50-day average crosses back below the 200-day average.
That patience, more than the signal itself, is the whole edge here.
Frequently Asked Questions
Before investing capital, invest your time in learning Stock Market.
Fill in the basic details below and a callback will be arranged for more information: