



New traders often ask the same question first. Which chart should I actually look at?
The best timeframe for positional trading is not one single answer. It depends on what decision you are trying to make.
This guide breaks that down clearly, so you stop switching timeframes at random.
Why Choosing the Best Timeframe for Positional Trading Matters
A chart looks completely different depending on the timeframe you view it on.
A stock can look like a strong uptrend on the weekly chart and a messy chop on the daily chart, at the exact same moment.
If you are still wondering what positional trading is, it simply means holding trades for weeks or months.
Your main timeframe needs to match that horizon, not the shorter horizon a day trader would use.
Weekly or Daily? Choosing the Best Timeframe for Positional Trading
Both charts have a place in your routine, but they do very different jobs.
The next two sections show why the weekly chart leads every decision, and where the daily chart quietly earns its spot.
Why Is the Weekly Chart the Best Timeframe for Positional Trading?
The weekly chart compresses five trading days into one candle.
That filters out most of the daily noise that means nothing over a multi-month hold.
It shows you the real trend clearly. Higher highs and higher lows on a weekly chart carry far more weight than on a 15-minute chart.
Most of your core decisions belong here. Trend direction, major support and resistance, and signals like positional trading with moving averages are all read on the weekly chart first.
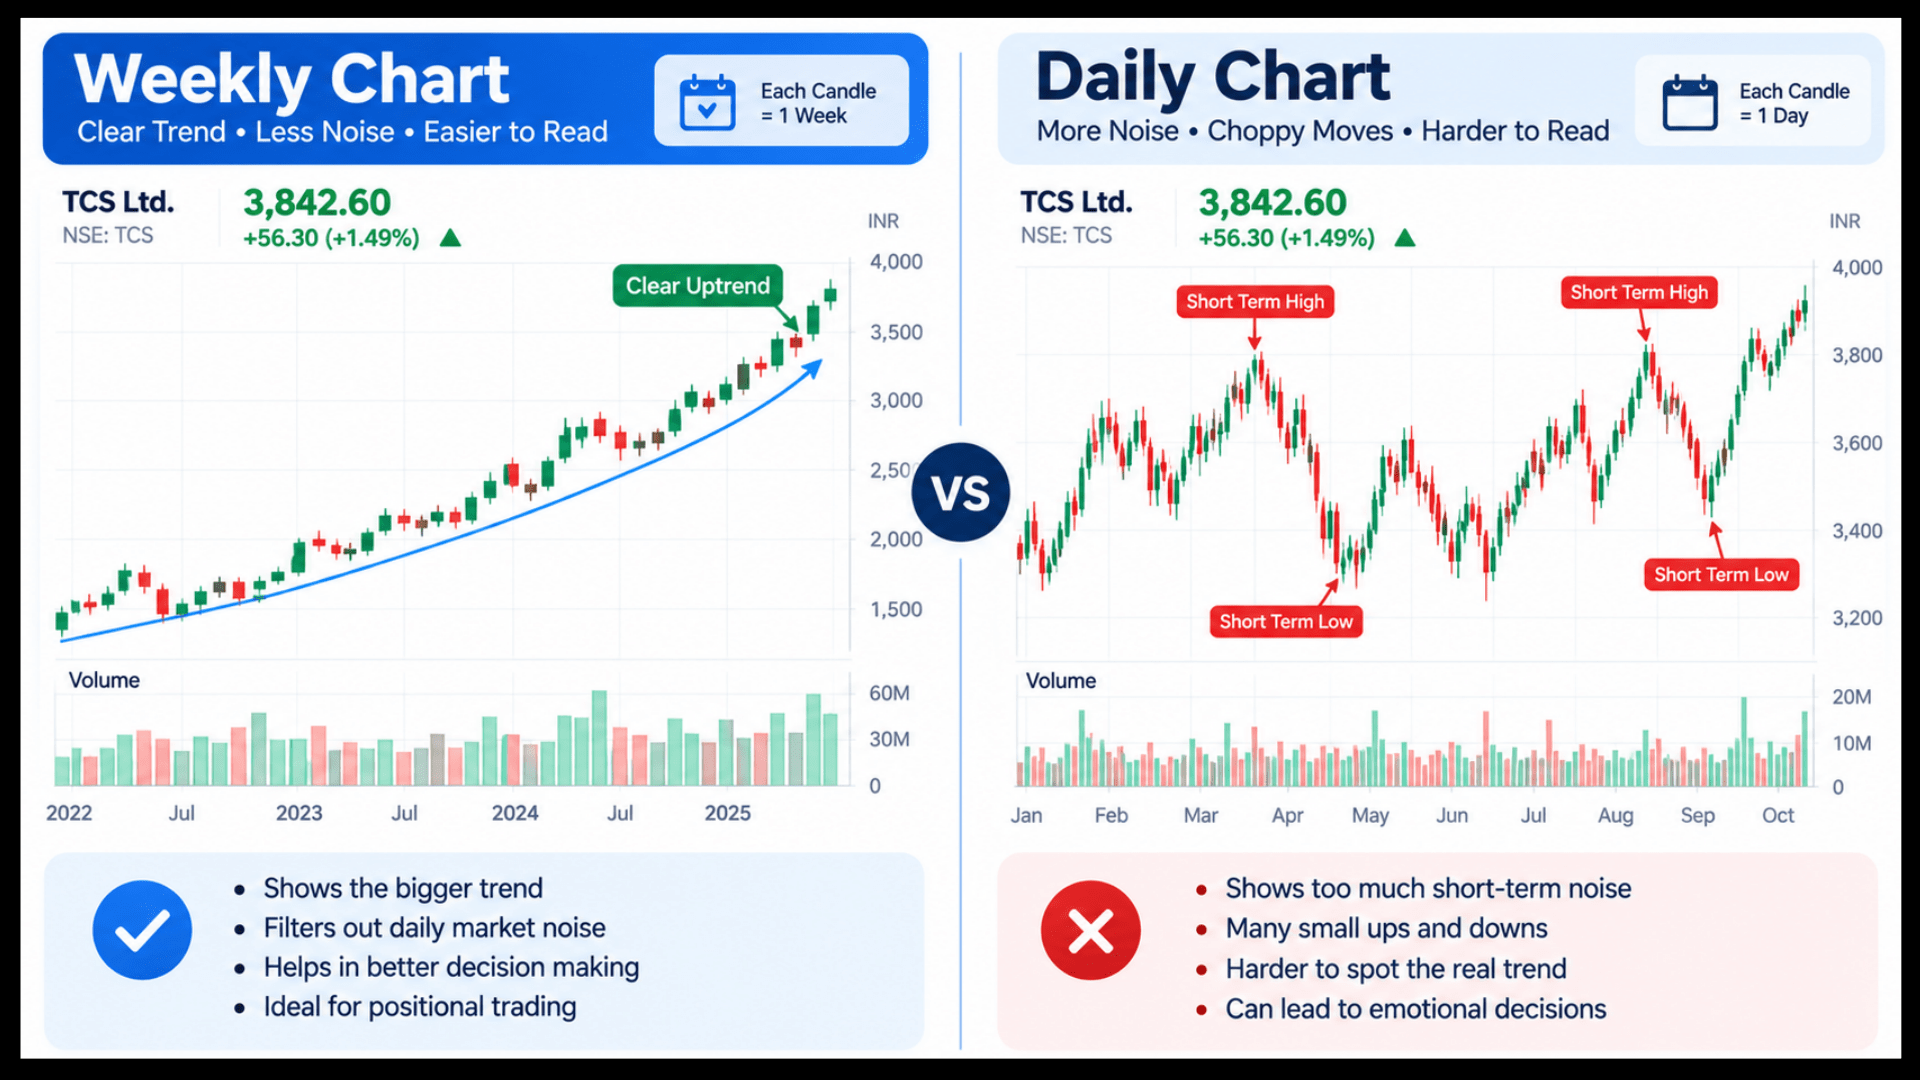
The same weekly view is what a proper positional trading strategy is built around, whether you trade a pullback or a base breakout.
When Does the Daily Chart Actually Help?
The daily chart is not useless here. It has one specific job.
Timing your entry more precisely once the weekly chart has already confirmed a setup.
Say the weekly chart shows a stock pulling back toward a rising 50-day average.
The daily chart can show you the exact candle where buyers step back in, rather than guessing the entry a week too early or too late.
Use the daily chart for entries. Use the weekly chart for the decision to be in the trade at all.
Why Shorter Intraday Charts Fail as the Best Timeframe for Positional Trading
Skip these shorter charts for positional decisions. A 15-minute chart is built for day trading, where every session closes the same day.
Reading it for a trade you plan to hold for months adds noise, not clarity.
It tempts you into reacting to moves that mean nothing over your actual holding period.
If short timeframes interest you, our comparison of positional trading vs day trading covers how the pace and the charts differ completely.
How Do You Combine Weekly and Daily Charts Without Confusion?
Keep the roles separate in your own head. The weekly chart answers one question: is this trend worth being in?
The daily chart answers a different one: where exactly do I enter today?
Checking the daily chart before confirming the weekly trend gets the order backwards.
It leads to entries that look fine on a short view and terrible on the real one.
This weekly-first logic also applies when you learn how to select stocks for positional trading in India, since those criteria put the stock on your watchlist.
Weekly vs. Daily Chart Comparison with Example
These figures are illustrative and are not a recommendation.
The weekly chart of a capital goods stock shows a clean uptrend, price above a rising 50 week average, with a pullback forming toward it.
You switch to the daily chart only once that weekly setup is confirmed.
There, you spot a bullish reversal candle at ₹2,040, right at the average.
You buy above that candle’s high, with your stop below its low.
The weekly chart told you this trade was worth taking. The daily chart told you exactly when.
Does the Best Timeframe for Positional Trading Shift With Your Strategy?
Slightly, yes. If you apply positional trading with MACD, read that signal on the weekly chart too.
It filters out noise a faster timeframe would not.
The same goes for positional trading with AI. An AI screener can shortlist setups quickly, but confirm them on the weekly chart before acting.
Keep one rule constant across every method. The primary decision always lives on the weekly chart.
Struggling to Read Both Timeframes Correctly?
Knowing which chart to check is only half the skill. Reading it correctly under real market conditions takes practice.
Our positional trading classes online cover exactly this, live, on real Indian stocks.
Conclusion
The best timeframe for positional trading is the weekly chart, because it carries the real decision.
It shows the trend clearly and keeps you from reacting to noise that will not matter in a month while planning around positional trading tax in India.
It shows the trend clearly and keeps you from reacting to noise that will not matter in a month.
The daily chart still has a job: fine-tuning your entry once the weekly picture already says yes.
Shorter charts like 15-minute views belong to day traders, not to trades held for months.
Keep these roles separate, follow the weekly-first order every time, and picking a timeframe stops being a guessing game.
Frequently Asked Questions
Before investing capital, invest your time in learning Stock Market.
Fill in the basic details below and a callback will be arranged for more information: