



Mastering a reliable swing trading strategy using RSI can completely transform how you approach multi-day market trends.
Rather than guessing tops and bottoms, this approach uses the relative strength index as a precise timing tool inside an established trend, helping you catch high-probability entry points and manage risk effectively.
RSI is probably the single most recognisable indicator in trading, and also one of the most misused.
Most beginners think “RSI under 30 means buy” and stop there.
Anyone exploring what swing trading is quickly learns that relying on a single indicator without proper context often leads to catching falling knives during deep market pullbacks.
A proper swing trading strategy using RSI goes a step further. It uses RSI as a timing tool inside a trend rather than a standalone buy signal.
If you are still building your base, any swing trading strategy for beginners should start with this trend-first rule.
This post covers the specific RSI setup that swing traders actually rely on.
It also covers the settings that matter for a multi-day holding period rather than intraday scalps.
What Is RSI Really Telling You?
RSI (Relative Strength Index) measures the speed and size of recent price moves on a scale of 0 to 100.
Above 70 is generally read as overbought. Below 30 is generally read as oversold.
For a refresher on reading basic RSI indicator buy and sell signals, see our dedicated guide. This post focuses on the swing application.
For swing trading specifically, the 14-period RSI on the daily chart is the standard.
Applying a structured approach like swing trading with technical analysis helps traders combine this momentum indicator with broader chart patterns.
It is slow enough to filter out daily noise but responsive enough to catch multi-day swings.
The RSI Pullback Setup Swing Traders Actually Trust
The mistake most beginners make is buying the moment RSI touches 30, regardless of context.
In a genuine downtrend, RSI can stay below 30 for a long stretch while price keeps falling.
Applying a disciplined swing trading strategy in bear market conditions requires focusing on short-lived relief rallies rather than traditional oversold bounces.
That is not a bounce setup. That is a falling knife.
The setup that actually works is different: RSI oversold within an established uptrend, not RSI oversold in isolation.
The 5-Step Entry and Exit Plan
Step 1: Confirm the stock is in an uptrend on the daily chart. Look for higher highs, higher lows, or price above a rising 50-day moving average.
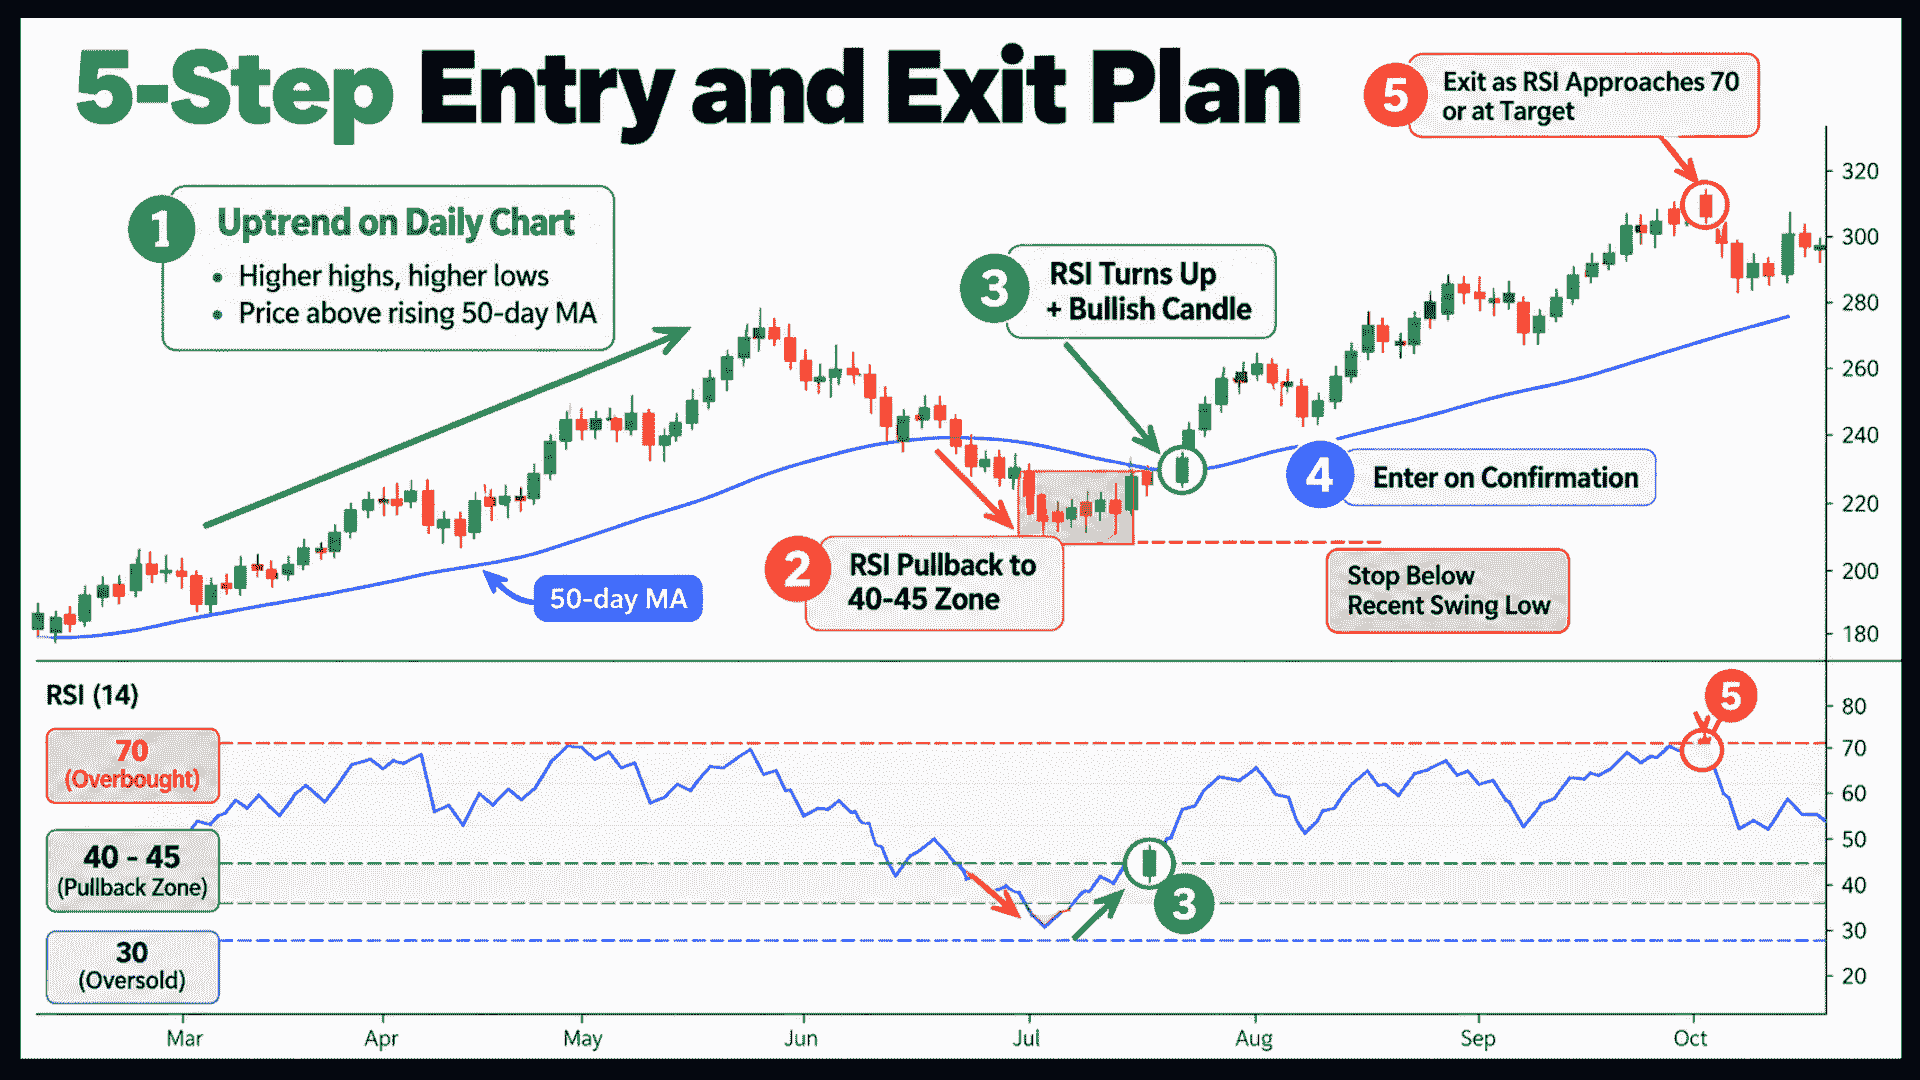
Step 2: Wait for RSI to pull back toward 40 to 45, not necessarily all the way to 30.
In a strong uptrend, RSI rarely drops to deeply oversold levels. A dip toward the mid-40s is often the equivalent pullback.
Step 3: Look for RSI to turn back up from that zone, ideally alongside a bullish reversal candle on price.
Step 4: Enter on confirmation of the turn, with your stop below the recent swing low.
Step 5: Exit as RSI approaches 70 (overbought territory) or at your predetermined price target.
Worked Example: How Did HDFC Bank Deliver a Clean 1:2 Trade?
Suppose HDFC Bank is in a clear uptrend, trading above its rising 50-day moving average.
RSI has been cycling between 45 and 68 over the past two months.
The stock pulls back for four sessions and RSI dips to 44.
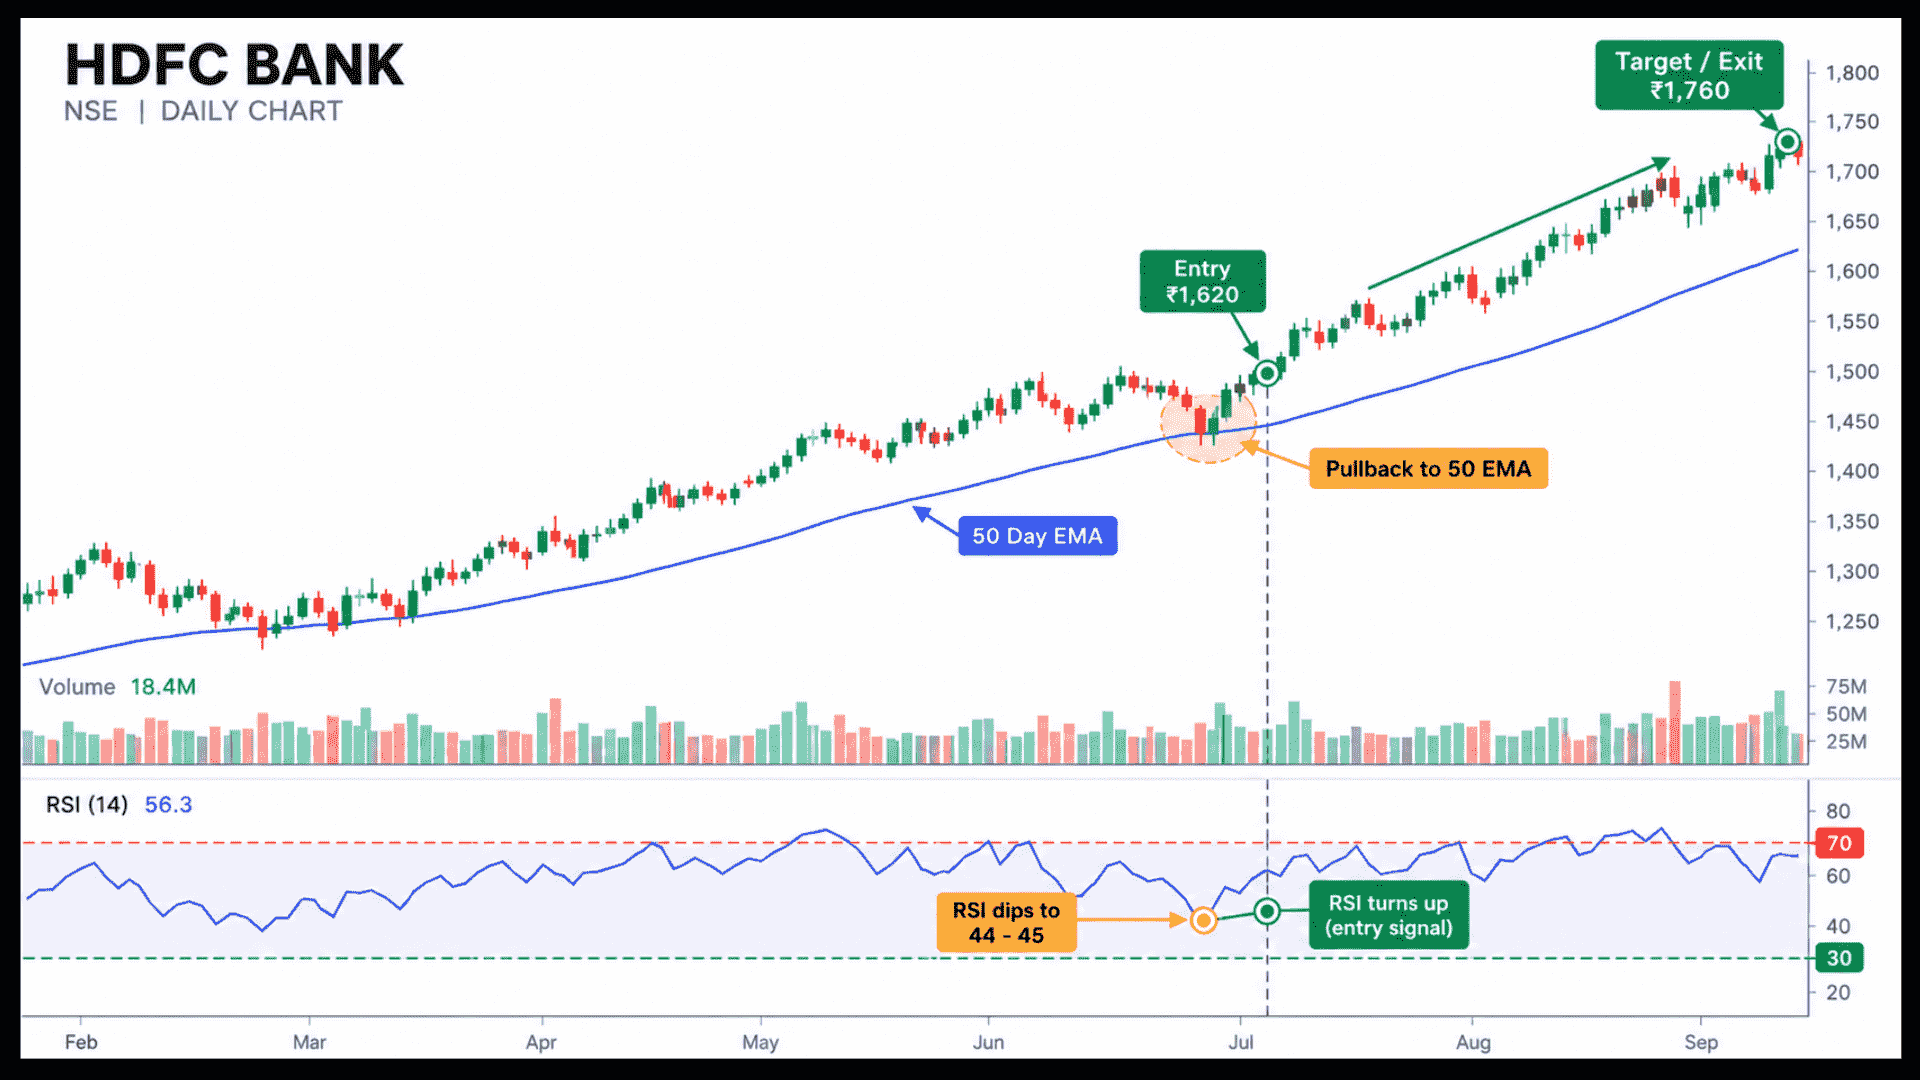
Then RSI turns up alongside a bullish candle as price holds above ₹1,620.
You enter at ₹1,625 with a stop at ₹1,595.
Over the following ten sessions, the stock climbs to ₹1,690, with RSI approaching 68.
You exit there rather than waiting for a full reversal.
That books roughly ₹65 per share against a risk of ₹30, a clean 1:2 risk-to-reward.
RSI Divergence: Can It Warn You Before the Swing Tops Out?
Beyond the basic pullback setup, RSI divergence is worth watching closely once you are already in a trade.
If price makes a new high but RSI makes a lower high than its previous peak, that is bearish divergence.
It often precedes a swing high forming, even while price still looks strong on the surface.
The reverse is also true. If price makes a new low but RSI makes a higher low, that is bullish divergence.
This often marks the tail end of a pullback before a bounce.
Why Do Smart Swing Traders Pair RSI with MACD?
RSI is excellent for timing but weaker at confirming overall trend direction. That is exactly where MACD helps.
Use MACD to confirm the broader momentum is still positive. Then use RSI to time the specific pullback entry within it.
Many swing traders lean on this combination.
If you have not already, our post on swing trading strategy using MACD covers that side of the pairing in detail.
Where Does This Setup Break Down?
RSI pullback setups struggle in strongly trending markets that barely pull back at all.
RSI can stay in the 60 to 70 range for weeks without ever offering a clean entry.
Chasing a late entry here usually means buying right before a real pullback finally arrives.
Many traders avoid this trap by combining momentum oscillators with structural tools like swing trading with Fibonacci retracements to map out high-probability support levels.
It also struggles in choppy, range-bound stocks.
There, RSI oscillates rapidly between overbought and oversold without any real directional follow-through.
Worked Example 2: What If RSI Refuses to Pull Back?
Not every uptrend gives you a clean pullback to 40-45.
Suppose Asian Paints has been climbing steadily for six weeks, with RSI oscillating mostly between 58 and 72.
It never drops into the mid-40s the entire time.
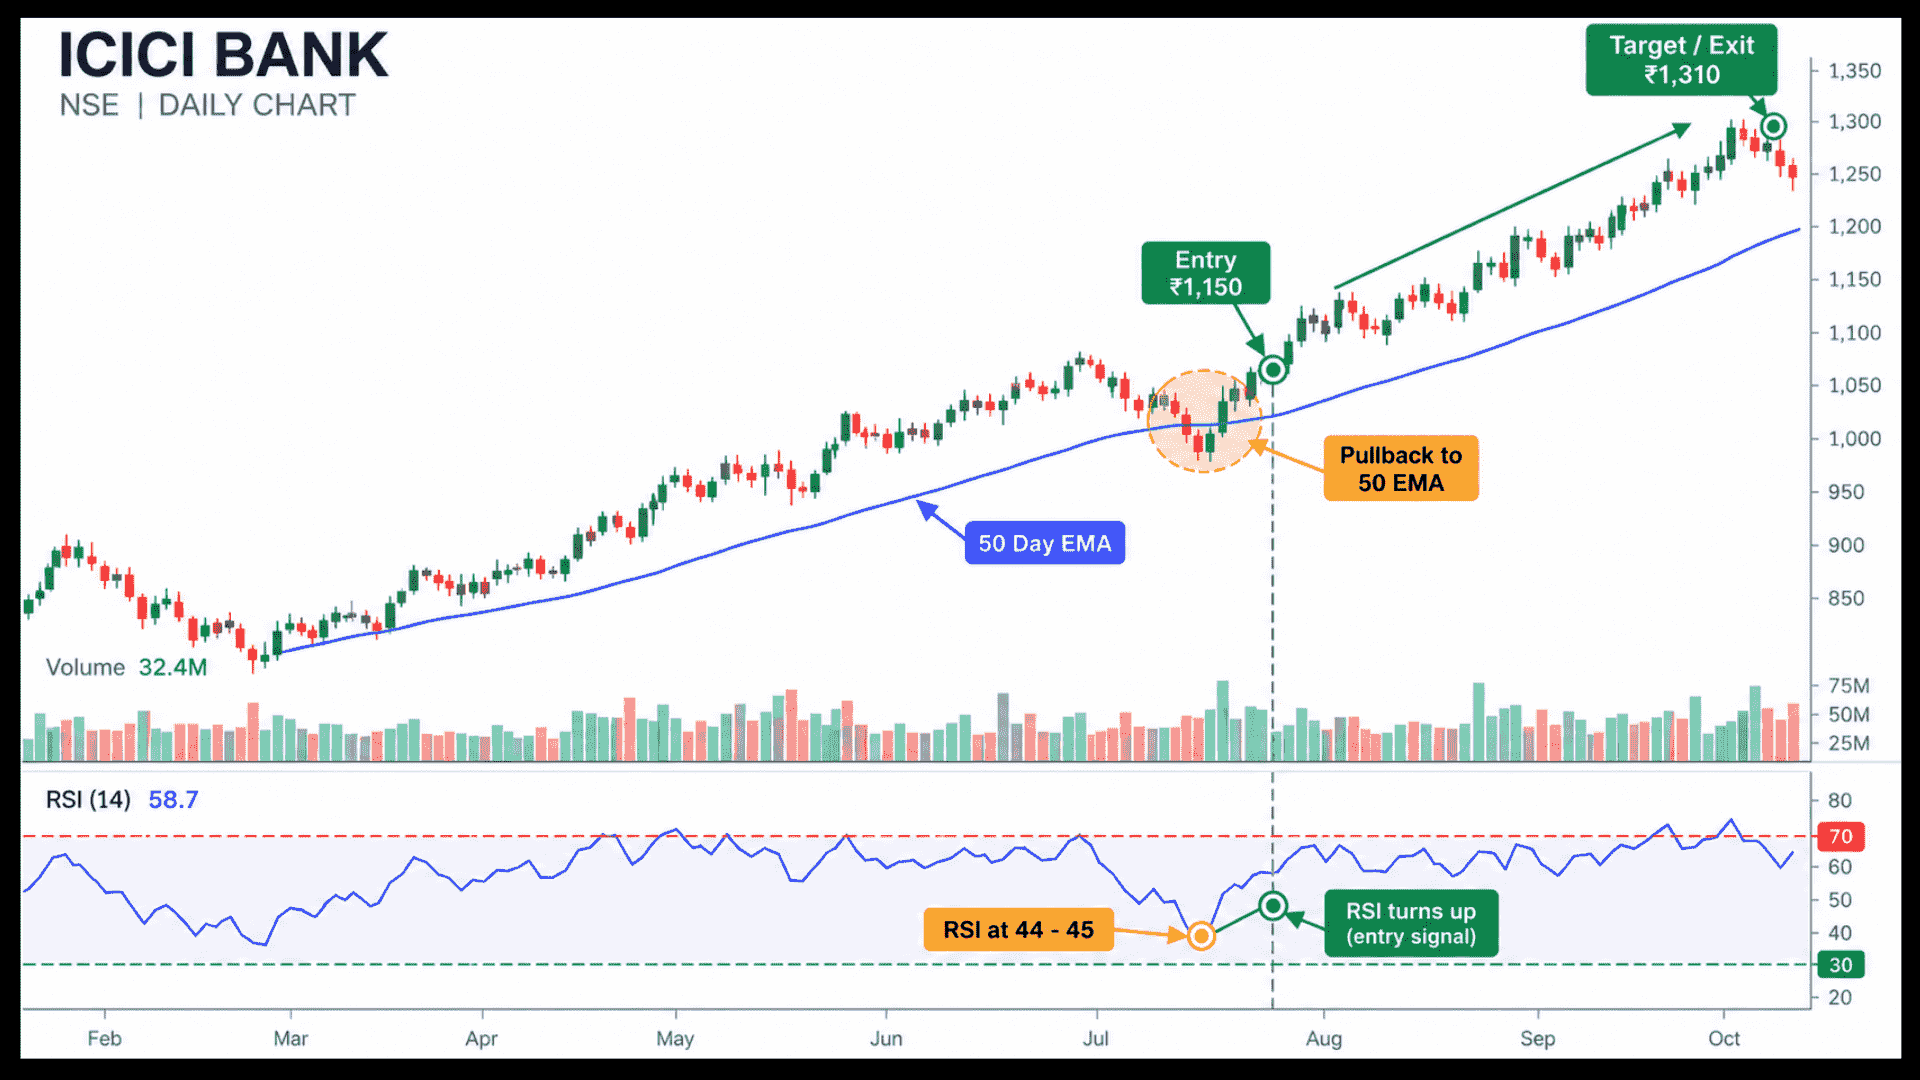
This is a genuinely strong trend. Forcing an RSI-pullback entry that is not actually there means missing the move or chasing a late entry near overbought levels.
In cases like this, patience matters more than the setup itself.
Either wait for a genuine pullback to show up, or use a different entry method, like the EMA pullback or a support-level bounce.
The EMA pullback is the core of a swing trading EMA strategy, and pairing both indicators in an EMA and RSI strategy gives you a backup entry when RSI stays quiet.
Don’t try to force RSI into giving a signal it is not offering.
Your Evening RSI Watchlist Routine
Keep a shortlist of ten to fifteen stocks already confirmed to be in an uptrend.
Check their RSI reading each evening.
Most days, none of them will be near the 40-45 pullback zone, and that is normal.
The value of the routine is being ready the moment one does pull back into that zone.
Otherwise, you notice it three days late, after the bounce has happened and the best part of the risk-to-reward has passed.
RSI vs MACD Trades: Which One Gives You the Edge?
RSI setups tend to trigger more frequently than MACD crossovers, since RSI reacts faster to short-term price swings.
That makes RSI useful for catching more entries, but it also means slightly more false signals.
MACD, being slower, gives fewer signals.
By contrast, alternative setups like swing trading with Bollinger Bands focus directly on price volatility expansions and contractions rather than moving average crossovers.
Each one tends to reflect a more established shift in momentum.
Many swing traders end up using both, exactly as described above, to balance this trade-off.
Want Help Spotting These Setups in Real Time?
RSI pullbacks are easy to identify after the fact.
Recognising a genuine 40 to 45 pullback versus an early trend reversal, live, takes repetition.
Our Swing Trading Classes walk through indicator-based entries like this one daily, on real Indian market setups.
Conclusion: Patience Beats Every RSI Reading
A swing trading strategy using RSI works best when you treat RSI as a timing tool, not a standalone buy signal.
Confirm the uptrend first, wait for RSI to dip into the 40 to 45 zone, and enter only when it turns back up with price confirmation.
Applying a structured cup and handle swing trading strategy alongside these momentum pullbacks gives you an alternative way to time your entries off major continuation breakouts.
Use divergence to sharpen exits, and pair RSI with MACD or EMAs when the trend refuses to pull back.
Above all, stay patient. A disciplined watchlist routine and a clear stop below the swing low will do more for your results than chasing every RSI reading.
Frequently asked questions
Before investing capital, invest your time in learning Stock Market.
Fill in the basic details below and a callback will be arranged for more information: