


You check a company and see that its ROE went up from 20% to 22%. Sounds like good news, right?
But why do we use DuPont analysis at all, when ROE already tells us the result? Because the same ROE can come from very different causes.
Also, some causes are healthier than others.
What Is the Purpose of DuPont Analysis?
The purpose of DuPont analysis is simple. First, it takes one number, ROE, and splits it so you can see what pushed it up or down.
For example, think of a bus ticket total. The total tells you the cost, but the bill shows which part made it expensive.
The Three Drivers of DuPont Analysis in One Line
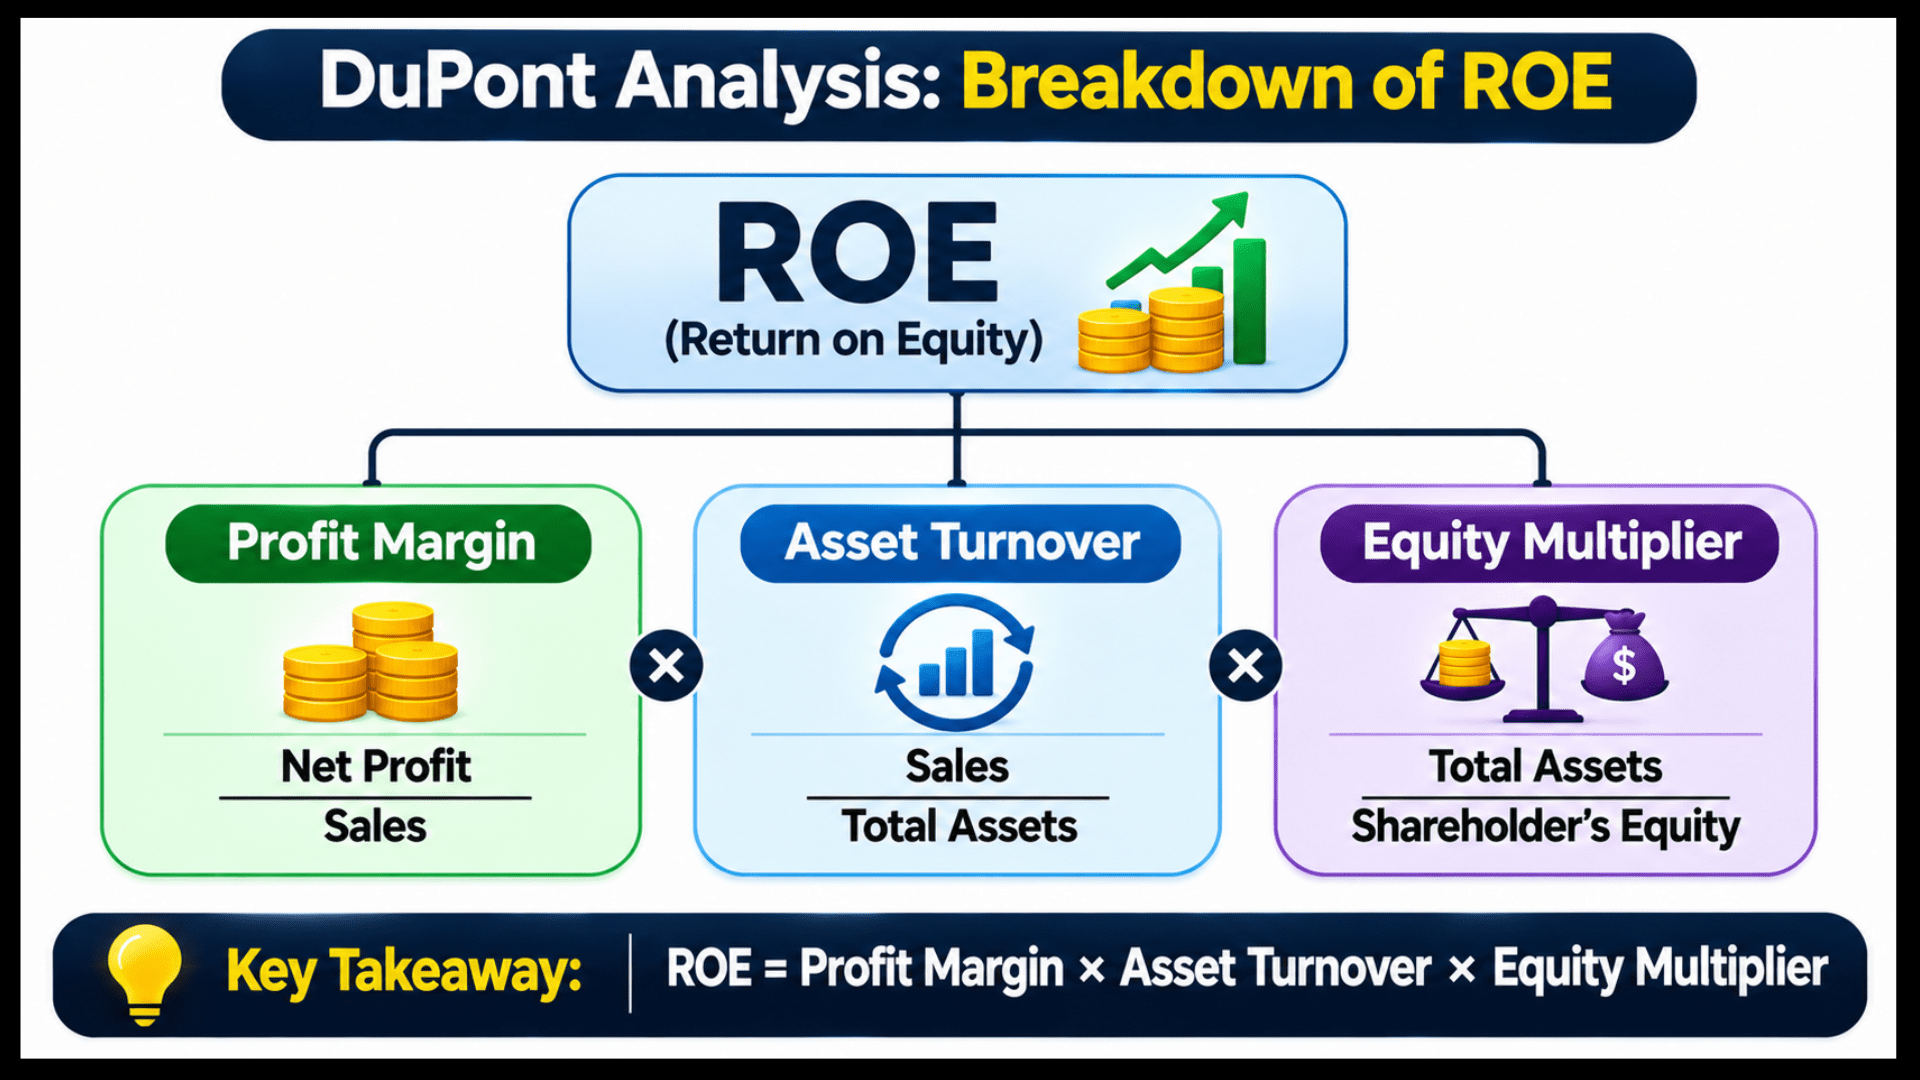
First, DuPont breaks ROE into three drivers. They are net profit margin, asset turnover and the equity multiplier.
The formula is ROE = net profit margin x asset turnover x equity multiplier.
Also, if you want the full step-by-step walkthrough, our page on DuPont analysis covers the formula and its three steps.
Instead, here we stay focused on the uses. So, let us see what each driver tells you.
Main Uses of DuPont Analysis for Beginners
If you have ever wondered what a single ROE number hides, these uses will show you.
Also, each one answers a question that ROE alone cannot.
Use 1: How to Find What Changed ROE
Now, ROE can rise for three reasons. The company earns more per rupee of sales, uses its assets better, or borrows more against its equity.
First, without a split, all three look the same. However, with DuPont, you see which one moved.
Thus, this is the first of the benefits of DuPont analysis. It turns “ROE went up” into “ROE went up because of this”.
People often ask is DuPont analysis the same as ROE. No, because ROE reports the result and DuPont explains it.
Use 2: Compare Peers With the Same ROE
However, two companies can show the same ROE and still run very different businesses. For example, one may earn a fat margin on slow sales, another a thin margin on fast sales.
Next, the table below uses made-up numbers for three peers, for illustration only. Also, each ROE is net profit margin x asset turnover x equity multiplier.
| Company | Net profit margin | Asset turnover | Equity multiplier | ROE |
|---|---|---|---|---|
| Company B | 9.0% | 1.00 | 2.00 | 18.0% |
| Company C | 6.0% | 2.50 | 1.20 | 18.0% |
| Company D | 15.0% | 0.40 | 3.00 | 18.0% |
Notice that all three show an 18% ROE. Yet Company C earns it through fast turnover with very little borrowing.
Meanwhile, Company D leans on a high margin and the most leverage. So, same ROE, different risk.
Also, we explain this idea fully in our page on whether DuPont analysis is the same as ROE.
Besides, price matters too when peers look alike. You can see how growth changes valuation in what is PEG ratio.
Use 3: How to Spot Leverage-Driven ROE (Debt-Led ROE)
Now, this is where DuPont earns its place. A company can lift ROE just by borrowing more, even if the business itself is not improving.
Now, let us see a made-up example, for illustration only. Company A has two years of data.
| Item | Year 1 | Year 2 |
|---|---|---|
| Revenue | 1,000 | 1,100 |
| Net profit | 80 | 88 |
| Average total assets | 800 | 1,000 |
| Average equity | 400 | 400 |
| Net profit margin (profit / revenue) | 8.0% | 8.0% |
| Asset turnover (revenue / average assets) | 1.25 | 1.10 |
| Equity multiplier (average assets / average equity) | 2.00 | 2.50 |
| ROE | 20.0% | 22.0% |
ROE rose by two percentage points, so a quick look says things improved. However, look at the drivers.
First, margin stayed flat at 8%. Then, asset turnover fell from 1.25 to 1.10, so each rupee of assets produced less sales.
Finally, the equity multiplier jumped from 2.00 to 2.50. Assets grew by 200 while equity stayed at 400, so the extra assets were funded by liabilities, mostly borrowing.
Now a quick check. If the multiplier had stayed at 2.00, ROE would be 8.0% x 1.10 x 2.00 = 17.6%.
That is a fall, not a rise. So, the whole gain came from leverage.
That does not make the company bad. Instead, it means the higher ROE came with higher financial risk, and a reader should know that.
Besides, practising this on real statements is easier with guidance. A structured fundamental analysis course can help.
Use 4: What Can Management Change? How to Read the Drivers
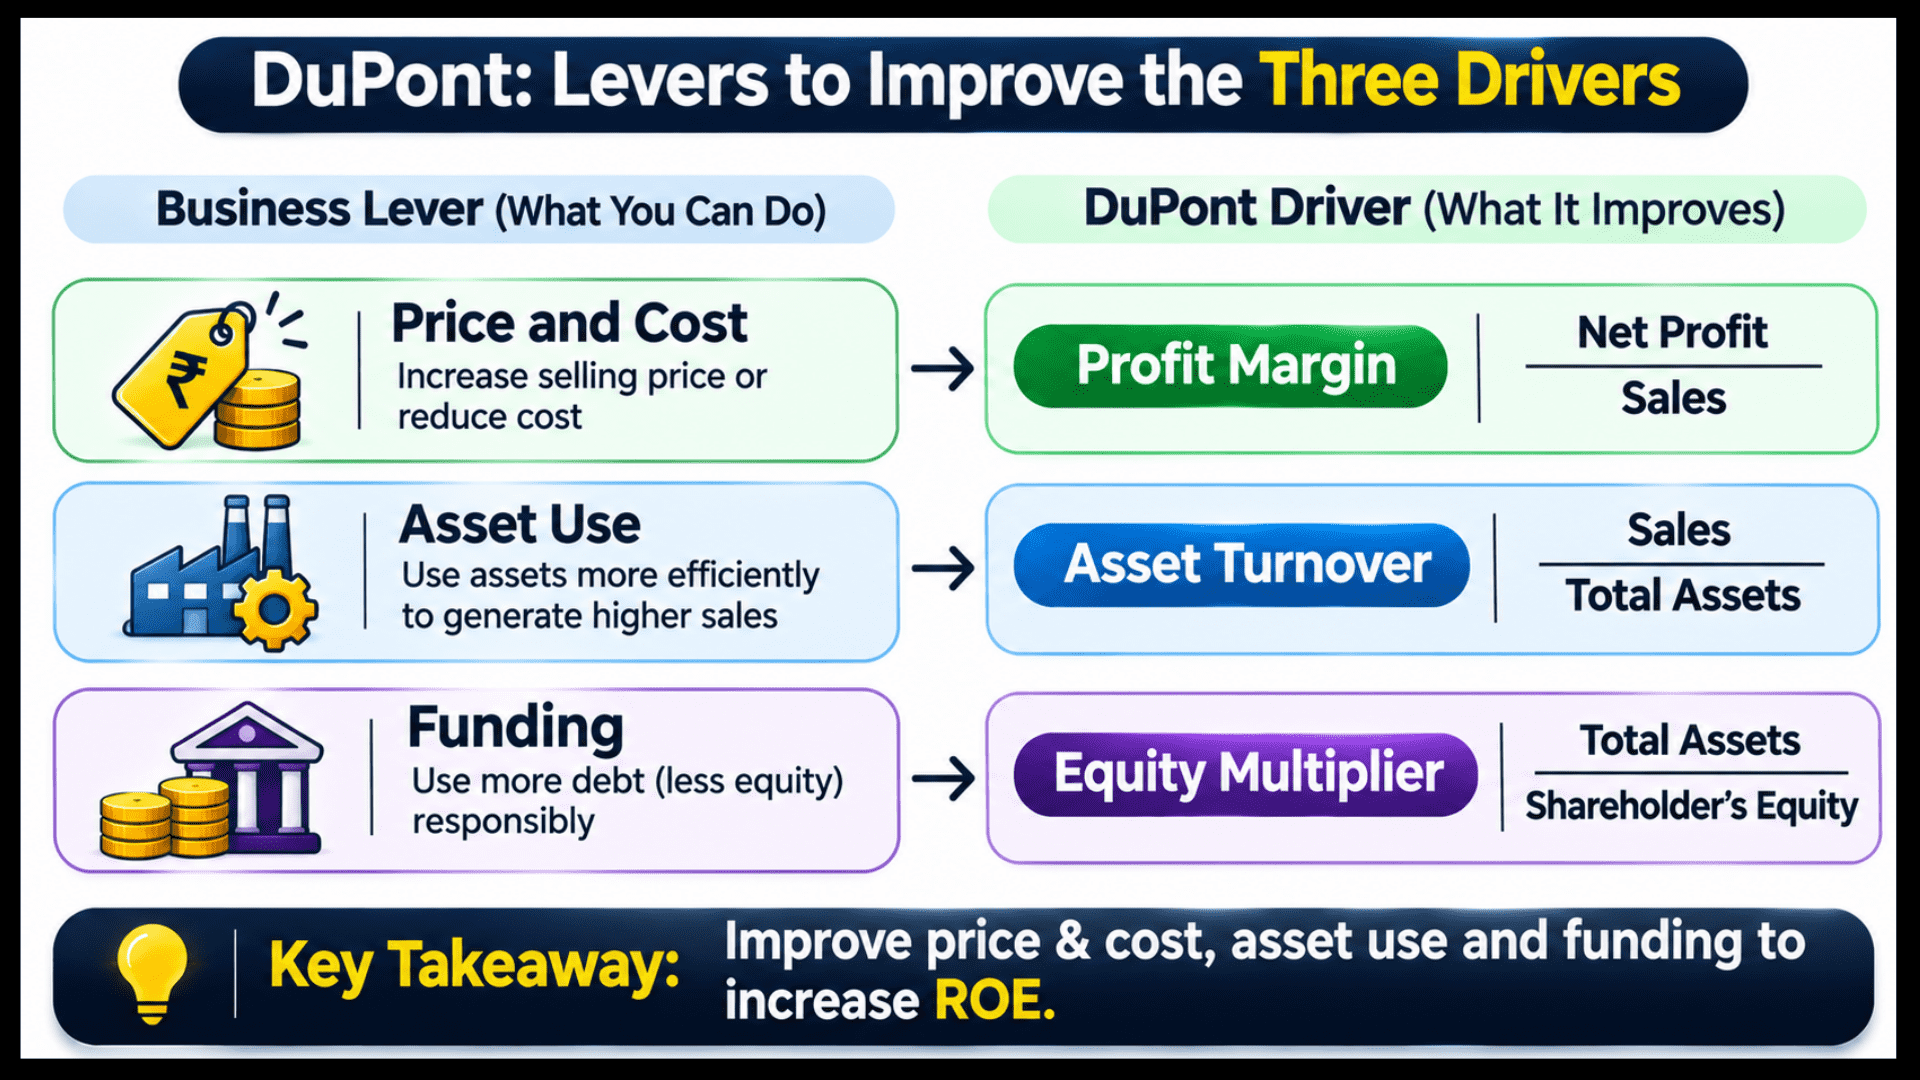
First, each driver connects to a different lever. Margin links to pricing and costs, while turnover links to how well assets are used.
Finally, the multiplier links to how the company is funded.
Next, the table below maps each driver to the kind of question it raises. Also, it is a thinking aid, not a rule.
| Driver | What it reflects | Question to ask |
|---|---|---|
| Net profit margin | Pricing power and cost control | Is the margin stable or shrinking? |
| Asset turnover | How efficiently assets earn sales | Are assets growing faster than sales? |
| Equity multiplier | How much is funded by borrowing | Is borrowing rising faster than equity? |
So, this helps you read management commentary with sharper questions. Then, you can check these ideas against the numbers in the annual report.
Use 5: Where to Dig Deeper in the Annual Report
DuPont does not give you an answer. Instead, it gives you a better question.
First, if margin fell, you read the profit and loss statement. Next, if turnover fell, you check inventory and receivables.
Finally, if the multiplier rose, you study the debt and interest cost.
This makes DuPont a good bridge into your wider plan to learn fundamental analysis. Moreover, it tells you which page of the report deserves your time.
Is High ROE Real? Questions to Ask Before You Trust It
Now, use these questions as a quick check. Also, the list is short on purpose, so it is easy to remember.
- Which of the three drivers changed the most?
- Did the equity multiplier rise along with ROE?
- Is the margin stable across several years, not just one?
- Is asset turnover falling while assets grow?
- How does the split compare with similar companies?
- Is a one-time gain lifting this year’s profit?
So, if you answer these honestly, a high ROE becomes much easier to judge.
Also, DuPont says nothing about price timing. Therefore, many readers add chart reading, and you can learn technical analysis step by step.
Benefits of DuPont Analysis at a Glance
Now, here are the main benefits of DuPont analysis, in plain words.
- It shows the source of ROE, not just the level.
- Peer comparison becomes fairer.
- Debt-led improvement gets flagged early.
- You get better questions for reading reports.
Many readers pair it with other ratios while they read fundamental analysis books. In fact, that builds the habit of asking “why” before “how much”.
Limits of DuPont Analysis
DuPont is useful, but it has limits. So, knowing them keeps you from over-trusting it.
- Accounting differences. Two companies may treat costs, depreciation or one-time items differently. Their margins may not be fully comparable.
- Banks and financial companies. Their balance sheets work differently, because borrowing is part of their core business. The three-step split is usually read differently for them, so use sector-specific tools.
- Period averages. Using average assets and average equity smooths the numbers. A sharp change late in the year can hide inside an average.
- One year is not a trend. A single year can mislead. So, look at several years.
- Quarterly noise. Quarterly results can swing the picture. Also, our page on the impact of quarterly results on share price explains why short-term numbers deserve caution.
- Estimates and the past. DuPont uses past numbers. Besides, past ratios do not guarantee future results.
Besides, DuPont explains ROE, not value, and even valuation ratios need care. So, is low PEG ratio good shows why.
DuPont Analysis and Value Investing: How They Fit Together
In fact, value-minded investors like DuPont because it separates strong businesses from businesses that only look strong through debt. That matters when you estimate what a company is really worth.
Also, if this style appeals to you, read about how to learn value investing step by step.
Besides, our comparison of value investing vs growth investing shows how each style thinks about price. Finally, treat DuPont as one input, not a verdict.
Tired of guessing whether a high ROE is real strength or just borrowed money?
Videos can explain the formula, but real annual reports and a mentor’s answers teach you to spot the difference.
Join our live classes from your mobile, ask your doubts and learn step by step.
Conclusion
DuPont analysis splits one ROE number into margin, turnover, and leverage, so you can see what really drives it. Also, it flags debt-led gains and makes peer comparison fairer.
However, it uses past numbers and is only one input. So, check several years, compare with peers and keep asking why a driver moved.
Disclaimer: This page is for education only and is not investment advice. All numbers are hypothetical and for illustration only, and past results do not guarantee future results.
We do not promise profits. So, please do your own research or speak to a SEBI-registered adviser before investing.
Frequently Asked Questions
Before investing capital, invest your time in learning Stock Market.
Fill in the basic details below and a callback will be arranged for more information: