
What separates a trader who consistently profits intraday from one who consistently loses?
It’s rarely about intelligence and experience. More often than not, it comes down to one thing: a repeatable system that tells them when to enter, when to exit, and when to sit on their hands.
The EMA crossover for intraday trading is one of the most battle-tested systems in the market. Used by scalpers, positional traders, and algo systems alike, it works because it doesn’t predict the market, but it simply follows it.
When the fast EMA crosses above the slow EMA, momentum is shifting upward. When it crosses below, the sellers are taking control. Clean, objective, and actionable.
In this blog, we’ll walk you through the complete EMA crossover strategy for intraday in a simple way.
What Is EMA Crossover For Intraday Trading?
EMA crossover for intraday is fundamentally a system of momentum. You take two EMAs, one fast and one slow, and you follow where they cross.
The logic is straightforward:
- When the fast EMA crosses above the slow EMA, it signals bullish momentum.
- When it crosses below, it signals bearish momentum.
- When the price stays above both EMAs, it confirms that the trend has strength behind it.
This is the classic moving average crossover for an intraday approach, and it has been used by traders for decades because the concept is simple to understand and easy to spot on a chart.
But here is the catch.
Not every crossover is worth trading. Just because the lines cross does not mean you should enter a position. The signal alone is not enough.
What truly matters is the context around it. So you should always ask:
- What is the broader trend?
- Is volume supporting the move?
- Is the market trending or just ranging sideways?
That is what separates disciplined traders from impulsive ones.
The setup may look mechanical on the surface, rules are defined, levels are clear, and signals appear automatically on the chart. But the execution is not mechanical at all.
It requires judgment, patience, and the ability to read the market conditions surrounding the crossover.
In short, the EMA crossover tells you what is happening. It is your job as a trader to decide whether that signal is actually worth acting on.
What Is a Golden Cross and Death Cross?
In EMA crossover trading, two important terms come up frequently: Golden Cross and Death Cross.
- Golden Cross: This occurs when a shorter-term moving average crosses above a longer-term moving average, signaling bullish momentum. In intraday trading, when the 9 EMA crosses above the 21 EMA, it acts as a bullish crossover signal.
- Death Cross: This occurs when a shorter-term moving average crosses below a longer-term moving average, signaling bearish momentum. In intraday trading, when the 9 EMA crosses below the 21 EMA, it acts as a bearish crossover signal.
In traditional markets, these terms refer to the 50 EMA crossing the 200 EMA on longer timeframes.
For intraday purposes, the same logic applies, but on faster EMA pairs like 9 and 21.
Example:
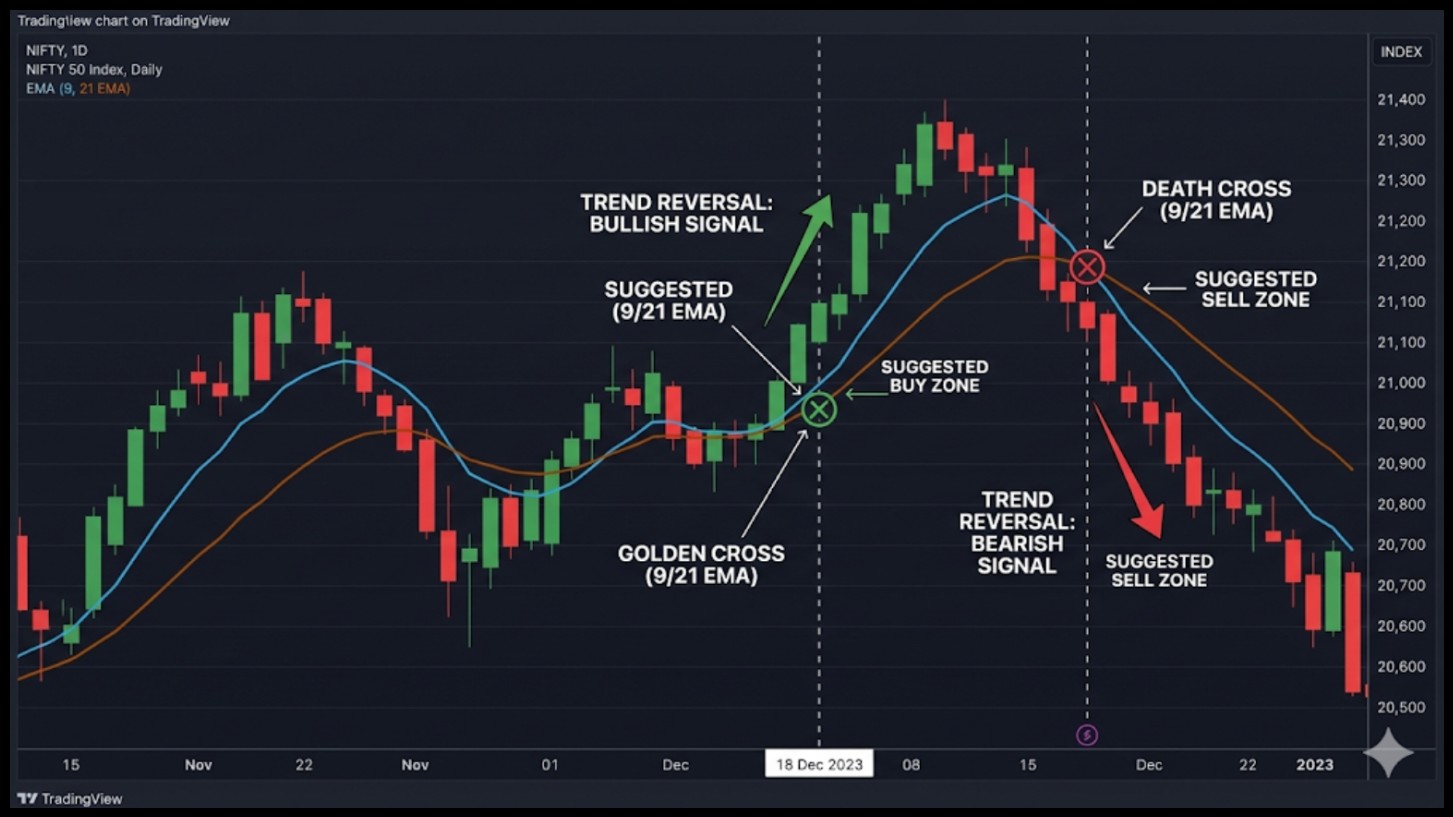
A Golden Cross in our 9/21 EMA would have acted as a signal to buy, whereas a Death Cross would have acted as a sell.
Such basic indicators are used to ensure traders are right about the direction of the trend.
How To Set Up EMA On TradingView / Zerodha?
Beginners often understand the theory but struggle to apply EMAs on a chart. Setting them up is easy once you know the steps.
Follow this simple 4-step guide:
- Open your chart on TradingView or Zerodha Kite
- Click Indicators and search for EMA
- Set Period = 9 and apply
- Repeat for Period = 21, using a different colour for each EMA
This quick setup lets you start applying the EMA crossover strategy immediately.
Best EMA Crossover For Intraday Trading
Choosing the right EMAs is where many traders go wrong. Too fast, and you get noise. Too slow, and you miss moves.
When deciding which exponential moving average to use for your specific strategy, you must match the period to your trading speed.
Popular EMA Combinations:
|
Style |
EMA Pair |
| Fast Scalping |
5 EMA and 9 EMA |
|
Standard Intraday |
9 EMA and 21 EMA |
| Trend Confirmation |
20 EMA and 50 EMA |
Thus, through this table, we can conclude the following;
- 9 EMA reacts quickly to price
- 21 EMA filters minor fluctuations
- 20 or 21 EMA often acts as dynamic support or resistance, depending on the trend
For most traders, a 9 EMA strategy combined with the 21 EMA is considered the best EMA crossover for intraday because it balances speed and reliability.
EMA Crossover Strategy For Intraday
Now, let’s bring structure into this. A proper EMA crossover strategy for intraday needs clear rules.
Learning how to trade EMA crossover setups effectively means moving beyond just watching lines intersect and focusing on candle closes and trend alignment.
Without defined rules, even the best setups can turn into inconsistent and emotional trades.
Entry Rules:
- Wait for EMA crossover on a 5 or 15 min chart
- Confirm price is above both EMAs for long trades
- Prefer entering on a pullback to the fast EMA for better risk-reward, although strong trends may continue without a pullback
Exit Rules:
- Exit at predefined levels such as recent swing highs/lows, key support/resistance zones, or based on a fixed risk-reward ratio (e.g., 1:2)
- Use a trailing stop with EMA
- Exit if reverse crossover happens
Key Rule:
Avoid chasing candles. Let the price come back to your level. That small patience often saves large losses.
It also improves your entry price, which directly increases your reward potential without increasing risk.
Step-By-Step Intraday Trade Setup
This is where theory meets execution. Let’s break down the real structure. Clarity at this stage helps you avoid guesswork and trade with defined rules instead of assumptions.
Steps to follow:
- Identify trend using EMA alignment (fast EMA above or below slow EMA)
- Wait for the price to pull back toward the fast EMA
- Look for a confirmation candle near EMA (bullish or bearish)
- Enter trade above or below the confirmation candle
- Place a stop-loss below or above the recent swing
- Set a target with a minimum 1:2 risk-reward ratio
Clear rules and precise levels turn a simple setup into a repeatable trading process.
Trade Example:
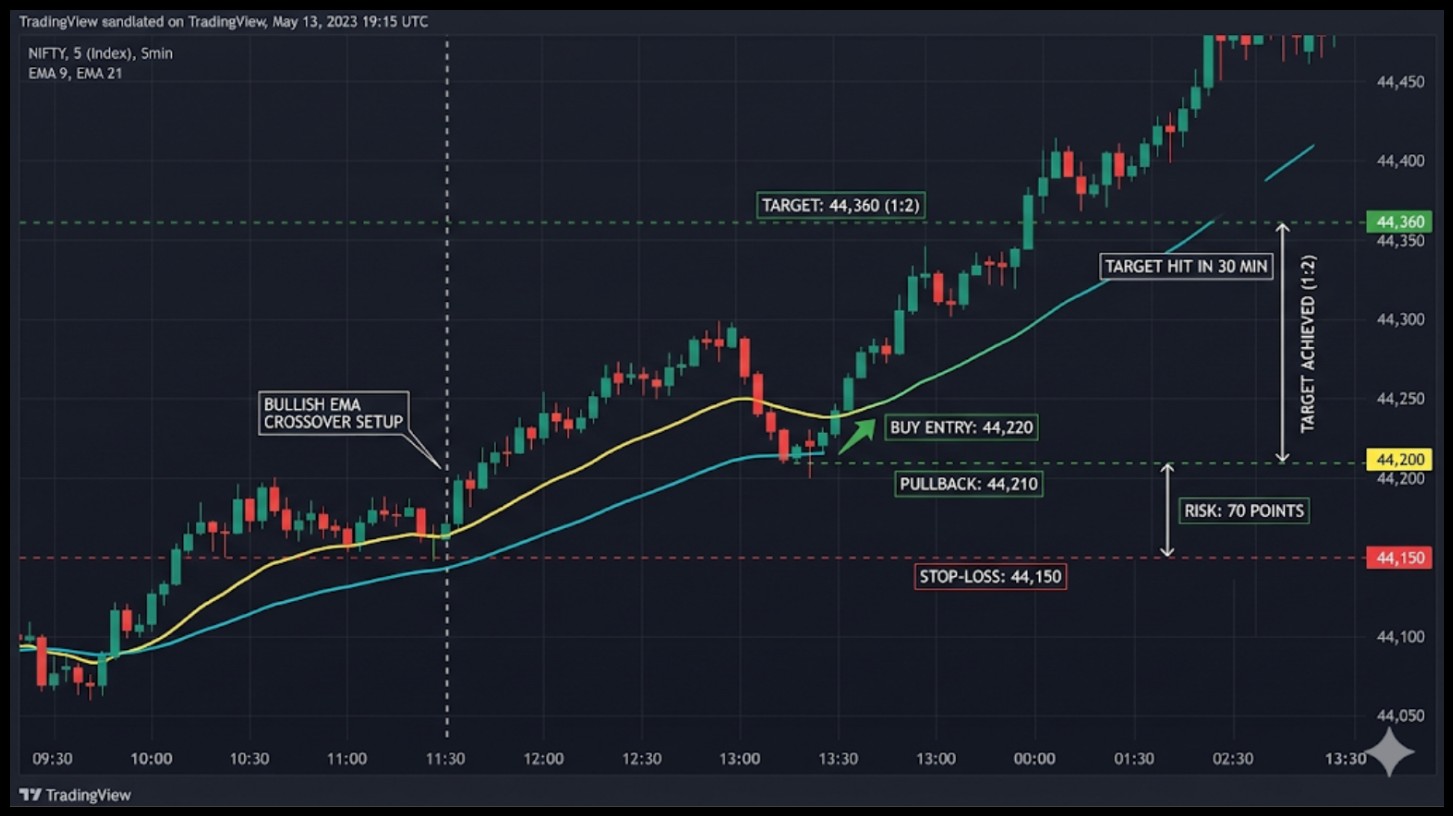
- Index: Bank Nifty
- Timeframe: 5 min
- 9 EMA: 44,200
- 21 EMA: 44,150
- Price: 44,250
Entry:
- 9 EMA crosses above 21 EMA
- Price pulls back near the 9 EMA (around 44,200–44,210)
- Buy entry at 44,220
Risk And Target:
- Stop-loss: 44,150
- Risk: 70 points
- Target: 44,360 (1:2 ratio)
Outcome:
- Price continues upward momentum
- Target achieved within 30 minutes
This is how a clean EMA cross for intraday looks; no guessing, no overthinking. Just follow the setup, trust the rules, and let the trade play out.
EMA Cross Settings For Different Intraday Timeframes
Not every chart behaves the same way. Your EMA settings should change depending on the timeframe you are trading.
If you use the same setup everywhere, you will either get late signals or too much noise.
Recommended Settings:
- 1 min chart: 5 EMA and 9 EMA
- 5 min chart: 9 EMA and 21 EMA
- 15 min chart: 10 EMA and 20 EMA
Traders who prefer ultra-fast execution often rely on a 5 EMA strategy on the 1-minute chart to capture rapid scalping opportunities.
These settings ensure you are seeing momentum shifts the moment they happen, though they require much stricter discipline to avoid false signals.
Important Insight:
- Lower timeframe = faster EMAs
- Higher timeframe = smoother EMAs
Using one fixed setup across all timeframes often leads to confusion. Markets don’t move the same way all the time, so your strategy shouldn’t stay rigid either.
Small adjustments in your EMA settings can make a big difference in how clean your signals are and how confident your trades feel.
Moving Average Crossover Strategy For Intraday Trading With Confirmation
Crossover alone is not enough. Adding confirmation improves accuracy.
Volume, trend direction, or support-resistance levels help filter out weak signals and avoid false entries.
Confirmation Tools:
- Volume: If the crossover happens but the volume is below average, the signal is weak. The crossover point is enhanced with a volume spike.
- RSI: RSI or Stochastic Oscillator may be used to authenticate overbought or oversold markets in addition to crossover indicators. When the RSI exceeds 50 in a bullish crossover, then the signal is better.
- Support/Resistance: A crossover at a well-known support level is much more solid than one in the wild.
Using confirmation tools alongside EMA crossovers greatly reduces mistakes and improves your trade success rate.
One commonly used approach is the EMA and RSI strategy, where RSI helps confirm momentum strength alongside the crossover signal.
Always look for these extra signals before committing to a position to trade with confidence.
Example:
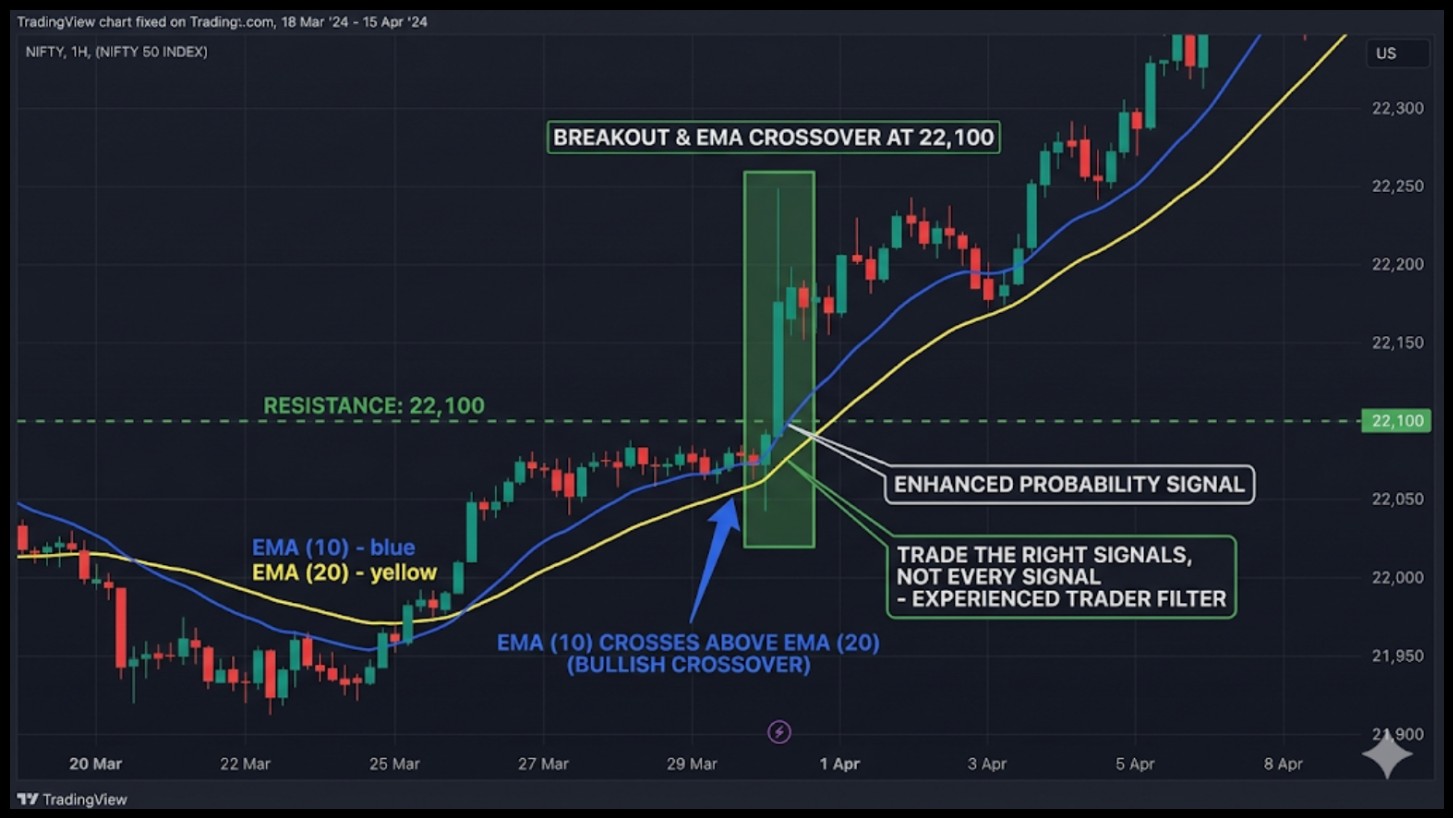
If Nifty breaks resistance at 22,100 and an EMA crossover happens at the same time, the probability improves significantly.
This is how experienced traders filter trades. They don’t trade every signal; they trade the right ones.
How to Identify a Fake/False Crossover?
Not every crossover leads to a winning trade. A signal in a flat, sideways market is often false. If both EMAs are nearly horizontal, it’s best to skip the trade.
Use the ADX indicator as a filter; readings below 25 suggest a weak or sideways market where crossovers are less reliable, though not completely invalid
A strong, valid crossover shows the price moving decisively away from the EMAs with momentum, rather than just touching and reversing.
This simple check can save you from costly mistakes.
Common Mistakes During EMA Crossover for Intraday
A strong crossover shows price moving decisively away from the EMAs with momentum, rather than just touching and reversing.
Many beginners often ask is EMA crossover profitable, but the truth is that profitability depends more on avoiding common errors than on the signal itself.
This quick test might help you avoid expensive errors.
Mistakes To Avoid:
- Trading during sideways markets
- Entering late after big candles
- Ignoring the higher timeframe trend
- Overtrading every crossover
Another subtle mistake is overconfidence after a few wins. That is the humbling response of the market.
Sometimes, even experienced traders may be caught unprepared, and it is important to stick to your rules and be disciplined.
Practical Tips To Do EMA Crossover for Intraday
Minor practices frequently divide steady traders and the struggling ones.
Willingness to wait, discipline, and adhering to your EMA guidelines would drastically enhance your future trading performance.
- Trade only during high-volume sessions
- Focus on 1 or 2 instruments
- Stick to fixed risk per trade
- Avoid news-driven volatility
- Risk only 1-2% of your capital per trade
- If your stop is 70 points on Bank Nifty futures, calculate your lot size accordingly.
- Never increase position size to “recover” a loss; that’s how accounts blow up.
Consistency isn’t built in one day. It’s built trade by trade. Patience and discipline turn each small win into long-term success.
Conclusion
The EMA crossover for intraday trading isn’t a magic formula, and it doesn’t promise you’ll win every trade.
What it does is give you a clear, structured way to read momentum, time your entries, and protect your capital when the market turns against you.
The market will always have noise. False crossovers, sideways chop, sudden reversals, because that’s the game.
But with the right EMA setup and disciplined execution, you stop reacting and start responding.
Start with the 9 and 21 EMA on a 5-minute chart. Follow the rules, track your trades, and refine your approach.
Take it beyond theory. Join our intraday trading classes and learn how to trade EMA crossovers with clarity and confidence.
FAQs
Q1: Which EMA Is Best For Intraday Trading?
Ans: 9 EMA and 21 EMA are widely used because they balance speed and accuracy. They help capture clean intraday trends.
Q2: Does EMA Crossover Work In Intraday Trading?
Ans: Yes, it works well in trending markets. It becomes less reliable in sideways conditions, so the market context is important.
Q3: What Timeframe Is Best For EMA Crossover Intraday?
Ans: 5-minute and 15-minute charts are most effective. They reduce noise while still providing timely entry signals.
Before investing capital, invest your time in learning Stock Market.
Fill in the basic details below and a callback will be arranged for more information:


