


Fibonacci retracement levels look intimidating the first time you see them on a chart: a cluster of horizontal lines at odd percentages like 38.2 and 61.8.
Once you understand what they actually represent, mastering swing trading with Fibonacci retracements becomes one of the more precise ways to plan both your entry and your exit before you ever place the trade.
Because the rules are visual and measurable, it also fits neatly into any swing trading strategy for beginners.
What Do Those Strange Fibonacci Percentages Actually Mean?
Fibonacci retracement levels are horizontal lines drawn between a recent swing high and swing low.
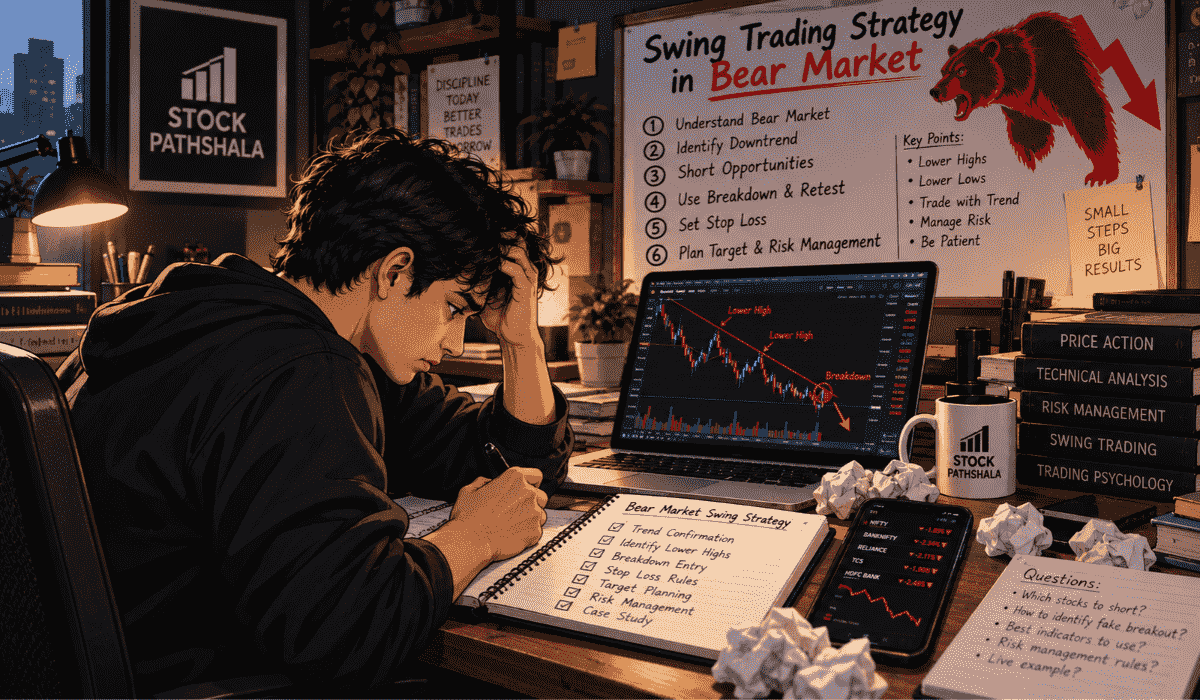
Applying a dependable swing trading strategy in bear market conditions allows traders to capitalize on sharp downward bounces.
They mark the percentages at which price often pauses or reverses during a pullback.
The key levels swing traders watch are 38.2%, 50%, and 61.8%.
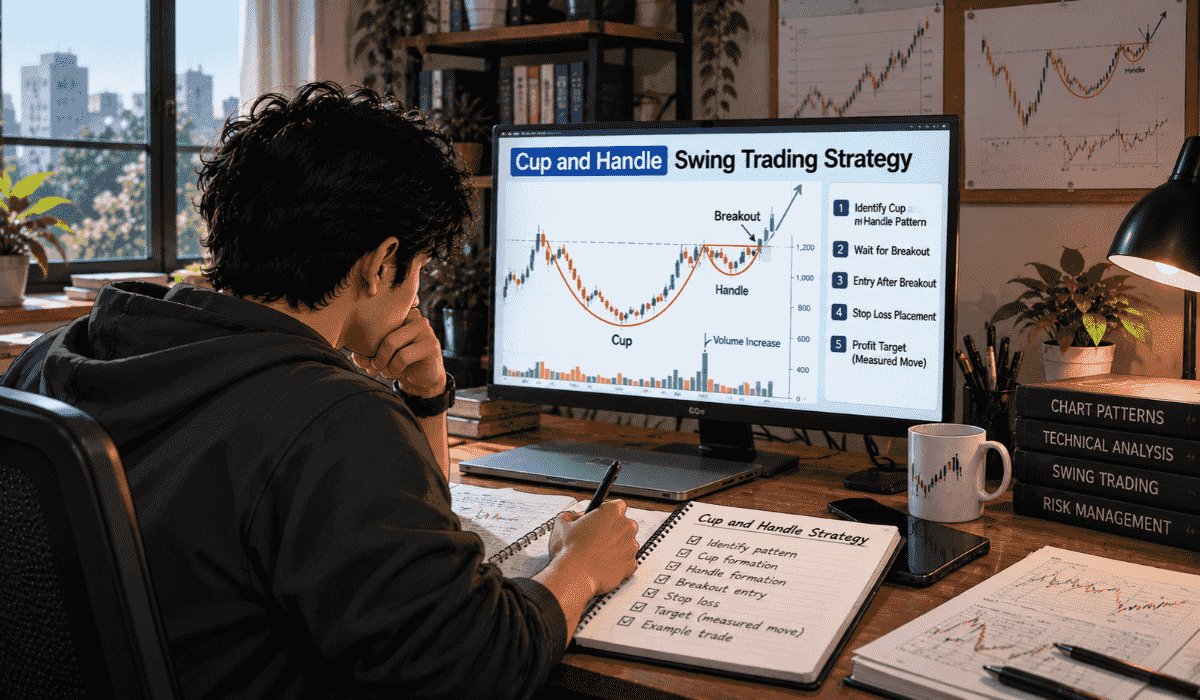
Traders often combine these retracement levels with a cup and handle swing trading strategy to pinpoint explosive breakout continuations after a consolidation phase.
These are not arbitrary; they come from the Fibonacci number sequence.
For reasons rooted in collective trader behaviour more than any hard rule, price genuinely does react at these levels often enough to matter.
Are You Drawing Your Swing Trading With Fibonacci Retracement Levels Backwards?
This is where most beginners go wrong before they even place a trade.
For an uptrend: draw the tool from the swing low to the swing high. The retracement levels will then sit below the high, marking likely pullback zones.
For a downtrend: draw it from the swing high to the swing low. The levels will sit above the low, marking likely bounce zones in a bearish setup.
Getting the direction backward flips every level and makes the whole setup meaningless.
So double-check the direction before reading anything into the chart.
The 6-Step Fibonacci Swing Trading Setup
Step 1: Identify a clear recent swing high and swing low in an established trend.
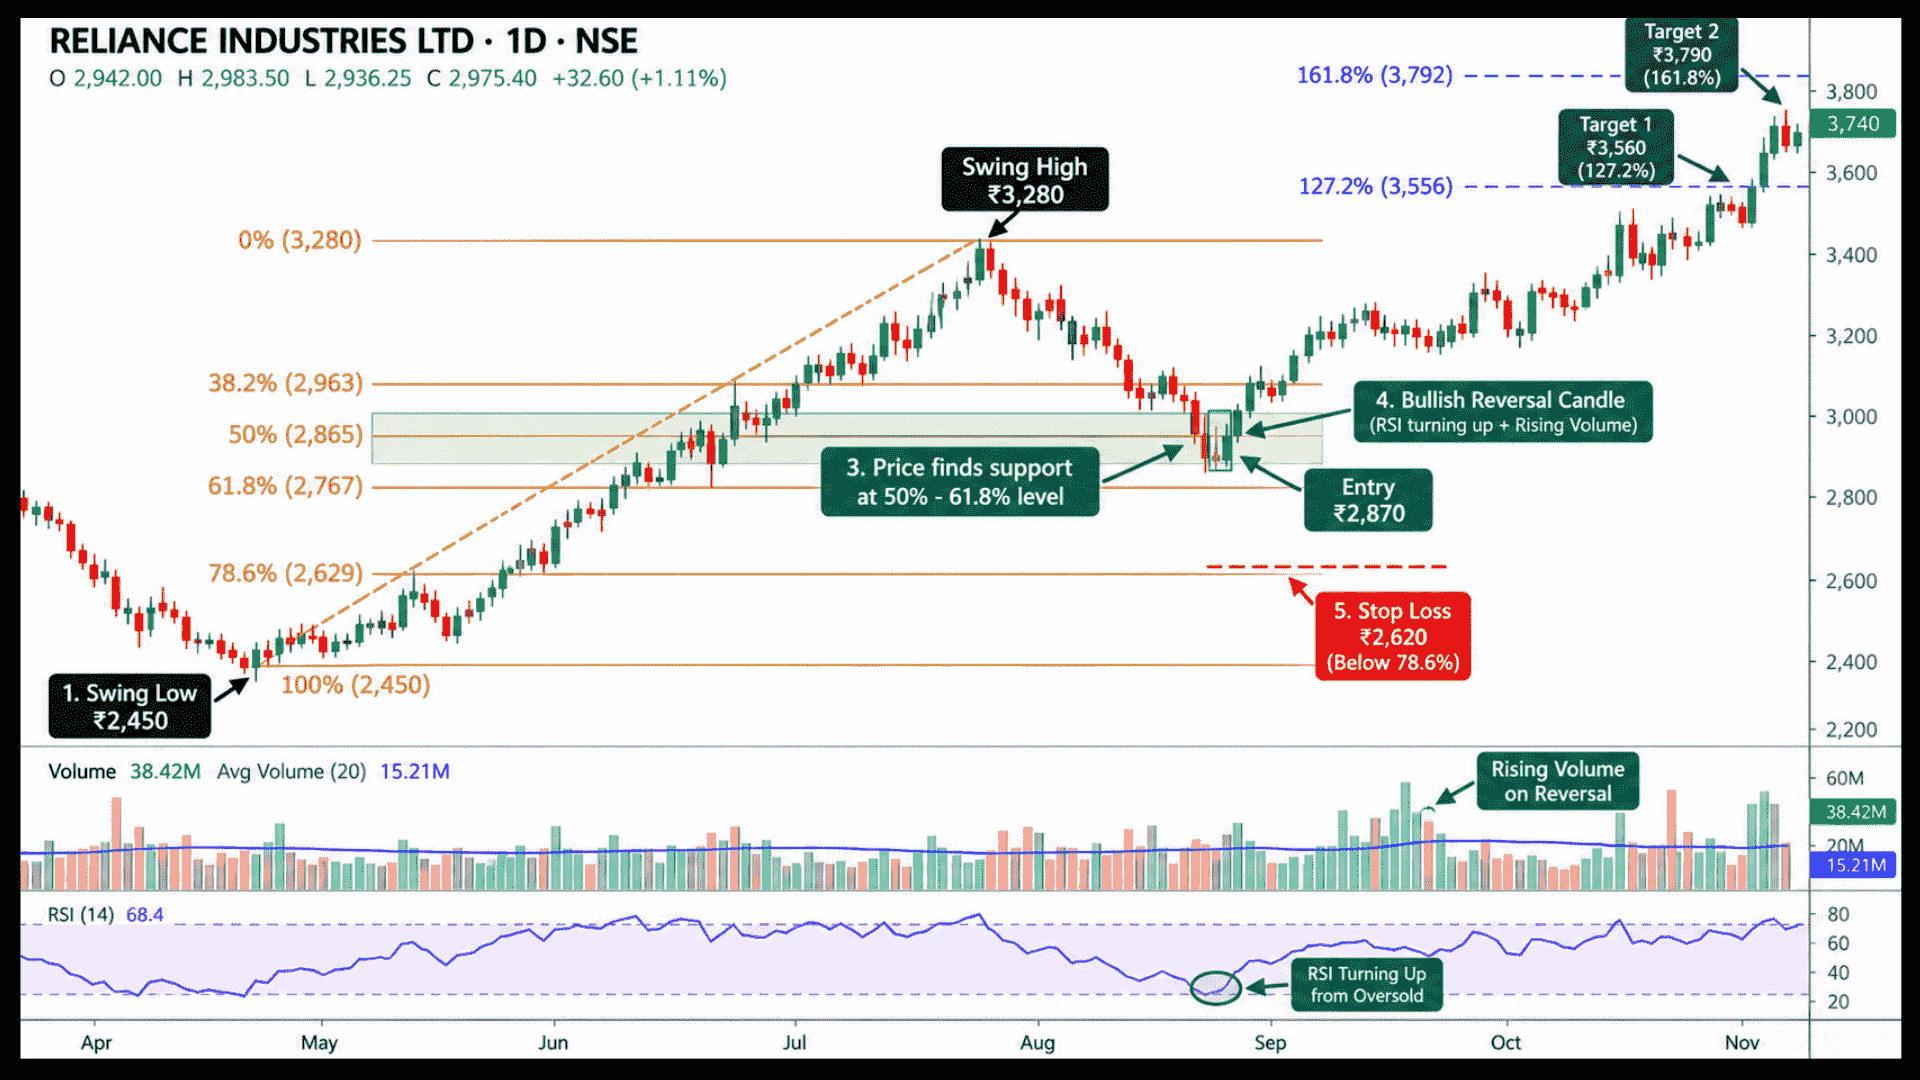
Step 2: Draw the retracement from low to high (uptrend) or high to low (downtrend).
Step 3: Watch the 50% and 61.8% levels closely.
These two are where price most commonly finds support in a healthy pullback within an uptrend.
Step 4: Wait for confirmation at the level, such as a bullish reversal candle or a bounce with rising volume.
Don’t buy the moment price simply touches the line. An RSI turning up from oversold, as used in a swing trading strategy using RSI, can add extra confirmation.
Step 5: Set your stop loss just beyond the next Fibonacci level down.
This is typically the 78.6% level, or the original swing low if price is close to it.
Step 6: Set your target at the prior swing high, or use the Fibonacci extension levels (127.2% and 161.8%) if you expect the move to exceed it.
Deciding this before entry is the core of knowing how to exit a trade with discipline.
Worked Example 1: How a Reliance Pullback Became a 1:2 Trade
Suppose Reliance Industries rallies from a swing low of ₹2,720 to a swing high of ₹2,950.
You draw the Fibonacci retracement across that move. The 50% level sits at ₹2,835 and the 61.8% level at ₹2,807.
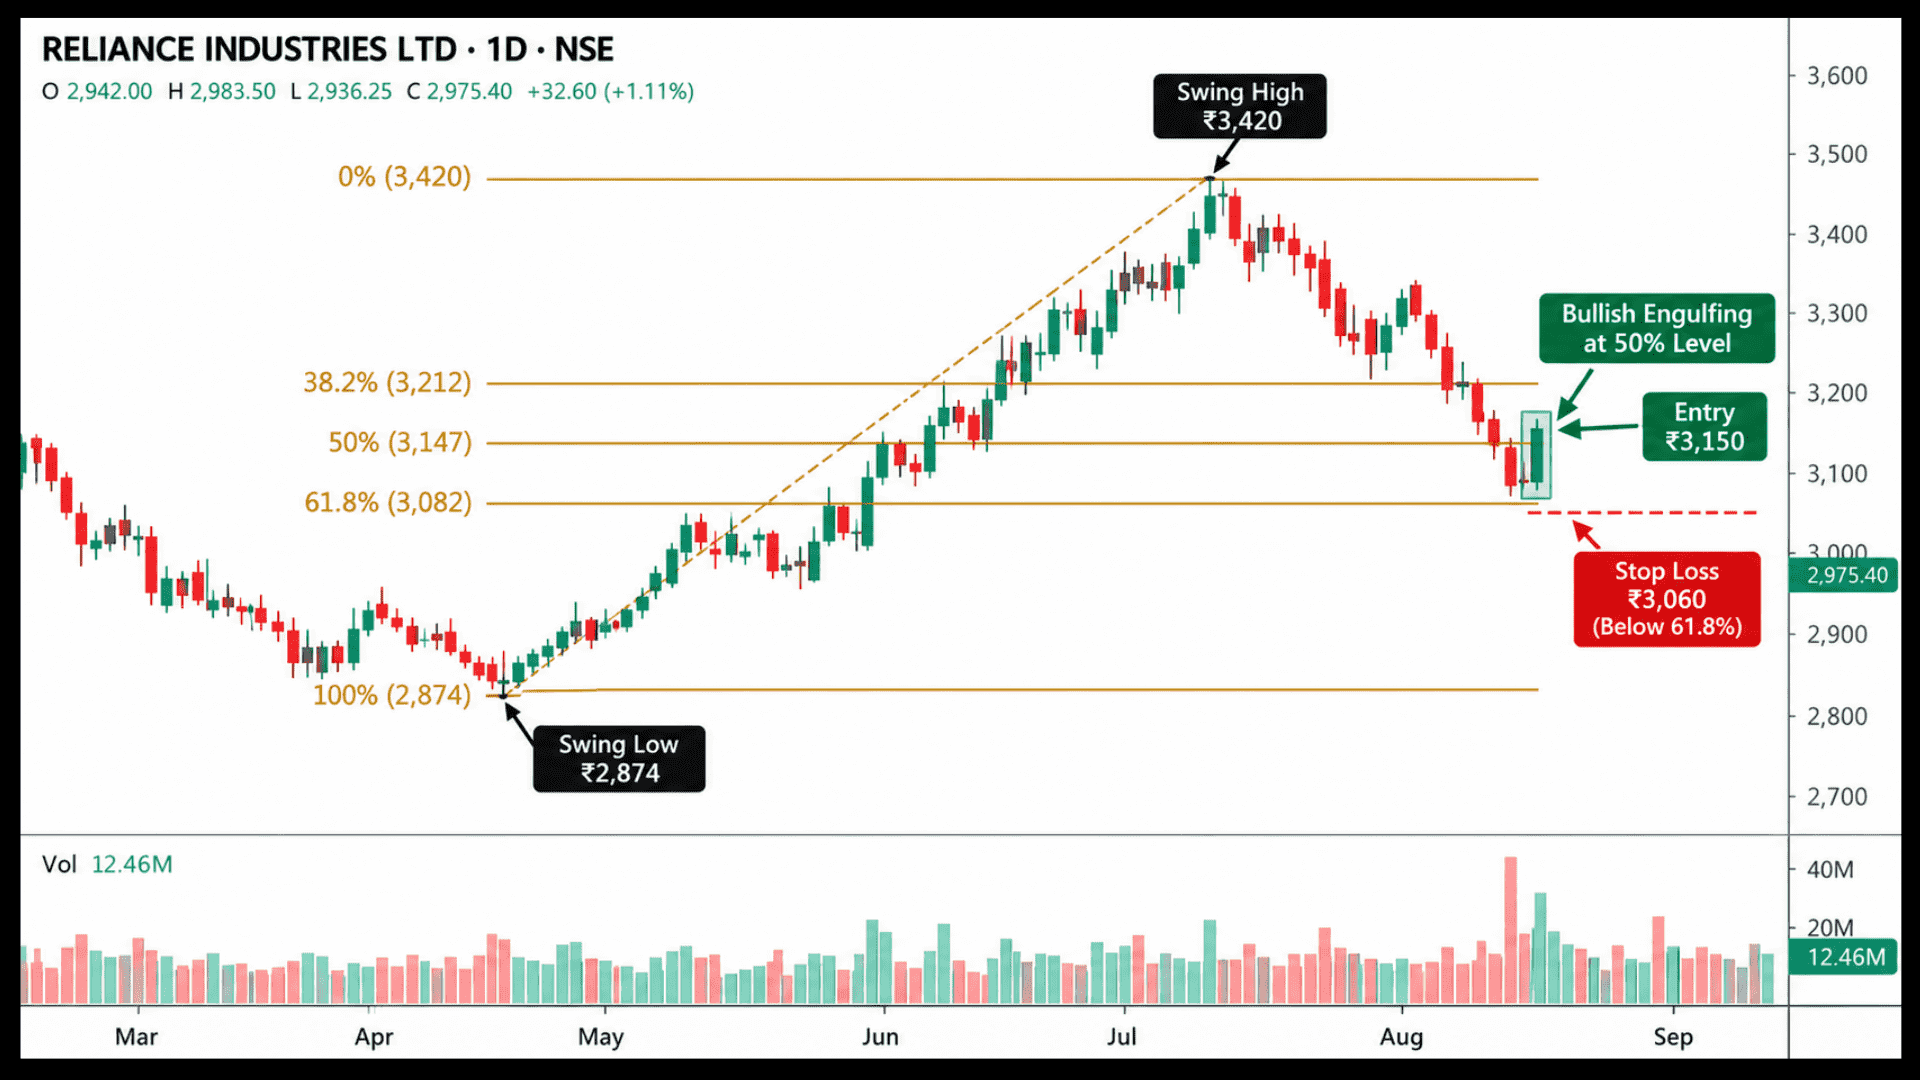
Price pulls back and finds support right at ₹2,830, close to the 50% level, forming a bullish engulfing candle.
You enter at ₹2,845. Your stop sits at ₹2,795, just under the 61.8% level.
The stock resumes its climb and reaches ₹2,950 again over the following two weeks, when you exit.
That captures ₹105 per share against a risk of ₹50, close to a 1:2 risk-to-reward.
Why Pair Fibonacci With Bollinger Bands?
Fibonacci retracement levels are excellent for setting precise, measured targets.
But they tell you nothing about current volatility or the strength of the pullback itself.
That is exactly where Bollinger Bands add value, gauging whether a stock is in a genuine low-volatility pause or an unusually sharp move.
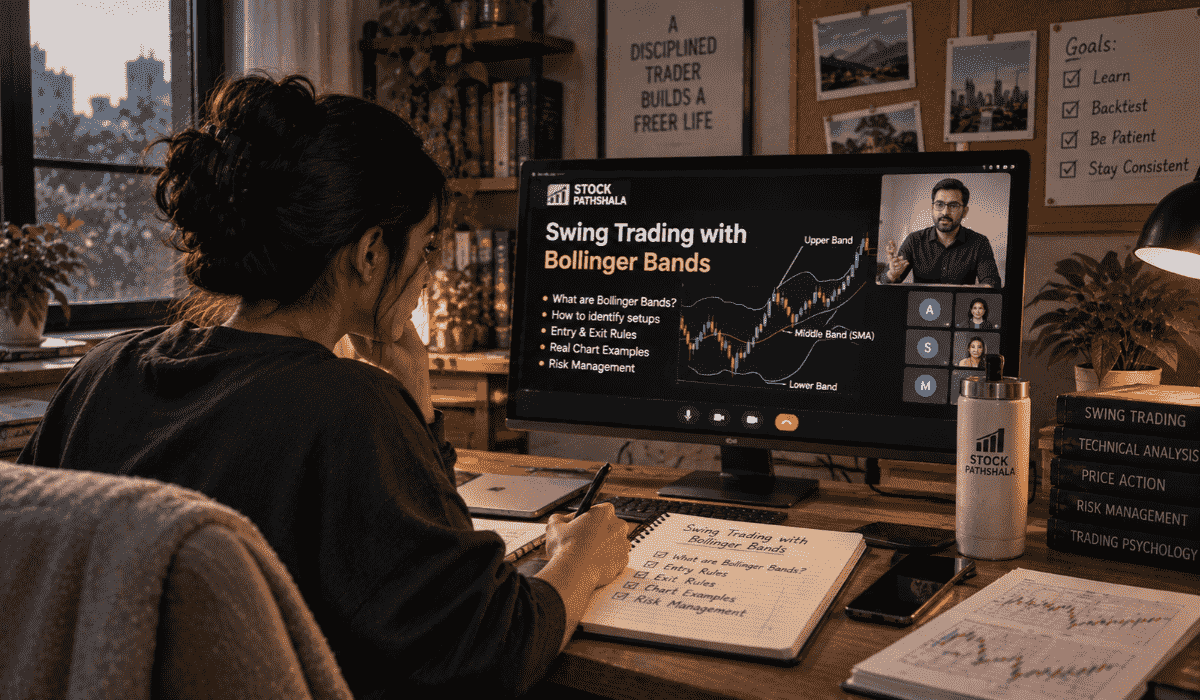
Fibonacci levels then mark the specific price zones to act on. Our post on swing trading with Bollinger Bands covers that side of the setup.
Where Could the Next Leg Run? A Quick Word on Extensions
Retracement levels help you find entries during a pullback.
Extension levels (127.2%, 161.8%) help you set realistic targets once price has already broken past the prior high.
They project how far the next leg of the move might reasonably run, based on the size of the previous swing.
Where Does Fibonacci Fall Short?
Fibonacci levels work best on a clean, clearly defined trend with an obvious swing high and low.
Because market dynamics change quickly, combining these retracements with swing trading with technical analysis provides a more rounded view when trends stall.
In a choppy, directionless stock, drawing Fibonacci levels becomes guesswork rather than analysis, since there is no meaningful move to measure.
Remember that Fibonacci levels are a probability tool, not a guarantee. Price does not respect every level every time.
That is why waiting for a confirming candle at the level matters more than trading the touch alone.
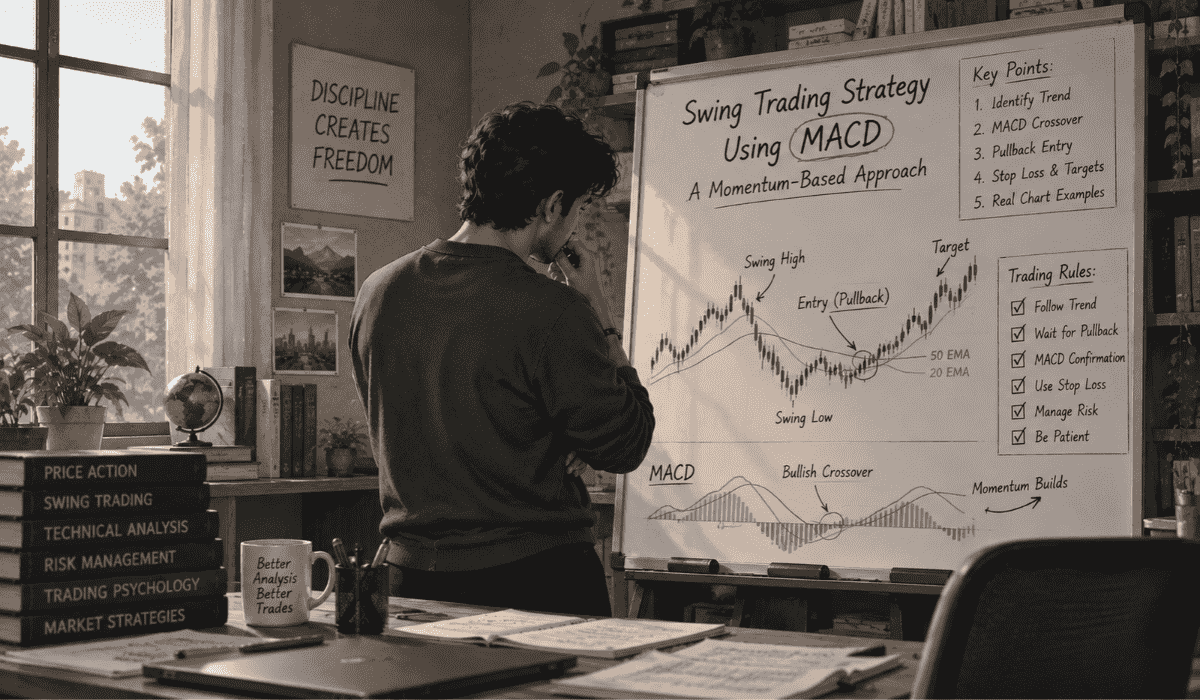
A second filter, such as a bullish crossover from a swing trading strategy using MACD, can help weed out weak touches.
Worked Example 2: What If Price Overshoots the Level?
Fibonacci levels are zones of likely reaction, not exact lines a stock is guaranteed to respect.
Suppose Axis Bank rallies from ₹1,050 to ₹1,180, and you expect support near the 50% level at ₹1,115.
Price actually dips slightly past that, to ₹1,105, brushing close to the 61.8% level at ₹1,100.
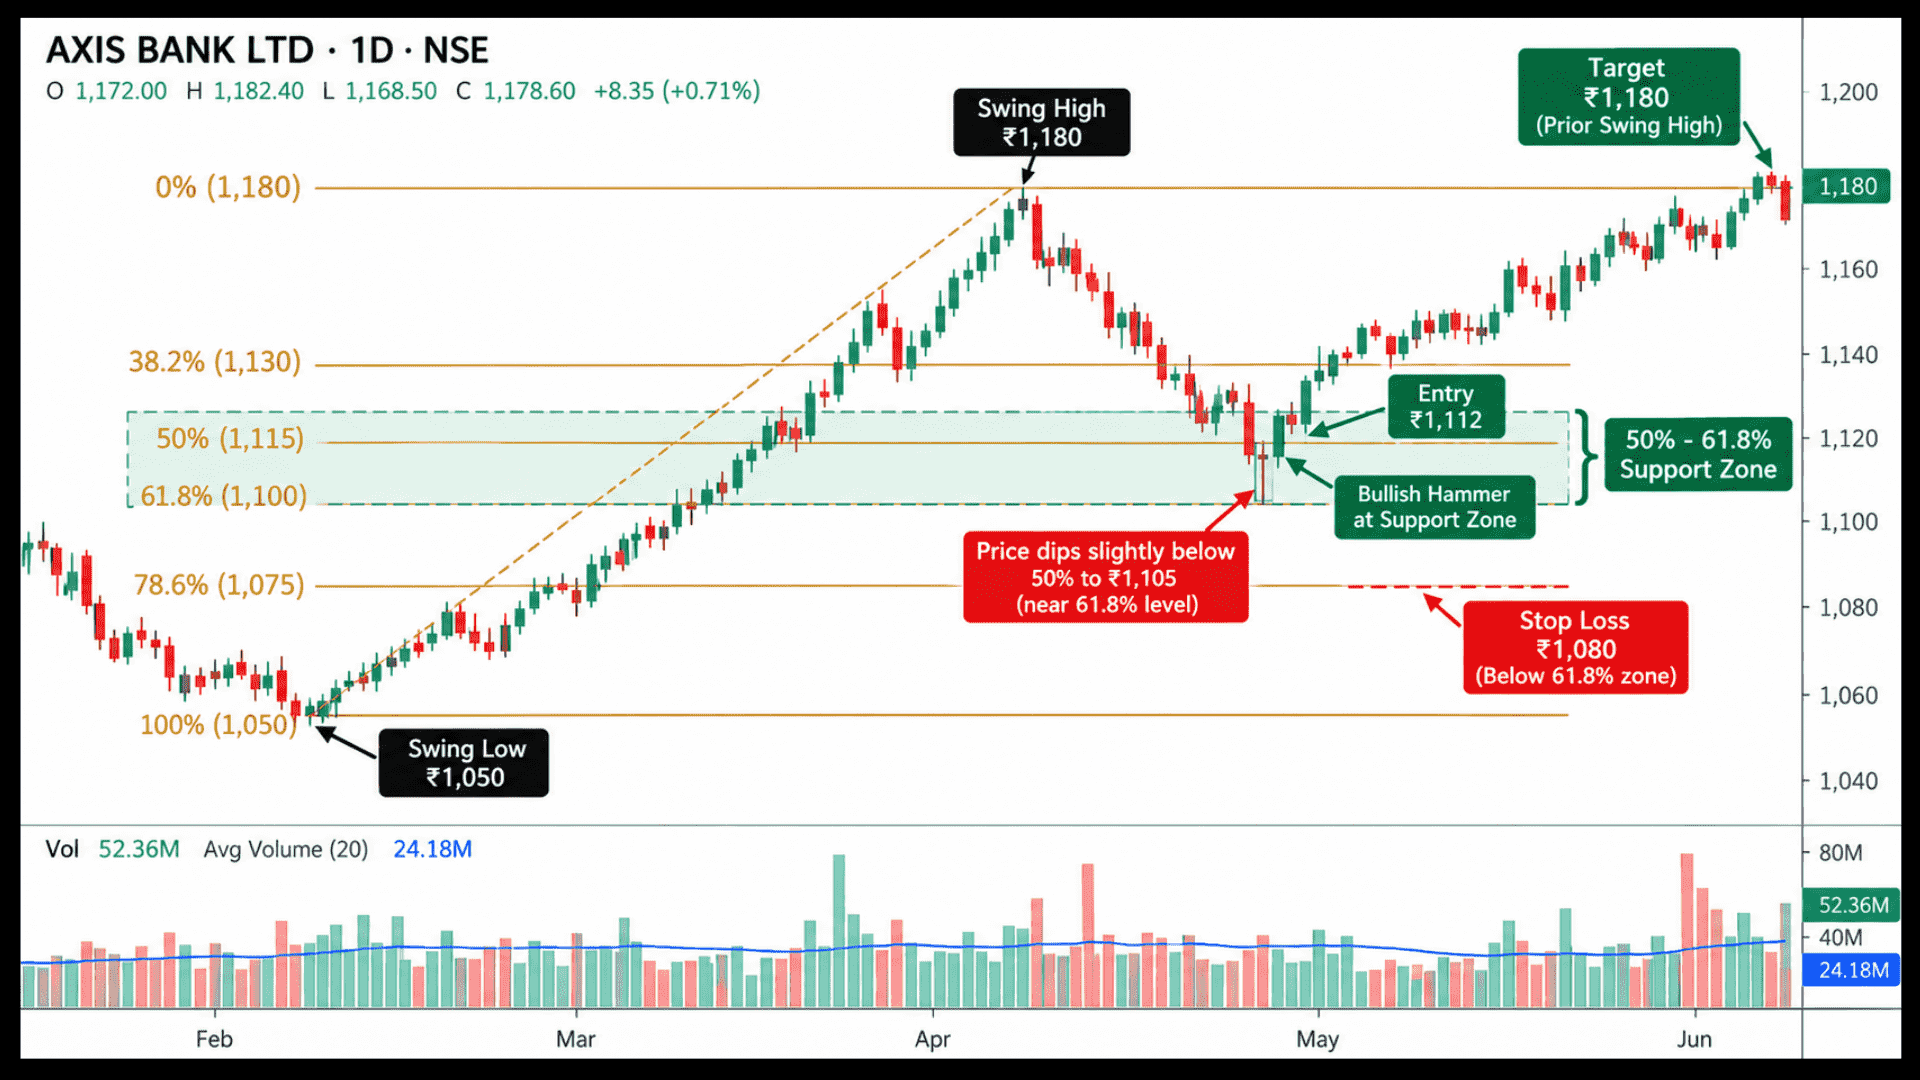
It then prints a bullish hammer and reverses. This is still a valid setup.
The pullback found support in the broader 50% to 61.8% zone rather than at one exact number, which is the more common outcome in practice.
Traders who insist on an exact touch at a single line often miss otherwise good setups.
Targets Beyond the Prior High: Putting Extensions to Work
When a stock is genuinely strong and likely to exceed its previous swing high, extension levels give you a data-based way to set targets beyond it.
The 127.2% and 161.8% extensions, measured from the original swing low and high, are the two most commonly used.
In the Reliance example, if the stock had continued past ₹2,950, the 127.2% extension would project a target near ₹3,032.
The 161.8% extension would project near ₹3,102, both measured from the original ₹2,720 to ₹2,950 swing.
These same ratios underpin Elliott Wave with Fibonacci projections and are central to how to trade harmonic patterns.
Why Do Some Fibonacci Levels Hold Better Than Others?
Fibonacci levels become noticeably more reliable when they line up with support or resistance that was already meaningful.
Examples include a prior consolidation zone or an old swing high.
A Fibonacci level sitting in isolation is a weaker signal than one that overlaps with a level price has already reacted to.
A rising EMA running through the same zone, as used in a swing trading EMA strategy, adds one more layer of confluence.
Ready to Practise Drawing These Levels on Live Charts?
Fibonacci retracement genuinely improves with repetition. Drawing it correctly and reading each reaction takes real screen time.
Our swing trading classes walk through setups like this live, on real Indian stocks, so you build the skill with guidance rather than trial and error.
Conclusion
Swing trading with Fibonacci retracements gives you a structured way to plan every part of a trade before you commit capital. Draw the tool in the right direction, focus on the 50% to 61.8% zone, and wait for a confirming candle instead of trading the touch. Place your stop beyond the next level and set targets at the prior high or the extension levels. Treat each level as a zone, not an exact line, and look for overlap with existing support or resistance. Used this way, Fibonacci turns guesswork into a repeatable, measurable swing trading process.
Frequently asked question
Before investing capital, invest your time in learning Stock Market.
Fill in the basic details below and a callback will be arranged for more information: