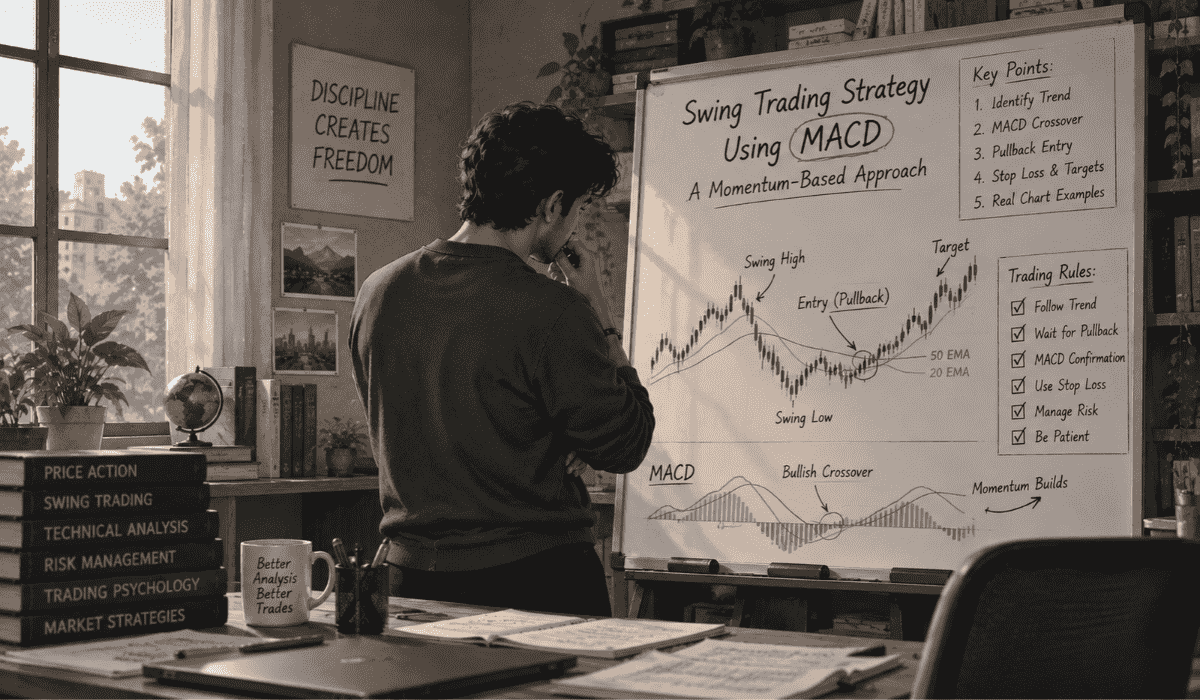



If you are looking for a reliable swing trading ema strategy, the 20 and 50 exponential moving average setup is one of the simplest and most repeatable methods you can use.
Ask ten experienced traders which indicator they check first, and most will point right to the EMA.
It’s a good place to build real screen-time once you understand the basics from our swing trading strategy for beginners guide.
This post goes deep on exactly one setup: the EMA pullback.
Not five different EMA tricks, just the one that experienced swing traders actually lean on the most.
Why EMA Beats a Simple Moving Average Here
An exponential moving average weighs recent price action more heavily than older price action.
A simple moving average treats every day equally.When evaluating technical indicators, many chartists incorporate a swing trading strategy using macd to cross-verify momentum shifts alongside moving averages.
That difference matters for swing trading specifically. You want an average that reacts reasonably fast to a genuine shift in momentum, without being so twitchy that it whipsaws you on ordinary daily noise.
The EMA sits in that sweet spot. If you’ve seen the faster-signal version of this idea before, our ema crossover for swing trading post covers that shorter-timeframe angle separately.
What the 20 EMA and 50 EMA Are Really Telling You
The 20 EMA tracks the short to medium-term trend, roughly the last month of price action.
Chart analysts often rely on technical frameworks like swing trading with Fibonacci retracements to further refine these multi-timeframe trend observations.
The 50 EMA tracks the broader trend, closer to the last two and a half months.
When the 20 EMA sits above the 50 EMA and both are sloping upward, that is your green light. It tells you the stock is in an established uptrend, which is exactly the condition a pullback strategy needs to work.
The EMA Pullback Setup, Step by Step
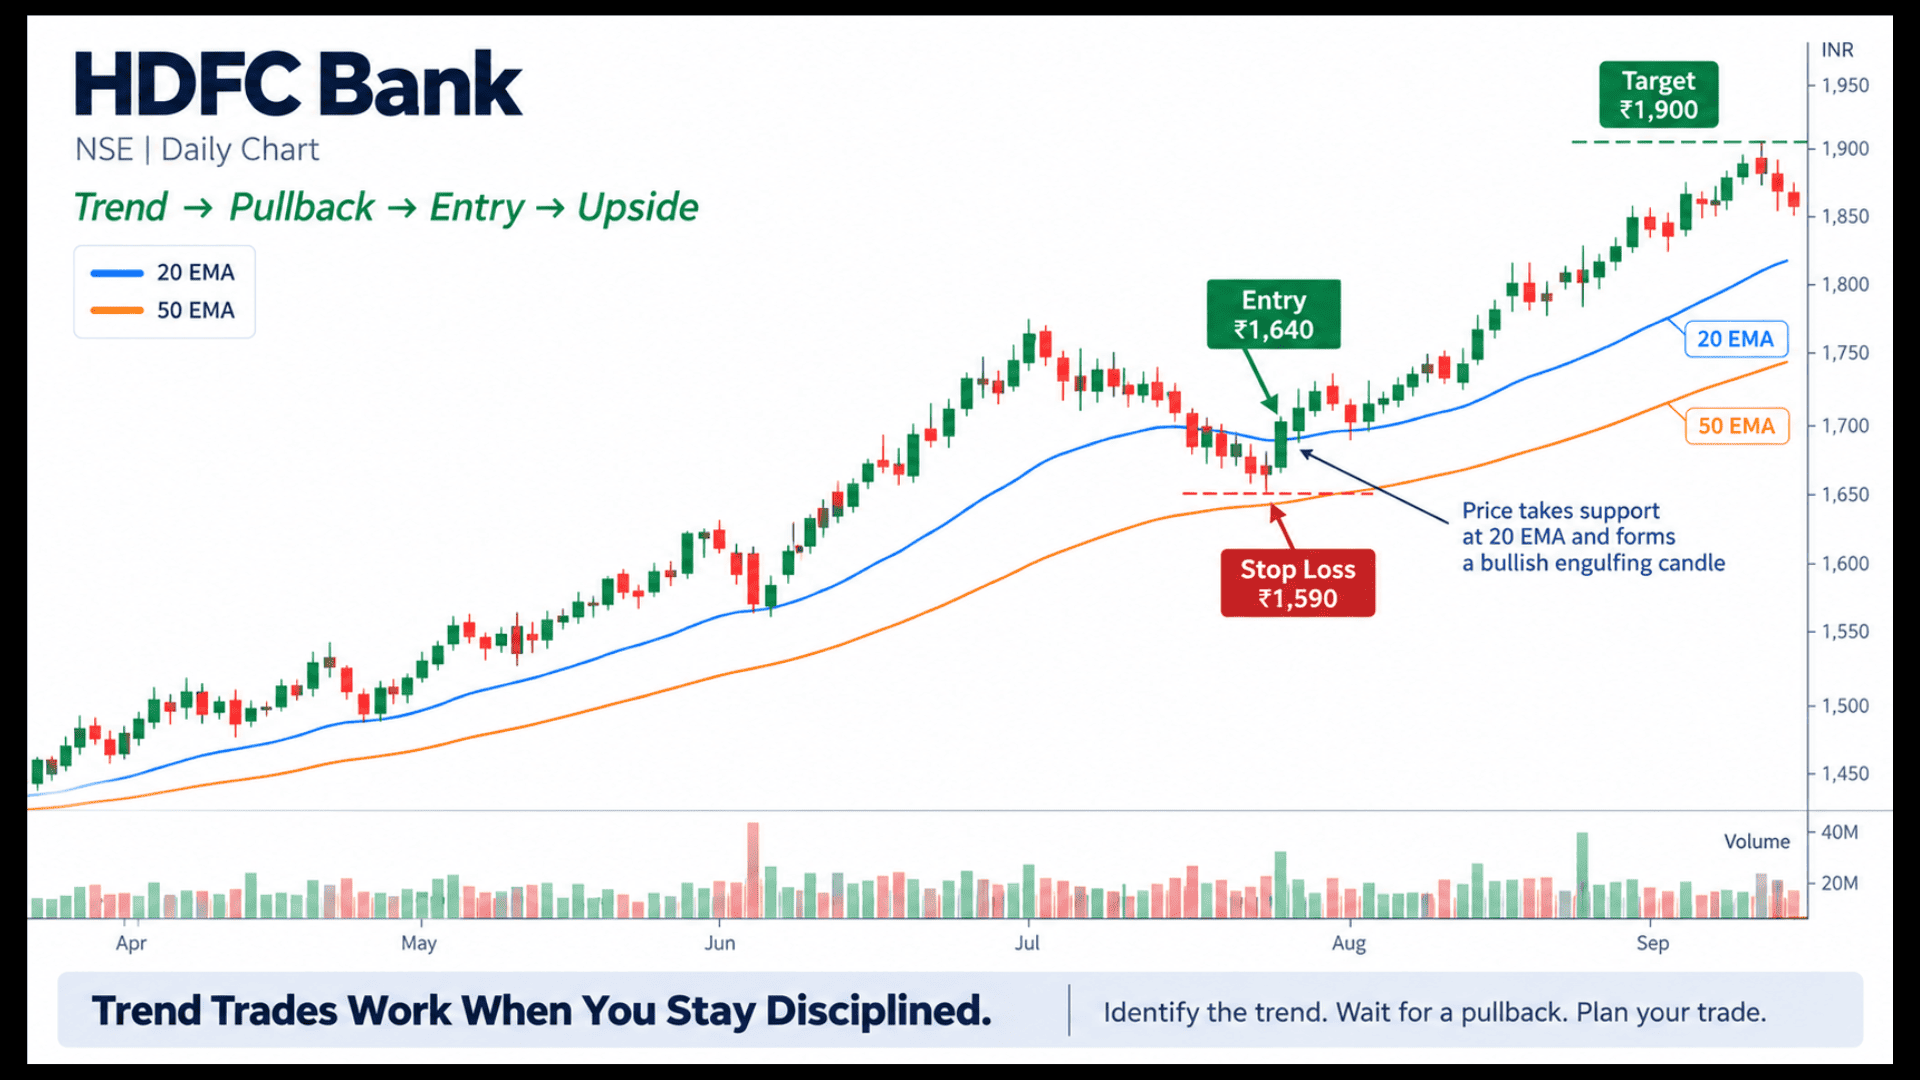
Condition: Stock is in a clear uptrend. 20 EMA above 50 EMA on the daily chart, both sloping up, with a pattern of higher highs and higher lows.
Understanding what is swing trading helps participants identify these structured trend continuations rather than chasing random intraday price spikes.
Entry trigger: Price pulls back toward the 20 EMA zone (not necessarily touching it exactly) and forms a bullish reversal candle there, such as a hammer or a bullish engulfing candle.
Entry: Buy on a break above the high of that reversal candle, at the market open the following session.
Stop loss: Just below the low of the pullback, or below the 50 EMA if the pullback runs deeper.
Target: Prior swing high as a first target, or trail the stop below the 20 EMA as the trade develops if the trend is still strong.
A Real EMA Pullback Trade, Walked Through
Say ICICI Bank is trending up with the 20 EMA at ₹1,190 and the 50 EMA at ₹1,150, both rising.
The stock pulls back from ₹1,240 down to ₹1,195, right into the 20 EMA zone, and prints a bullish engulfing candle with its high at ₹1,205.
You enter on a break above ₹1,205. Your stop sits at ₹1,180, just under the pullback low.
Your first target is the prior high near ₹1,240, giving you roughly a 1:1.4 risk-to-reward on this particular setup, which improves further if you trail the stop and let part of the position run.
The One Filter That Makes This Setup Stronger
The EMA pullback is strong on its own but gets meaningfully better with one extra filter: volume.
Look for the pullback to happen on lower-than-average volume (a sign of a healthy pause, not real selling pressure) and the breakout candle to happen on higher-than-average volume.
To further minimize false signals when combining indicators, many traders apply a proven swing trading strategy using rsi to check for momentum exhaustion before entering.
Some traders also add RSI as a secondary confirmation, checking that RSI has not dropped into deeply oversold territory during the pullback, since that can signal a trend change rather than a routine pause.
Incorporating elements of swing trading with technical analysis into your daily checklist ensures that multiple indicators agree before you commit capital.
If you want to build that combination out further, our dedicated post on swing trading strategy using RSI covers that setup separately.
Mistakes That Quietly Destroy This Setup?
The most common one is entering too early, before the reversal candle actually confirms.
A pullback that is still falling toward the EMA is not yet a signal. Wait for the candle to close and the break to actually happen.
The second is ignoring the broader trend context. This setup is built for uptrends.
Trying to force the same pullback logic in a choppy, sideways market will produce a lot of false signals — which is also why it’s worth asking honestly whether is swing trading profitable for your own market conditions before you commit to a style.
Getting Position Sizing Right on This Trade
Once you know your entry and stop loss, position sizing becomes simple arithmetic rather than a guess.
If you are risking 1% of a ₹2,00,000 account, that is ₹2,000 at risk on the trade. In the ICICI Bank example above, the risk per share was ₹25 (entry ₹1,205 minus stop ₹1,180).
Dividing ₹2,000 by ₹25 gives a position size of 80 shares.
This matters more than it sounds like it should. Traders who size positions based on how confident they feel about a setup, rather than this kind of fixed calculation, tend to take oversized positions on trades that eventually lose, since confidence and outcome are not the same thing.
When the EMA Pullback Fails (And Why That’s Okay)
Not every pullback resolves the way the ICICI Bank example did.
Sometimes price pulls back into the 20 EMA zone, prints what looks like a bullish reversal candle, and then simply keeps falling through the 50 EMA and beyond.
Unusual contractions or volatility expansions that precede these failed setups can often be spotted early when swing trading with Bollinger Bands is used alongside moving averages.
This is exactly why the stop loss placement matters as much as the entry trigger.
Unforgiving downward price action often invalidates standard technical boundaries, making a disciplined swing trading strategy in bear market cycles essential for capital preservation.
A pullback that fails should cost you a small, predefined amount, not an open-ended loss you are hoping will turn around.
If your stop gets hit, the setup did not work this time. That is a normal, expected part of trading this pattern, not a reason to abandon the strategy after one loss.
How Often Should This Setup Actually Show Up?
In a genuinely trending market, a watchlist of fifteen to twenty liquid stocks might produce three to six clean EMA pullback setups in a typical month.
In a choppier, more sideways market, that number drops noticeably, sometimes to one or two.
This is a useful gut check. If you find yourself taking this setup ten or more times a month, you are very likely forcing entries on pullbacks that do not actually meet the trend and confirmation criteria described above.
Conclusion
The 20/50 EMA pullback works because it does one thing well: it lets you buy strength after a pause, with a clear invalidation point if you’re wrong. The edge isn’t the indicator itself, it’s the discipline of waiting for trend, pullback, and confirmation candle to line up together before you act. Skip any one of those three and the setup stops being a setup. Treat losses as the cost of staying in the game, size every trade the same fixed way, and this becomes one of the more repeatable patterns you can build real consistency around. If you’d rather build this pattern recognition with guided feedback instead of alone, our swing trading mentorship walks through live setups with traders in real time.
Frequently asked questions
Before investing capital, invest your time in learning Stock Market.
Fill in the basic details below and a callback will be arranged for more information: