

When it comes to swing trading with Bollinger Bands, the indicators you choose matter immensely. Bollinger Bands do something most indicators do not-they adjust themselves automatically based on current stock volatility.
They widen when price is moving fast and tighten when it slows down.
That built-in flexibility is exactly why swing trading with Bollinger Bands works well across very different market conditions.
This post covers the two setups worth actually using: the band bounce and the squeeze breakout.
What Are Bollinger Bands Really Made Of?
A Bollinger Band consists of three lines: a middle band (usually a 20-period simple moving average), an upper band, and a lower band.
Each outer band is typically set two standard deviations away from that middle line.
This setting is built mainly for daily charts, the most common of the swing trading time frames.
When the bands are wide apart, the stock is volatile.
When they contract close together, the stock has gone quiet, and quiet periods often precede a sharp move in either direction.
Setup 1: The Band Bounce, Buying Where Sellers Run Dry
This setup works best in a stock that is range-bound or in a mild, gently sloping trend, not in a stock already trending hard in one direction.
Because the rules are simple, it fits neatly into a swing trading strategy for beginners.
New market participants often ask what is swing trading before committing capital to these short-to-medium-term setups.
Entry condition: Price touches or briefly pierces the lower band, then closes back inside it with a bullish reversal candle.
Pairing this with an oversold reading from a swing trading strategy using RSI adds an extra layer of confirmation.
Entry: Buy on confirmation of that close back inside the band.
Stop loss: Just below the low of the touch, or below the lower band itself if it has since moved up.
Target: The middle band first, then the upper band if momentum continues.
How Did L&T Bounce Off the Lower Band?
Suppose Larsen & Toubro has been trading in a loose range for three weeks, oscillating between the upper and lower Bollinger Bands without breaking out either side.
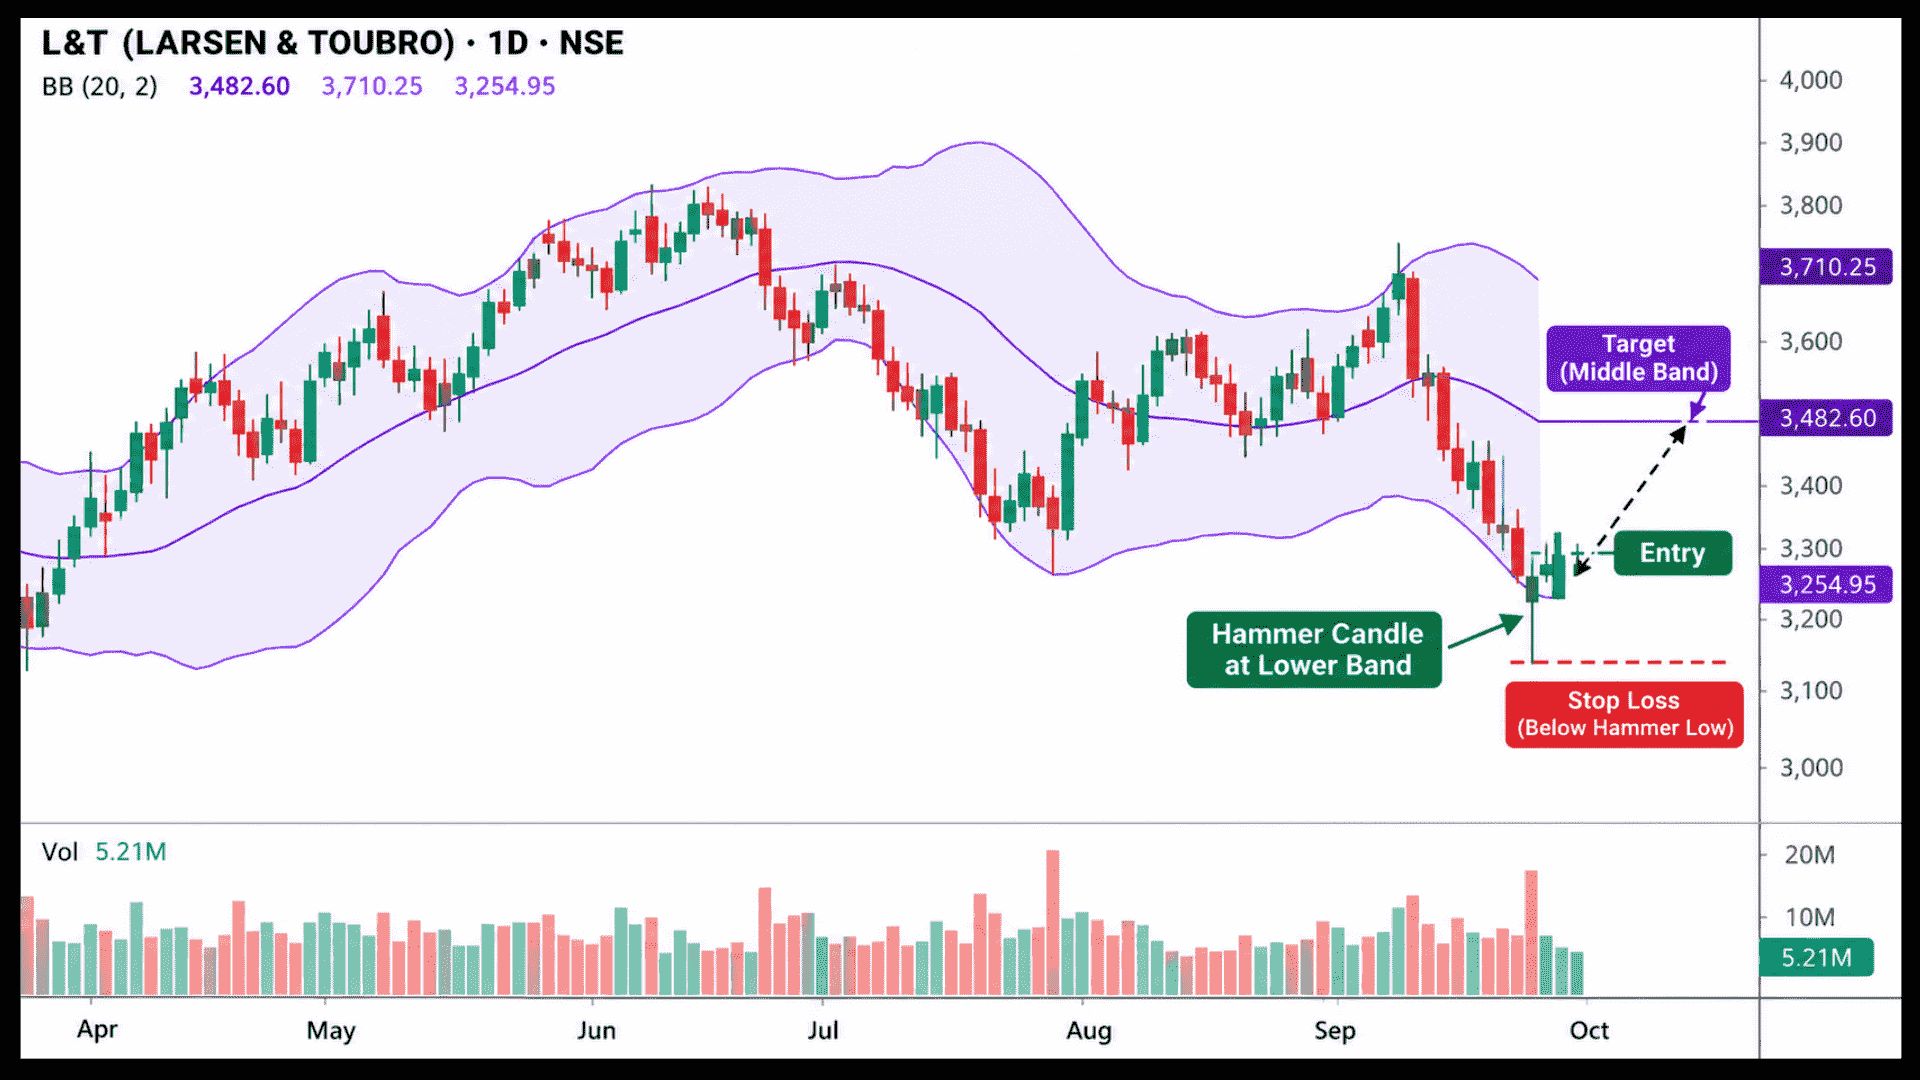
Price dips to touch the lower band at ₹3,320, forms a bullish hammer candle, and closes at ₹3,340, back inside the band.
You enter at ₹3,345. Stop loss goes at ₹3,300, just under the hammer’s low.
The stock climbs back toward the middle band around ₹3,410 over the next six sessions, where you book the trade.
That captures roughly ₹65 per share against a risk of ₹45.
Setup 2: The Squeeze Breakout, Where the Big Moves Hide
This is the setup traders get more excited about, because it tends to precede the bigger moves.
Execution: Buy on the breakout candle’s close, or wait for confirmation during the next session.
Risk management: Place your stop loss below the low of the squeeze range.
Mastering swing trading risk management at this stage prevents you from getting caught on the wrong side of a false breakout.
Profit goals: Note that Bollinger Bands do not provide a fixed price target the way a pattern like cup and handle does.
Traders often look for alternative technical formations like a cup and handle swing trading strategy when they need a reliable measured move.
Stop loss: Below the low of the squeeze range.
Target: Bollinger Bands do not give you a fixed price target the way a pattern like cup and handle does.
So many traders trail their stop using the middle band as the trade develops, letting the position run as long as price stays above it.
Traders who prefer a fixed exit rule can look at the 20 percent strategy swing trading approach instead.
Why Does the Squeeze Matter More Than People Expect?
A tightening Bollinger Band is really just a visual way of showing that volatility has compressed. Markets rarely stay quiet forever.
The longer and tighter the squeeze, the more forceful the eventual move tends to be, in either direction.
That is exactly why confirming the breakout direction with volume matters so much here.
Entering before the actual breakout, just because the bands look tight, is guessing the direction rather than trading it.
Disciplined market participants avoid this trap by using swing trading with technical analysis to wait for structured, rule-based confirmation.
Can Fibonacci Fix the Missing Target Problem?
Mastering swing trading with Bollinger Bands requires understanding their limits: while they are strong for reading volatility and rough entry zones, they do not give you precise profit targets on their own.
That is where combining them with Fibonacci retracement levels helps: the bands time the entry, Fibonacci sets realistic, measured targets.
Mastering swing trading with Fibonacci retracements allows you to pinpoint exact exit zones once volatility indicators trigger your entry.
If you want to build that combination out fully, our post on swing trading with Fibonacci retracements covers the target-setting side in depth.
When Do Bollinger Bands Lie to You?
Band bounce setups can fail badly in a genuinely strong trending stock, where price can “walk the band”.
In that case, price stays pinned near the upper or lower band for an extended stretch without ever bouncing back to the middle.
Treating every band touch as an automatic reversal signal in that kind of stock leads to repeated small losses.
This risk multiplies significantly if you attempt to force a standard swing trading strategy in bear market cycles without recognizing the danger of prolonged trend continuation.
Squeeze breakouts also produce false starts occasionally, where price breaks out, then falls back inside the bands within a day or two.
A confirmed close outside the band, not just an intraday touch, helps filter out some of these fakeouts.
A Second Worked Example: Titan’s Squeeze Breakout in Practice
Suppose Titan Company has been trading in an increasingly narrow range for eighteen sessions, the Bollinger Bands visibly pinching closer together each week, a classic squeeze.
Price has been oscillating between ₹3,180 and ₹3,240 with no real direction.
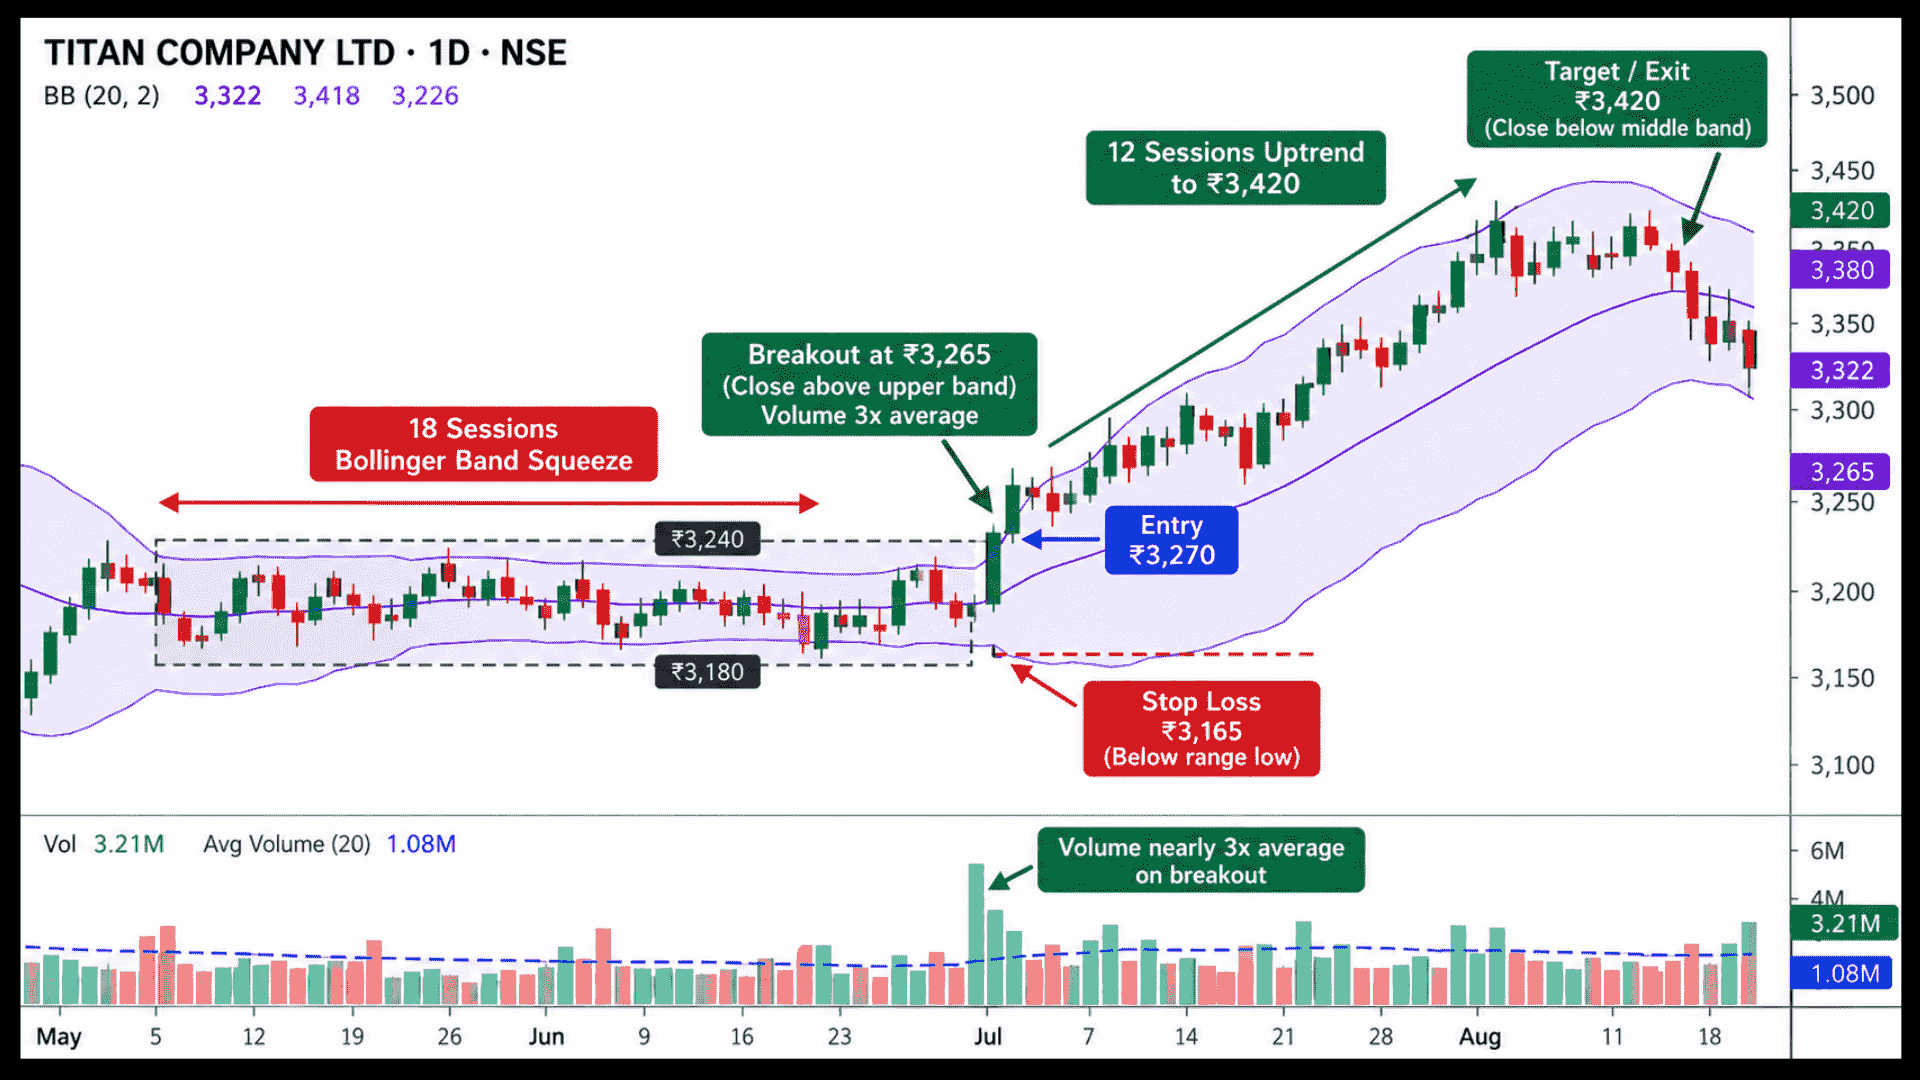
On session nineteen, price closes at ₹3,265, outside the upper band, with volume nearly triple the average of the past two weeks. This is your confirmed breakout.
You enter at ₹3,270, with your stop at ₹3,165, below the squeeze range low.
Over the following twelve sessions, the stock trends up to ₹3,420, with the middle band trailing beneath it the entire way.
That gives you a logical point to book profits as price finally closes back below that middle line.
Why Is Volume Non-Negotiable in This Setup?
A Bollinger Band squeeze does not tell you which direction the eventual breakout will go, only that a move is likely coming.
So volume confirmation on the actual breakout candle carries more weight here than in trend-following setups like the EMA pullback, covered in our swing trading EMA strategy guide.
Where the trend direction is already established before you enter.
Some traders also check momentum with a swing trading strategy using MACD before committing to the breakout direction.
A breakout on weak or average volume is a real warning sign here specifically.
This factor carries extra weight here compared to setups where the broader trend already dictates direction.
Band Width: Your Early Warning Radar
Beyond watching for the squeeze to break, simply tracking how tight the bands have become, relative to their own recent history, gives you an early watchlist signal.
Stocks with the tightest Bollinger Band width right now are the ones most likely to make a sharp move in the coming days, even before that move has started.
Keeping a short list of these tightly-coiled stocks each week is a practical way to stay ahead of the breakout rather than reacting to it after the fact.
Can You Spot the Squeeze Before Everyone Else?
A squeeze looks obvious on a chart once the breakout has already happened.
Spotting it while it is still forming, and confirming the breakout direction correctly, is a different skill entirely.
Our Swing Trading Classes cover setups like this live, on real Indian stocks, every trading day.
Conclusion
Successfully swing trading with bollinger bands comes down to mastering two clean, repeatable setups: the band bounce for range-bound stocks and the squeeze breakout for catching bigger moves. The bounce rewards patience near the lower band, while the squeeze rewards waiting for a confirmed close and a real volume surge. Neither works blindly, especially in stocks that walk the band. Use the middle band to trail stops, pair the bands with Fibonacci for targets, and track band width weekly. Practised consistently in swing trading classes, these setups become a disciplined part of your trading process.
Frequently asked questions
Before investing capital, invest your time in learning Stock Market.
Fill in the basic details below and a callback will be arranged for more information: