



MACD is one of the oldest technical indicators still in wide use today, and for swing traders using a swing trading strategy using MACD, it earns that spot honestly.
A swing trading strategy using MACD gives you something the EMA pullback setup does not: a clean, visual signal for momentum shifting direction, not just price direction.
Among every indicator-based swing trading strategy, few are as easy to read at a glance.
This post breaks down exactly how to use MACD for swing entries and exits, without turning it into a math lecture.
What Is MACD Actually Telling You?
MACD is built from two EMAs (typically 12-period and 26-period) plotted as the MACD line, with a 9-period EMA of that line plotted as the signal line.
The histogram shows the gap between the two.
In a sense, MACD is a refined EMA crossover for swing trading, tracking the distance between two EMAs rather than just the point where they cross.
If you already follow a swing trading EMA strategy, MACD fits in easily, since it is built from the same moving averages.
You do not need to calculate any of this by hand. Every charting platform plots it for you.
What matters is reading it correctly:
- MACD line above signal line: momentum is turning bullish.
- MACD line below signal line: momentum is turning bearish.
- MACD line above zero: the stock is in a broader uptrend.
- MACD line below zero: the stock is in a broader downtrend.
How Does the Swing Trading MACD Setup Work?
Each rule below is visual and easy to check, which makes this a practical swing trading strategy for beginners.
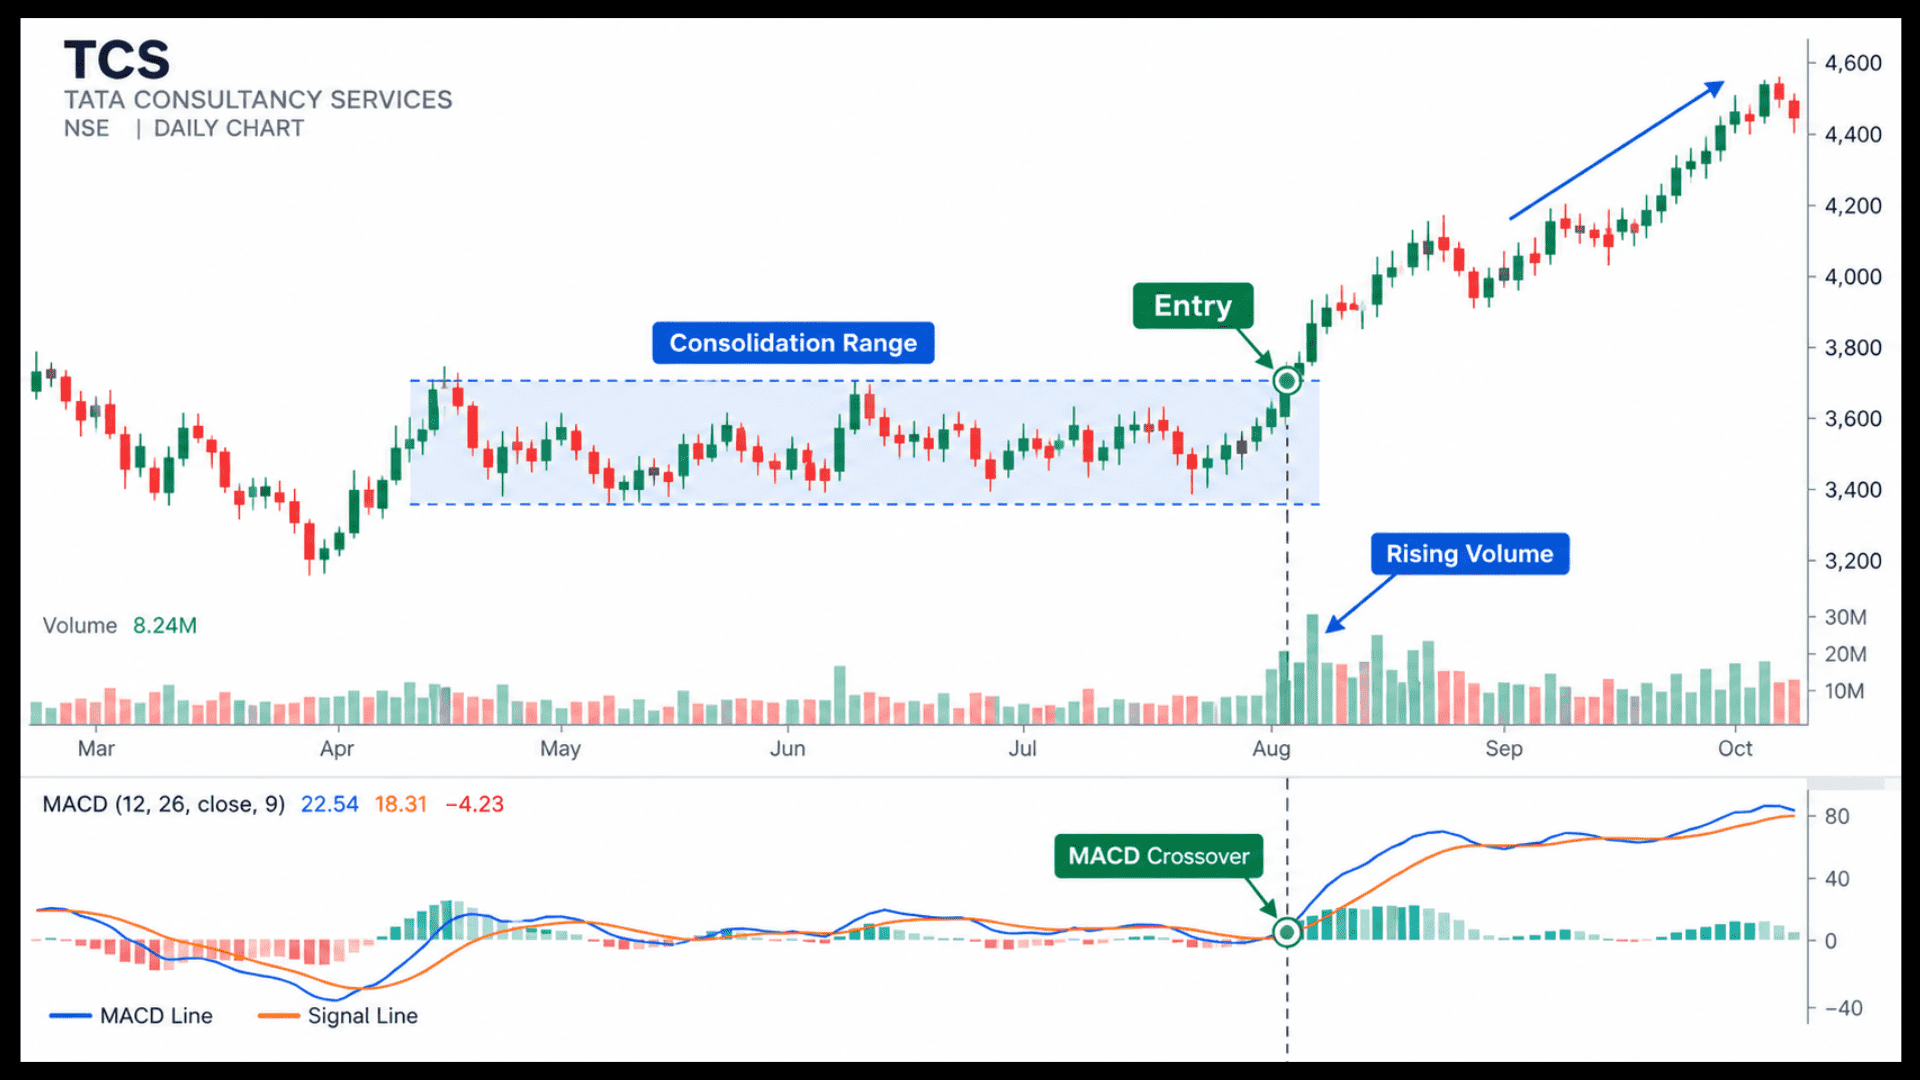
Step 1: Confirm the broader trend. Check that MACD is above the zero line on the daily chart.
This foundational step anchors your broader approach to swing trading with technical analysis before looking for granular triggers.
This tells you the stock’s medium-term momentum is already positive, which is the environment this setup works best in.
Among common swing trading time frames, the daily chart is where this setup gives its most reliable signals.
Step 2: Wait for a MACD line crossover above the signal line. This is your momentum trigger.
It usually happens as the stock comes out of a small pullback or consolidation.
Step 3: Confirm with price action. The crossover should ideally line up with price breaking a short-term resistance level or a prior swing high.
It should not happen in isolation while price is still falling.
Step 4: Enter on the day of confirmation, or the next session’s open if you are checking charts after market close.
Step 5: Exit when MACD crosses back below the signal line, or when price hits your predetermined target, whichever comes first.
Worked Example: How Would This Play Out on Infosys?
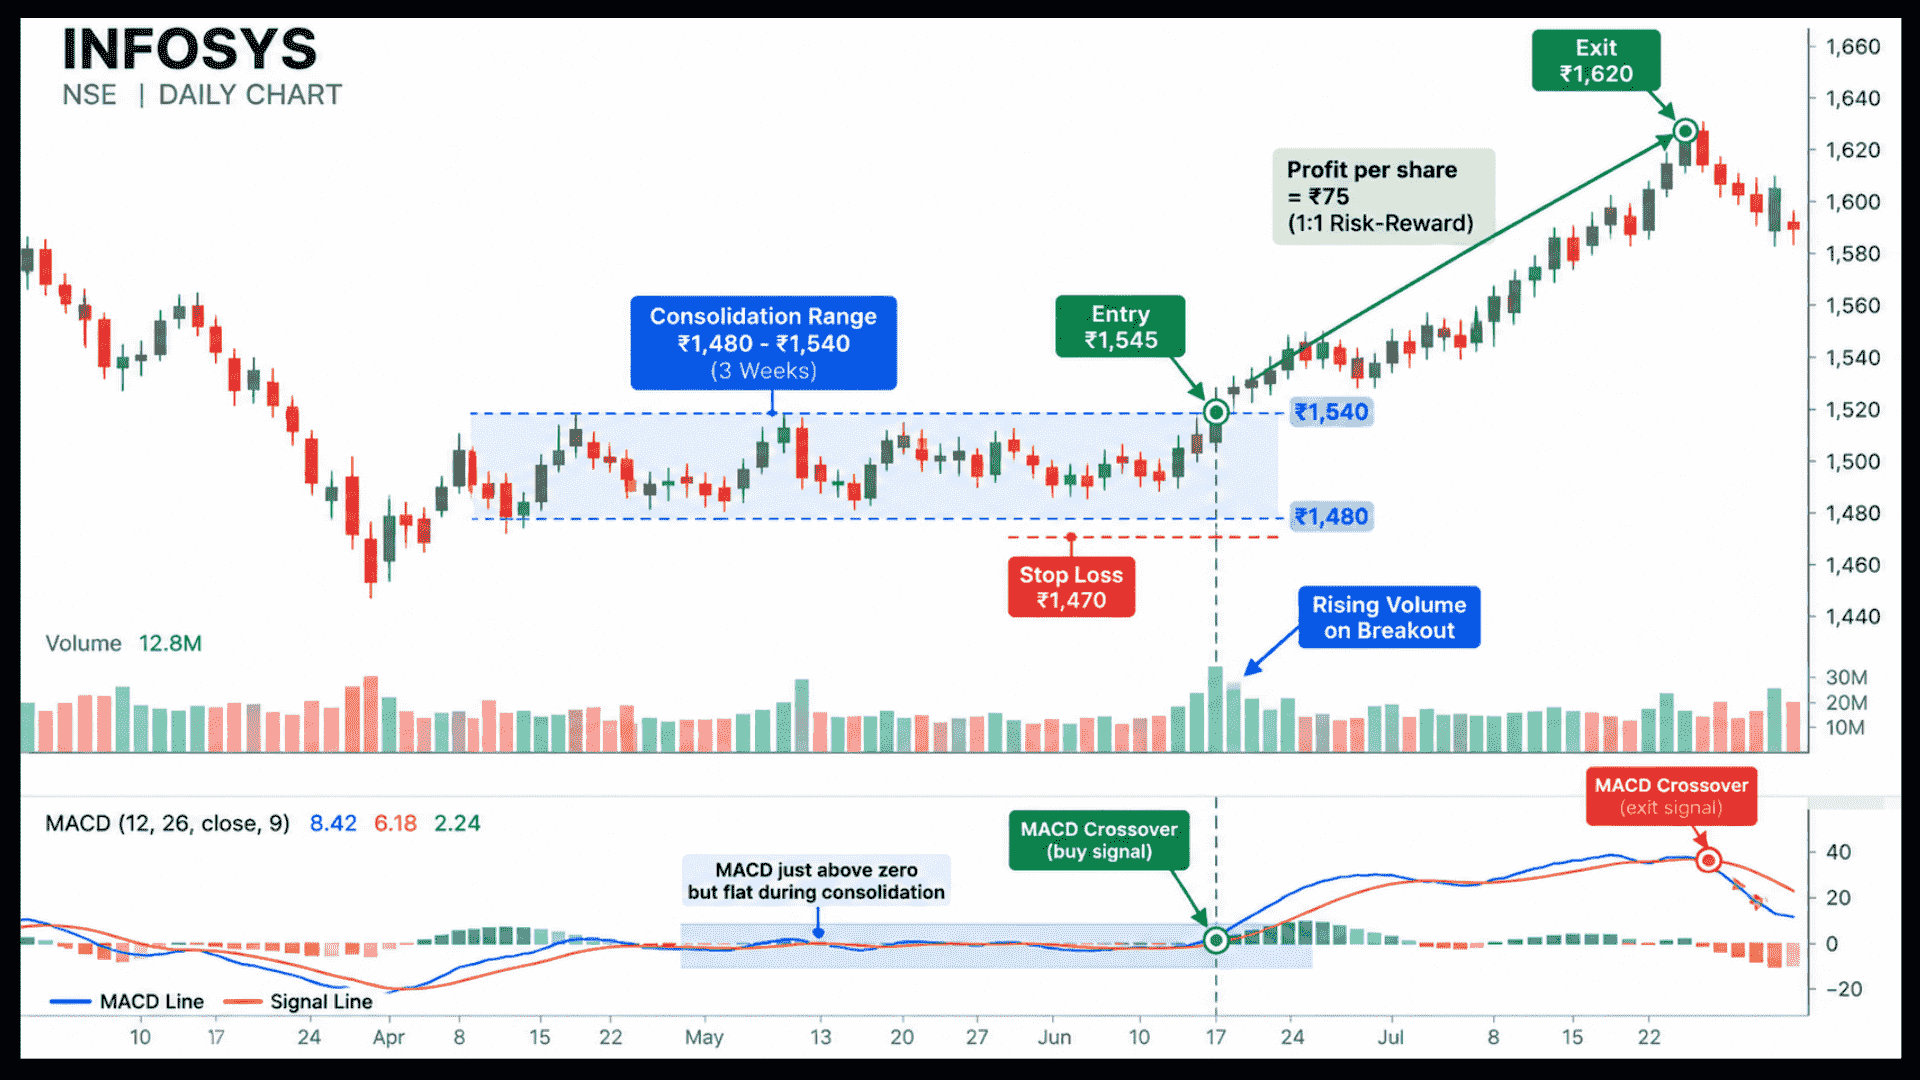
Suppose Infosys has been consolidating between ₹1,480 and ₹1,540 for three weeks, with MACD sitting just above zero but flat.
The stock then breaks above ₹1,540 on rising volume, and on the same day MACD crosses above its signal line for the first time in the consolidation.
You enter at ₹1,545. Your stop loss goes below the recent consolidation low, around ₹1,470.
Over the following two weeks, the stock climbs to ₹1,620 before MACD starts curling back toward its signal line.
You exit as the crossover happens, booking a gain of roughly ₹75 per share on a risk of ₹75.
That is a straightforward 1:1, which could have been better with a tighter stop closer to the breakout level.
Can MACD Divergence Warn You Before the Trend Turns?
Beyond simple crossovers, watch for divergence. Most books about swing trading treat it as an advanced signal, but it is simple to spot.
If price makes a new high but MACD makes a lower high than its previous peak, that is bearish divergence.
It is a warning that the trend’s momentum is fading even though price is still rising.
Recognizing these momentum shifts helps prevent the false breakouts often encountered when trading a cup and handle swing trading strategy prematurely.
It often shows up before a swing high forms, which makes it useful as an early exit signal on positions you are already holding.
How Do You Combine MACD with Other Tools?
MACD works reasonably well alone, but pairing it with RSI adds a second layer of confirmation, particularly around overbought and oversold extremes.
If you already use RSI in your swing trading, our post on swing trading strategy using RSI covers that setup in full.
The two combine naturally: MACD for trend direction, RSI for timing the exact entry within that trend.
Mastering a reliable swing trading strategy using rsi ensures you do not enter positions blindly when a market is overextended.
Where Does This Setup Struggle?
Why Do MACD Signals Arrive Late?
MACD is a lagging indicator by design, since it is built from moving averages.
That means signals arrive after the move has already started, not before it.
This delay can become particularly punishing if you rely on lagging indicators while deploying a swing trading strategy in bear market environments where trend reversals happen with extreme speed.
In genuinely fast, sharp moves, you will often catch the middle of the swing rather than the very start.
What Happens in Sideways Markets?
If you are figuring out how to learn swing trading, you should know that it also produces frequent false signals in sideways, range-bound markets.
Understanding what is swing trading requires recognizing that these strategies rely on directional momentum rather than flat price consolidation.
There, the MACD line whipsaws across the signal line repeatedly without any real trend developing.
Skip MACD-based entries entirely when a stock is stuck in a tight range with no clear direction.
Conversely, traders who utilize swing trading with Bollinger Bands find it much easier to capitalize on range-bound contractions and expansions during quieter market phases.
Why Should You Read the MACD Histogram, Not Just the Lines?
Most beginners look only at the MACD line crossing the signal line and ignore the histogram underneath.
The histogram is really just a visual of the gap between those two lines. Almost every swing trading book covers crossovers, but few give the histogram enough attention.
It is worth watching closely, because it often shifts direction a day or two before the actual crossover happens.
If the histogram bars are shrinking toward zero while price is still climbing, that is an early warning that momentum is fading.
This shows up even before the MACD line has crossed below the signal line.
Traders who wait for the full crossover sometimes give back part of their gains that a histogram reading would have flagged earlier.
A Second Worked Example: Can MACD Help You Exit a Winning Trade?
Entries get most of the attention in MACD discussions, but exits matter just as much.
Suppose you bought Larsen & Toubro at ₹3,180 after a bullish MACD crossover, and the stock has since climbed to ₹3,340, a healthy gain.
MACD is still above its signal line, so by the basic exit rule you would still be holding.
But the histogram has been shrinking for three straight sessions, a sign that momentum is cooling even though the crossover itself has not happened yet.
A more cautious trader might book partial profits here rather than waiting for the full signal-line crossover, protecting gains against a sudden reversal.
How Should You Size Positions on MACD-Based Trades?
Since MACD entries are momentum-based rather than tied to a specific chart level like a support zone, stop losses on this setup tend to sit a bit further from entry than, say, an EMA pullback trade.
Size your position accordingly.
A wider stop means a smaller position size for the same fixed percentage risk, which is simple arithmetic but easy to forget in the moment.
Is swing trading profitable? Over time, that depends far less on the indicator you pick and far more on this kind of risk discipline.
Ready to See MACD Signals Play Out on Live Charts?
Spotting a clean MACD crossover on a chart you already know the outcome of is easy.
Recognising the same setup live, before you know how it ends, takes practice.
If you are working out how to learn swing trading properly, that live practice is where most of the progress happens, and guided swing trading mentorship shortens the learning curve.
Our Swing Trading Classes cover indicator-based setups like this one with live daily sessions on real Indian stocks.
Conclusion
A swing trading strategy using MACD works best when you keep it simple.
Trade bullish crossovers only when MACD is above the zero line, and confirm each signal with a price breakout.
Additional confirmation can also be gained by evaluating market structure through swing trading with Fibonacci retracements during corrective phases
Exit on the reverse crossover or at your target, whichever comes first. Watch the histogram and divergence for early signs of fading momentum.
Avoid MACD entries in sideways, range-bound stocks, where false signals are common.
Pair MACD with RSI or key price levels, leverage professional Swing Trading Mentorship, and size every position around your stop loss to keep risk under control.
Frequently asked question
Before investing capital, invest your time in learning Stock Market.
Fill in the basic details below and a callback will be arranged for more information: