



Effective swing trading analysis shouldn’t start and end with a single stock’s chart.
Most content jumps straight into indicators, but real swing trading analysis actually begins earlier with the broader market and sector trends, narrowing down step by step.
Skipping those earlier steps is exactly how a technically clean setup ends up failing because the wider market was working against it the entire time.
If you are new and still asking what swing trading is, this post lays out the full top-down process, in order.
Level 1: Is the Broader Market on Your Side?
In swing trading analysis, the broader market comes before any individual stock. Check the trend on Nifty 50 and, if relevant to your watchlist, Bank Nifty as well.
Is the broader market in a confirmed uptrend, a confirmed downtrend, or genuinely range-bound and directionless right now?
This single step changes how aggressively you should be looking for new swing trades.
In a strong broad market uptrend, bullish setups on individual stocks have real wind behind them.
In a falling or choppy broad market, even a clean-looking bullish setup carries meaningfully more risk than the chart alone suggests.
Level 2: Which Sectors Are Leading the Pack?
Within any given market environment, sectors do not all move together.
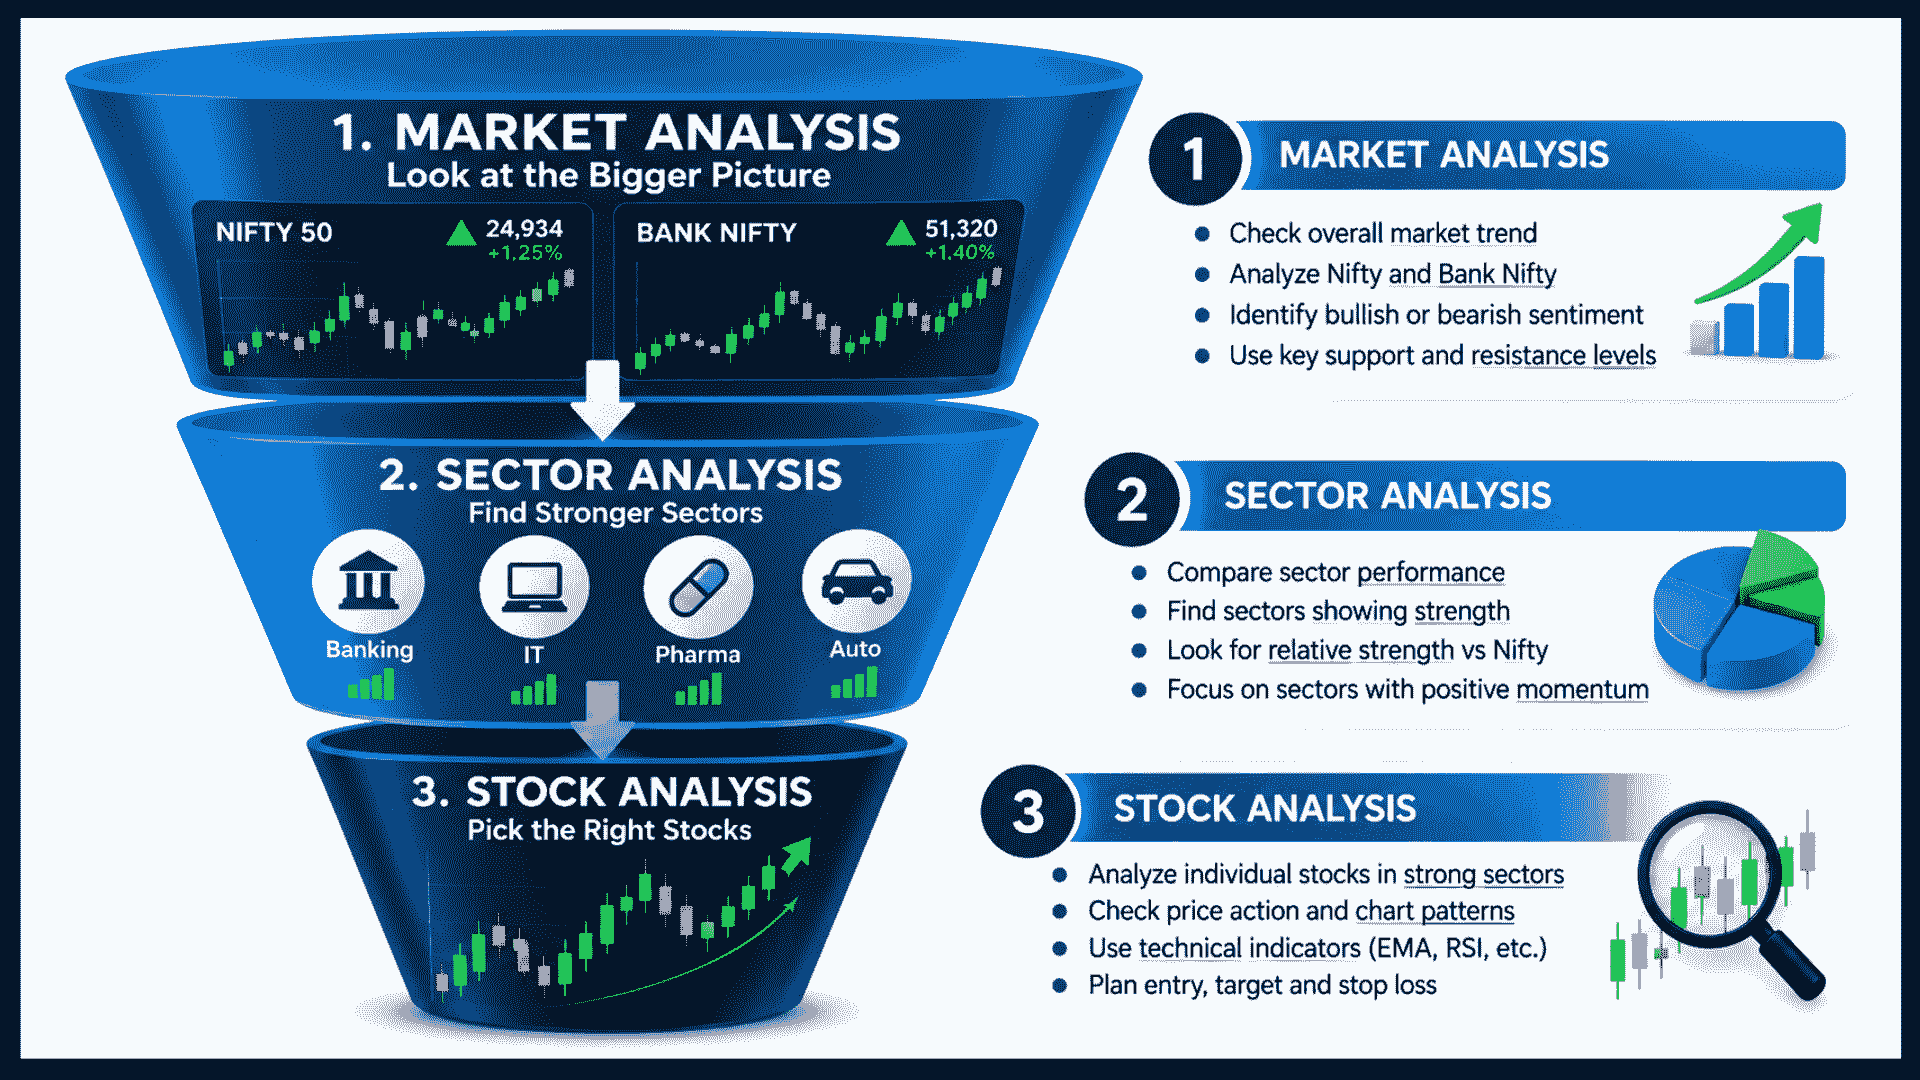
Some sectors lead a rally. Others lag or even fall while the broader index climbs.
A simple relative strength check, comparing a sector index (banking, IT, pharma, auto, and so on) against Nifty over the past month, narrows your search.
It points you toward stocks more likely to have genuine momentum behind them, rather than scanning the entire market randomly.
Level 3: Build a Watchlist You Actually Know
Rather than scanning the entire market fresh every day, maintain a working watchlist of fifteen to twenty-five liquid stocks.
Ideally, concentrate it in the sectors showing relative strength from Level 2.
Revisit this list every few weeks, dropping stocks that have lost their trend or liquidity, and adding ones with a clear, tradeable structure.
Finding those replacements is where most of the scanning effort goes.
Stock screeners filter by volume, price action, and trend strength, and some traders now go a step further with AI-based scanners that flag emerging setups across hundreds of stocks at once. I
f you want to explore that route, here’s a detailed look at swing trading with AI and where it genuinely helps. Whatever tool you use, the watchlist logic stays the same: the tool shortlists, and you decide what earns a place.
Familiarity with a smaller, consistent set of stocks builds better pattern recognition over time than jumping between unfamiliar names.
Level 4: What Is the Individual Chart Really Telling You?
This is where most swing trading content actually starts, but as you can see, it is really the fourth step, not the first.
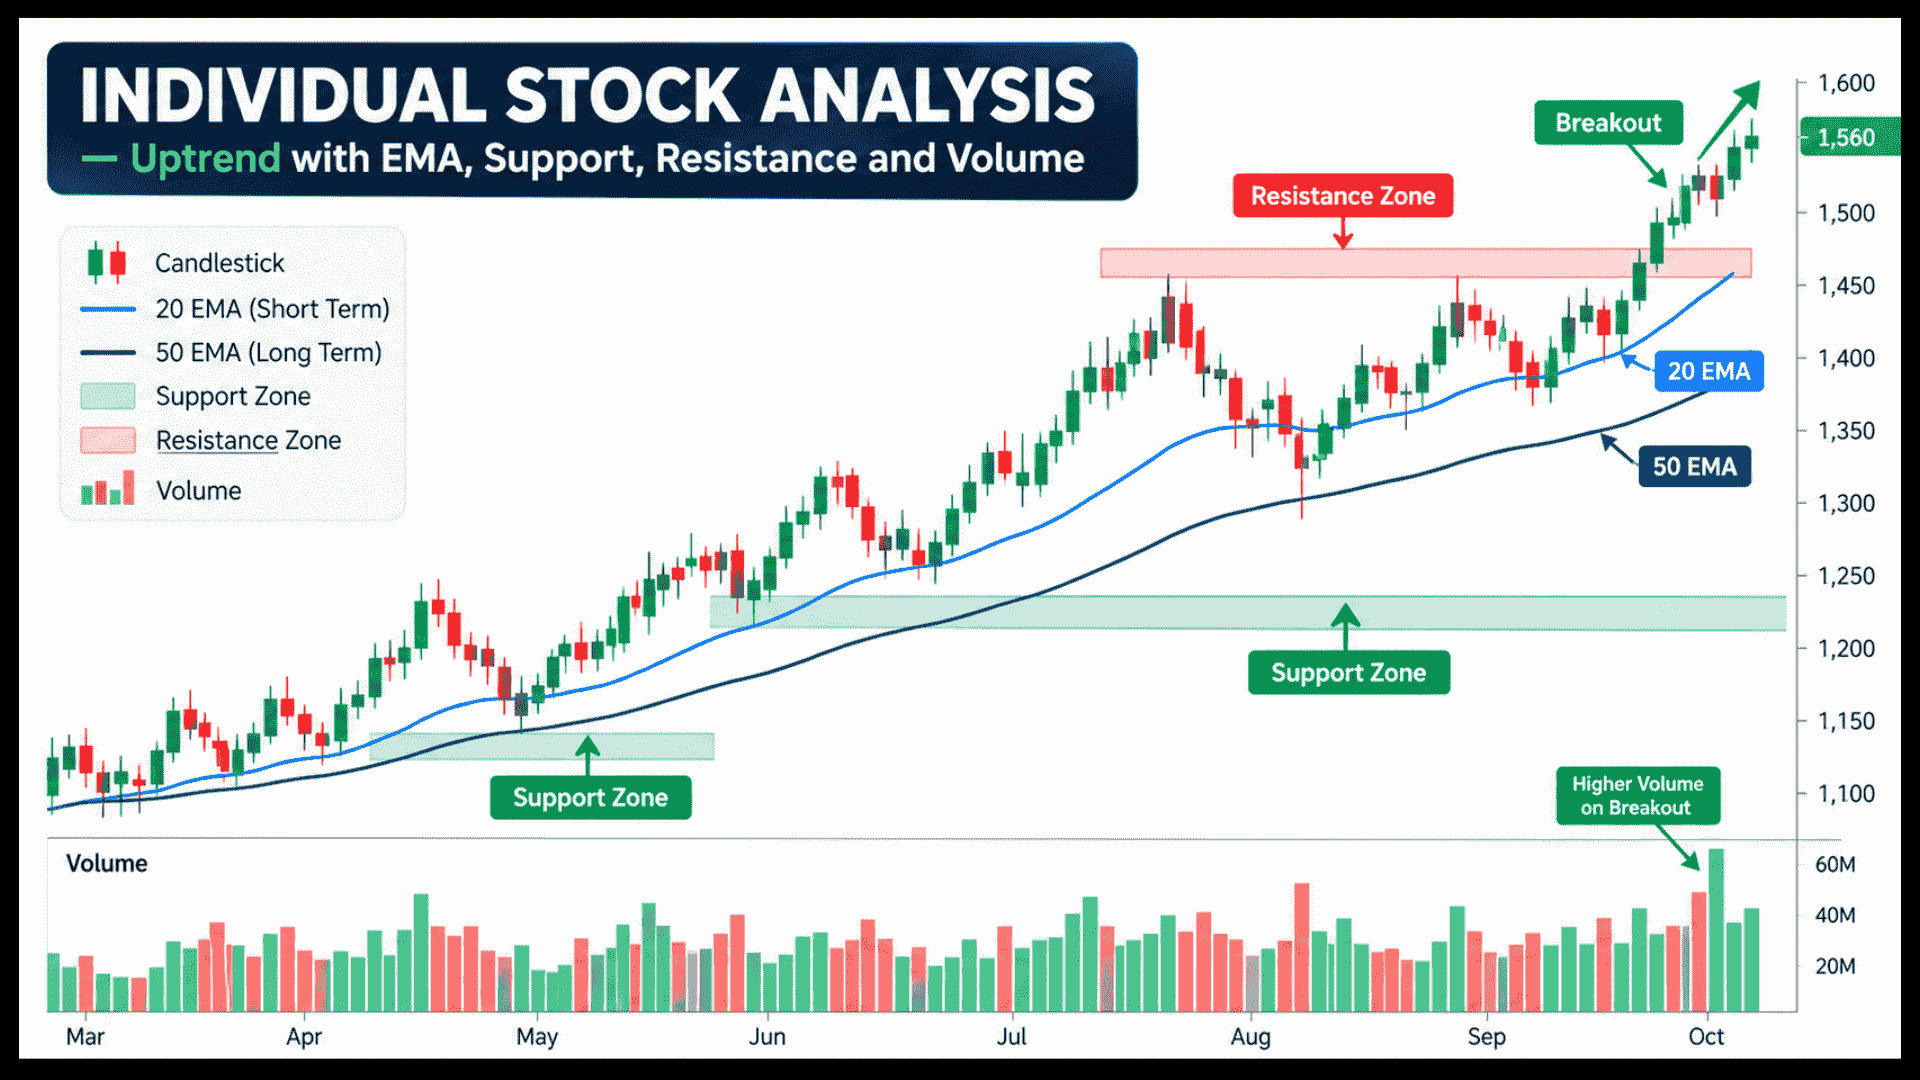
Trend
Higher highs and higher lows (uptrend), or the reverse (downtrend), confirmed on the daily chart.
Support and Resistance
Where has price previously reversed, and how close is current price to one of those zones?
Volume
Is recent volume confirming the move, or is price drifting on unusually thin volume?
One or Two Momentum Indicators
A single trend tool (like the 20/50 EMA) and, if needed, one momentum tool (RSI or MACD).
Avoid stacking five indicators that often disagree with each other.
Chart or Candlestick Pattern
Is there a recognisable setup (a pullback, a breakout, a reversal candle) confirming everything above?
A cup and handle swing trading strategy setup is one example of a pattern that can confirm this layer.
Our swing trading with technical analysis guide covers this individual-stock layer in much greater depth, with dedicated posts on each indicator and pattern.
Level 5: Plan the Trade Before You Enter
Once a stock passes all four levels of your swing trading analysis, the actual trade plan is simple by comparison.
You need a defined entry trigger, a stop loss decided in advance, a realistic target, and a position size calculated from your risk percentage.
Our swing trading risk management guide covers this calculation in full.
What Does a Realistic Weekly Swing Trading Analysis Routine Look Like?
Doing all five levels fresh every day is unnecessary and, frankly, unsustainable. A more realistic routine looks like this:
Weekly
Review the broader market trend and sector relative strength (Levels 1 and 2), and update your watchlist if needed (Level 3).
Daily, After Market Close
Scan your existing watchlist for stocks approaching a setup (Level 4), spending fifteen to twenty minutes reviewing charts.
As Needed
Plan and place orders for any confirmed setup (Level 5), typically the evening before or the morning of entry.
This structure means the heavy analytical lifting happens once a week, while the daily routine stays quick and focused.
Why Do “Clean” Setups Fail When You Skip the Top-Down Steps?
A stock can look like a textbook-perfect EMA pullback while its entire sector is quietly falling out of favour.
Or the broader index may be showing clear signs of a coming correction.
Traders who jump straight to Level 4 miss this context entirely.
They end up puzzled when a “clean” setup fails for reasons that were visible earlier in the process, just not on the one chart they were staring at.
Pass or Fail? Try a Simple Scoring Approach Instead
Rather than treating each level of swing trading analysis as a strict pass or fail gate, some traders score each level loosely: strong, neutral, or weak.
They only proceed to a full trade plan when most levels are genuinely strong, rather than demanding perfection at every stage.
A stock might show a neutral broader market (Level 1) but a strong individual setup with excellent volume confirmation (Level 4).
That combination can still be worth trading, just with a slightly smaller position size, reflecting the marginally higher uncertainty involved.
Are You Making These Swing Trading Analysis Mistakes?
Mistake 1: Jumping Straight to the Stock Chart
The most common mistake is skipping straight to Level 4 without checking the broader market or sector context first.
This leads to technically clean setups failing for reasons visible earlier in the process, just on a different chart.
Mistake 2: Over-Analysing Until the Setup Is Gone
The second is over-analysing a single stock for so long that the setup window passes before a decision gets made.
The five-level framework is meant to speed up decision-making by narrowing focus progressively, not to add more deliberation time.
How Does This Framework Grow With You?
Early on, working through all five levels deliberately, even writing them down, helps build the habit.
Because the process is structured and repeatable, it gives new traders a solid foundation to build on, and it pairs naturally with a simple swing trading strategy for beginners that defines exactly when to enter and exit.
With enough repetition, experienced swing traders often internalise this process until it happens almost automatically.
Glancing at the index and sector charts becomes second nature before ever opening an individual stock’s chart.
Want Help Building This Analysis Routine?
A top-down framework sounds straightforward written out, but building the habit of following it, week after week, takes structure and accountability.
Our Best swing trading classes walk through this exact process live, with real market and sector context every trading day.
Conclusion
Good swing trading analysis works from the outside in. Start with the broader market, narrow to sectors showing relative strength, keep a focused watchlist, and only then study the individual chart.
Each level filters out trades that look clean but fight the bigger picture. Plan every trade before entering, with a defined stop loss and position size.
Keep the heavy lifting weekly and the daily review short. Follow this routine consistently, and your setups will carry more context, more confidence and fewer avoidable losses.
Frequently asked questions
Before investing capital, invest your time in learning Stock Market.
Fill in the basic details below and a callback will be arranged for more information: